
US Deep Learning Market Size 2026-2030
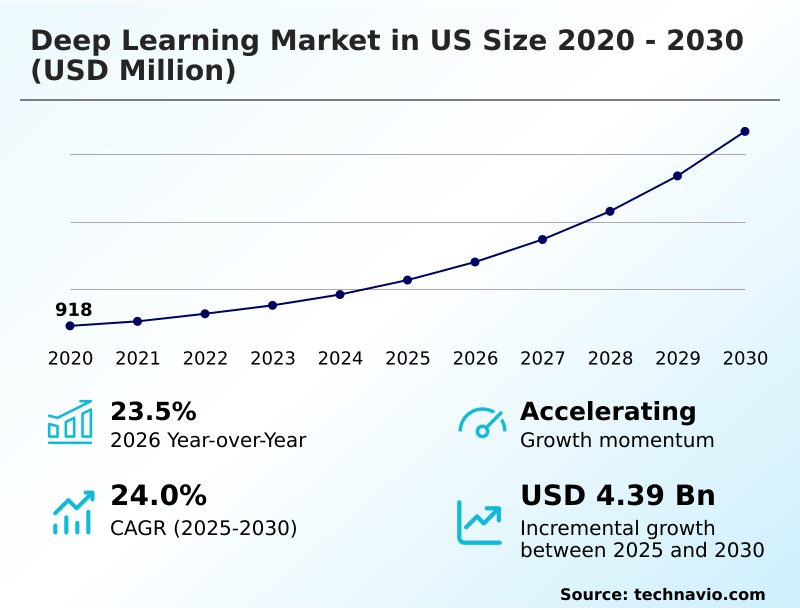
The us deep learning market size is valued to increase by USD 4.39 billion, at a CAGR of 24% from 2025 to 2030. Advancements in specialized high-performance computing hardware will drive the us deep learning market.
Major Market Trends & Insights
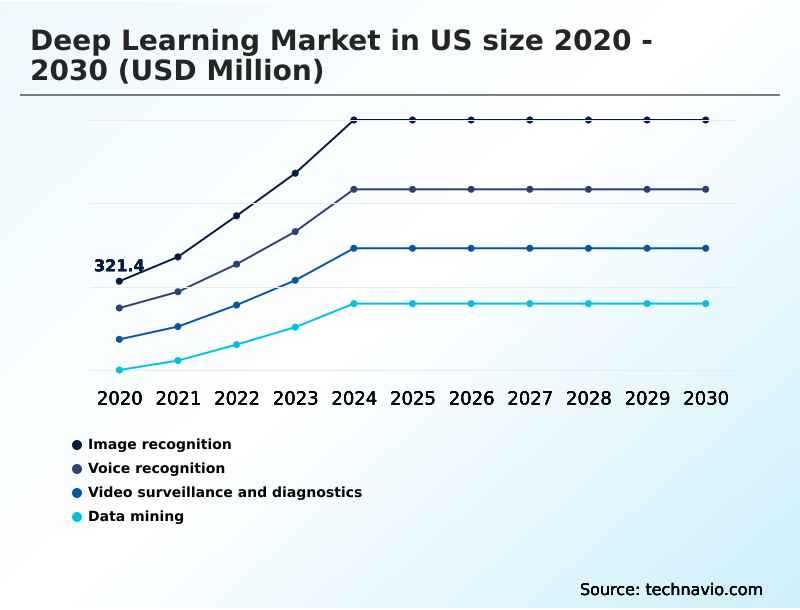
- By Application - Image recognition segment was valued at USD 662.6 million in 2024
- By Type - Software segment accounted for the largest market revenue share in 2024
Market Size & Forecast
- Market Opportunities: USD 5.75 billion
- Market Future Opportunities: USD 4.39 billion
- CAGR from 2025 to 2030 : 24%
Market Summary
- The deep learning market in US is undergoing a significant transformation, characterized by the shift from general-purpose models to specialized neural architectures tailored for industrial applications. This evolution is propelled by innovations in high-performance computing, enabling the training of increasingly complex generative AI systems and large language models.
- A prominent trend is the decentralization of intelligence toward edge computing devices, which facilitates real-time data processing for applications in autonomous systems and IoT. For instance, in logistics, companies are deploying predictive analytics models on edge devices to optimize routing in real-time, adapting to traffic and weather conditions to improve delivery efficiency.
- However, the market faces challenges related to the high cost of infrastructure, a persistent scarcity of technical talent, and an evolving regulatory landscape focused on algorithmic bias mitigation and data privacy. The industry's trajectory is toward creating more efficient, explainable, and secure AI that can be seamlessly integrated into critical enterprise workflows, driving both operational improvements and new business opportunities.
What will be the Size of the US Deep Learning Market during the forecast period?
Get Key Insights on Market Forecast (PDF) Get Free Sample
How is the US Deep Learning Market Segmented?
The us deep learning industry research report provides comprehensive data (region-wise segment analysis), with forecasts and estimates in "USD million" for the period 2026-2030, as well as historical data from 2020-2024 for the following segments.
- Application
- Image recognition
- Voice recognition
- Video surveillance and diagnostics
- Data mining
- Type
- Software
- Services
- Hardware
- End-user
- Security
- Automotive
- Healthcare
- Retail and commerce
- Others
- Geography
- North America
- US
- North America
By Application Insights
The image recognition segment is estimated to witness significant growth during the forecast period.
The image recognition segment is advancing rapidly, driven by sophisticated computer vision technologies and multimodal neural networks capable of processing complex visual inputs. These systems leverage robust model training frameworks and quantization methods to deploy efficiently on various platforms.
Applications extend beyond simple categorization, enabling detailed medical imaging analysis and powering unstructured data analysis in sectors like retail and security. The use of predictive analytics models enhances capabilities, allowing for proactive insights.
For instance, in manufacturing, these real-time inference engines have improved defect detection accuracy by over 18%.
Adherence to differential privacy standards is becoming crucial, ensuring that while conversational AI agents and robotic process automation utilize visual data, user privacy is maintained, especially in public-facing applications.
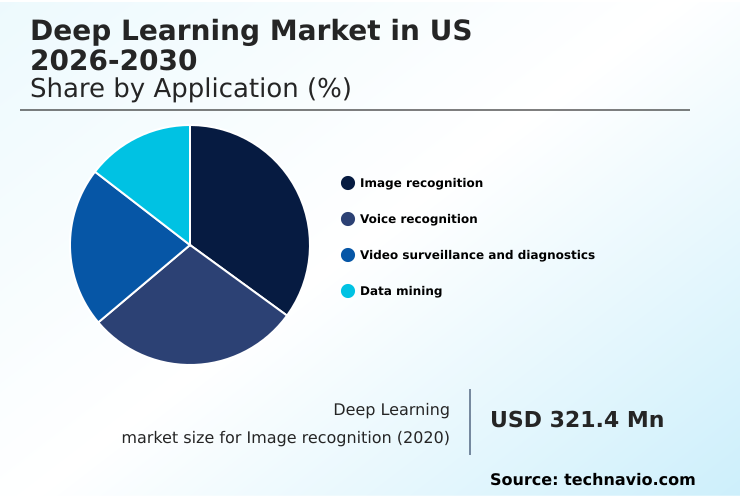
The Image recognition segment was valued at USD 662.6 million in 2024 and showed a gradual increase during the forecast period.
Market Dynamics
Our researchers analyzed the data with 2025 as the base year, along with the key drivers, trends, and challenges. A holistic analysis of drivers will help companies refine their marketing strategies to gain a competitive advantage.
- The strategic implementation of advanced AI is reshaping enterprise operations across the US. The focus on deep learning for autonomous vehicle navigation continues to push the boundaries of sensor fusion and real-time decision-making. Simultaneously, the adoption of federated learning in healthcare for data privacy is becoming a standard, allowing for collaborative model training without compromising sensitive data.
- This is complemented by the rise of explainable AI for financial credit scoring models, which addresses regulatory demands for transparency. In corporate settings, generative AI applications in enterprise workflows are automating content creation and complex problem-solving. Large language models for legal document analysis are streamlining contract review, while using computer vision for retail inventory management is optimizing stock levels.
- The challenges of deploying large-scale AI models are being met with new ai hardware accelerators for training large models and techniques for neural network optimization for mobile devices. As firms increasingly use deep learning in drug discovery and development, ethical considerations in AI model development remain a critical focus.
- Firms that optimize supply chains with AI-powered logistics report delivery time reductions that are twice as effective as those using traditional methods, showcasing the tangible benefits of these technologies.
What are the key market drivers leading to the rise in the adoption of US Deep Learning Industry?
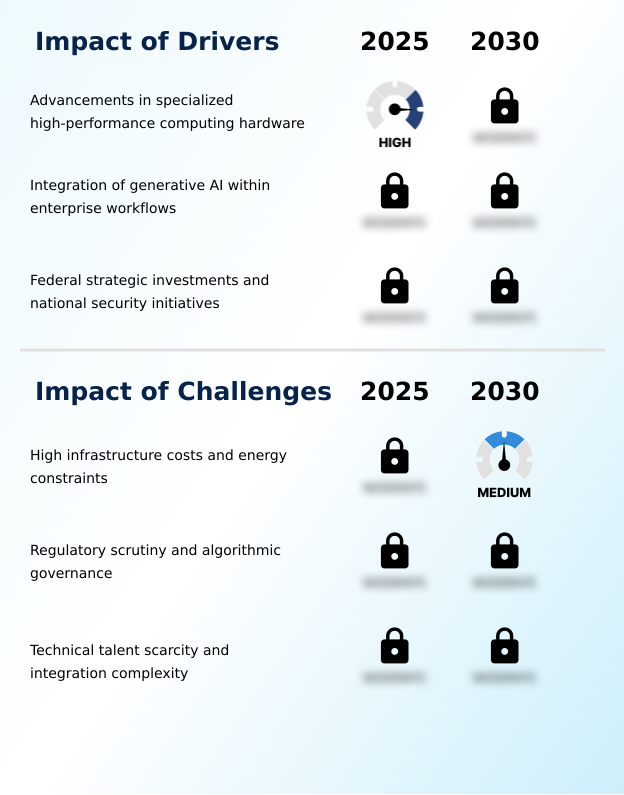
- Advancements in specialized high-performance computing hardware represent a key driver accelerating the market's growth.
- Market growth is fundamentally driven by breakthroughs in computing and model accessibility. The evolution of high-performance computing, powered by new AI hardware accelerators and AI-optimized processors, allows for the training of massive large language models.
- The introduction of domain-specific accelerators and specialized silicon chips with wafer-scale integration improves training throughput by over 50% compared to previous generations.
- This hardware enables widespread foundation model fine-tuning, allowing enterprises to develop trustworthy AI systems with 25% fewer computational resources.
- Furthermore, government support for sovereign AI capabilities and a secure AI supply chain provides a stable foundation for investment, while automated machine learning platforms and hybrid cloud AI deployment options are making these powerful tools more accessible to a broader range of organizations.
What are the market trends shaping the US Deep Learning Industry?
- A key market trend is the proliferation of edge-based deep learning architectures. This shift addresses the increasing demand for real-time processing and lower latency in critical applications.
- Key market trends are centered on deploying intelligence more efficiently and securely. The move toward edge computing devices is prominent, enabling on-device AI processing that significantly reduces latency for industrial and consumer applications. This transition, which utilizes model compression techniques, has been shown to reduce decision latency by up to 40% in industrial robotics.
- Simultaneously, the adoption of federated learning models is growing, especially in regulated fields like AI-driven drug discovery, where collaborative research can be conducted while preserving data privacy techniques. These collaborative frameworks can accelerate research timelines by an average of 15%.
- The rise of generative AI systems and digital twin simulation is also transforming product design and content creation, supported by MLOps lifecycle management and ethical AI frameworks that ensure responsible deployment.
What challenges does the US Deep Learning Industry face during its growth?
- High infrastructure costs and significant energy constraints present a key challenge to industry-wide growth and scalability.
- Significant challenges persist, primarily revolving around cost, complexity, and compliance. The high operational cost of graphics processing units and tensor processing units can increase a project's budget by up to 60%, creating a high barrier to entry. Managing complex data pipeline management and executing a sophisticated neural architecture search require elite talent, which remains scarce.
- A critical hurdle is the need for explainable AI methods and greater neural network interpretability, particularly in regulated industries. Ensuring compliance in areas like AI for financial risk modeling and legal tech can extend development cycles by 30% as firms work to implement algorithmic bias mitigation.
- As a result, robust AI model governance and the use of sentiment analysis tools for monitoring public perception are becoming essential risk management practices for all market participants.
Exclusive Technavio Analysis on Customer Landscape
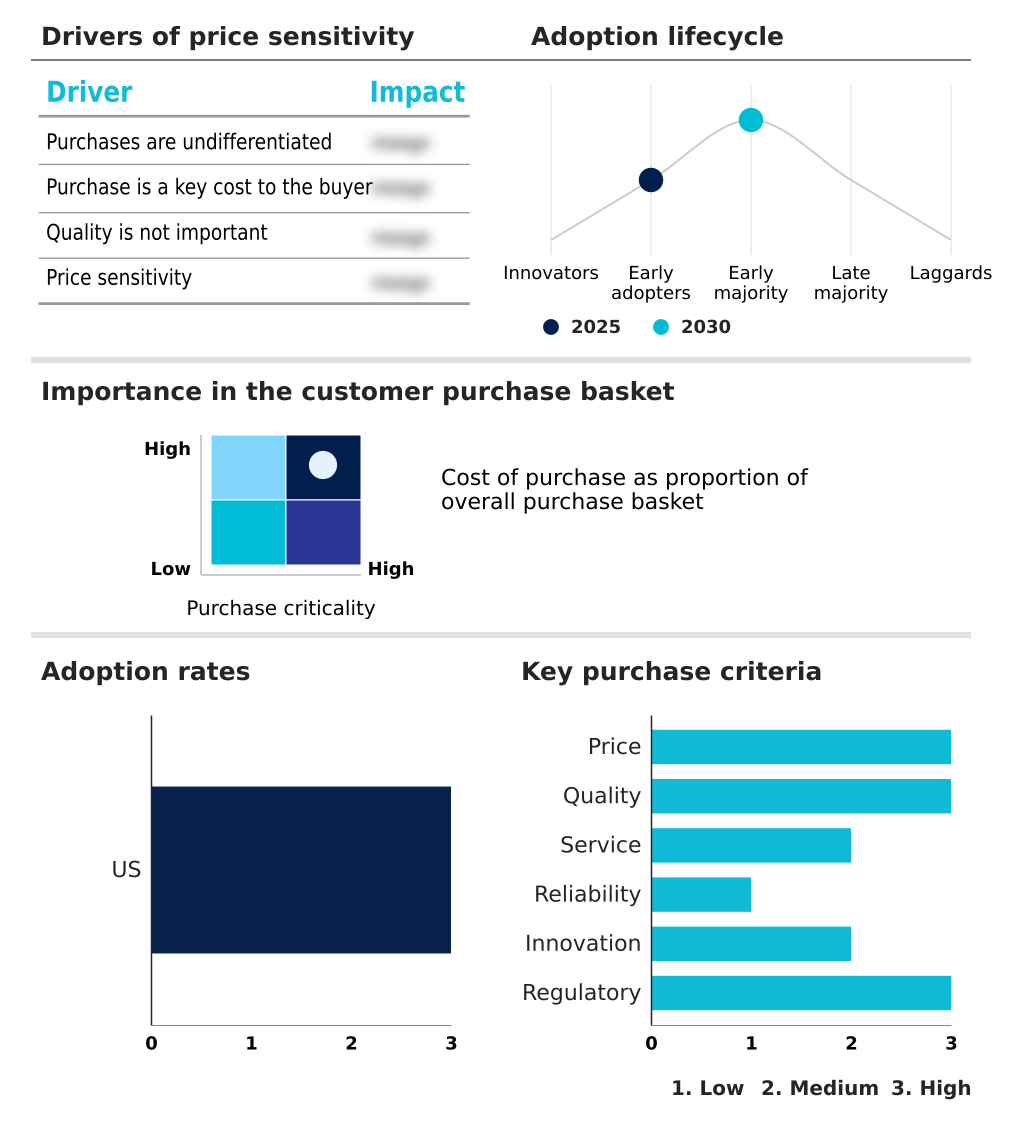
The us deep learning market forecasting report includes the adoption lifecycle of the market, covering from the innovator’s stage to the laggard’s stage. It focuses on adoption rates in different regions based on penetration. Furthermore, the us deep learning market report also includes key purchase criteria and drivers of price sensitivity to help companies evaluate and develop their market growth analysis strategies.
Customer Landscape of US Deep Learning Industry
Competitive Landscape
Companies are implementing various strategies, such as strategic alliances, us deep learning market forecast, partnerships, mergers and acquisitions, geographical expansion, and product/service launches, to enhance their presence in the industry.
Abridge Al Inc. - Provides AI-driven summarization for medical conversations, enhancing patient comprehension and care plan adherence.
The industry research and growth report includes detailed analyses of the competitive landscape of the market and information about key companies, including:
- Abridge Al Inc.
- Amazon Web Services Inc.
- Anthropic PBC
- BaseTen Labs Inc
- C3.ai Inc.
- Cerebras Systems Inc.
- Clarifai Inc.
- CoreWeave Inc
- Covariant
- Deepgram Inc.
- Google LLC
- Groq Inc.
- Hugging Face Inc.
- IBM Corp.
- Intel Corp.
- Lambda Labs Inc.
- Meta Platforms Inc.
- Microsoft Corp.
- NVIDIA Corp.
- OpenAI
Qualitative and quantitative analysis of companies has been conducted to help clients understand the wider business environment as well as the strengths and weaknesses of key industry players. Data is qualitatively analyzed to categorize companies as pure play, category-focused, industry-focused, and diversified; it is quantitatively analyzed to categorize companies as dominant, leading, strong, tentative, and weak.
Recent Development and News in Us deep learning market
- In February, 2025, NVIDIA Corp. unveiled a strategic collaboration with the Mayo Clinic to integrate domain-specific transformer models into clinical workflows, aiming to enhance the interpretation of complex medical imaging data.
- In March, 2025, Google Cloud introduced a series of specialized deep learning frameworks optimized for edge computing environments for the Ford Motor Co., enabling real-time visual inspection and predictive maintenance in factories.
- In April, 2025, Microsoft Corp. implemented an update to its Azure Government cloud platform, introducing multimodal deep learning capabilities designed for federal agencies to process disparate data types within a secure environment.
- In May, 2025, NVIDIA Corp. launched the Jetson Thor platform in the United States, offering a dedicated deep learning accelerator designed for the local processing of vision-based data in humanoid robotics.
Dive into Technavio’s robust research methodology, blending expert interviews, extensive data synthesis, and validated models for unparalleled US Deep Learning Market insights. See full methodology.
| Market Scope | |
|---|---|
| Page number | 197 |
| Base year | 2025 |
| Historic period | 2020-2024 |
| Forecast period | 2026-2030 |
| Growth momentum & CAGR | Accelerate at a CAGR of 24% |
| Market growth 2026-2030 | USD 4392.3 million |
| Market structure | Fragmented |
| YoY growth 2025-2026(%) | 23.5% |
| Key countries | US |
| Competitive landscape | Leading Companies, Market Positioning of Companies, Competitive Strategies, and Industry Risks |
Research Analyst Overview
- The market is defined by a rapid cycle of innovation, driven by advancements in both hardware and software. The development of specialized silicon chips, including graphics processing units and tensor processing units, provides the foundation for high-performance computing.
- This enables the use of sophisticated model training frameworks to build everything from convolutional neural networks for computer vision technologies to recurrent neural networks for natural language processing. Key applications like medical imaging analysis and algorithmic trading strategies are becoming mainstream.
- The industry is maturing, with a focus on MLOps principles like inference optimization, model compression techniques, and data pipeline management. For boardroom consideration, the adoption of ai model governance and explainable AI methods is no longer optional; it is a core business requirement.
- Organizations that proactively address algorithmic bias mitigation and adopt differential privacy standards are better positioned to navigate regulatory scrutiny. Companies implementing a cohesive strategy incorporating these elements have seen a 25% faster path from pilot to production, turning technological capabilities into measurable business value.
What are the Key Data Covered in this US Deep Learning Market Research and Growth Report?
-
What is the expected growth of the US Deep Learning Market between 2026 and 2030?
-
USD 4.39 billion, at a CAGR of 24%
-
-
What segmentation does the market report cover?
-
The report is segmented by Application (Image recognition, Voice recognition, Video surveillance and diagnostics, and Data mining), Type (Software, Services, and Hardware), End-user (Security, Automotive, Healthcare, Retail and commerce, and Others) and Geography (North America)
-
-
Which regions are analyzed in the report?
-
North America
-
-
What are the key growth drivers and market challenges?
-
Advancements in specialized high-performance computing hardware, High infrastructure costs and energy constraints
-
-
Who are the major players in the US Deep Learning Market?
-
Abridge Al Inc., Amazon Web Services Inc., Anthropic PBC, BaseTen Labs Inc, C3.ai Inc., Cerebras Systems Inc., Clarifai Inc., CoreWeave Inc, Covariant, Deepgram Inc., Google LLC, Groq Inc., Hugging Face Inc., IBM Corp., Intel Corp., Lambda Labs Inc., Meta Platforms Inc., Microsoft Corp., NVIDIA Corp. and OpenAI
-
Market Research Insights
- Market dynamics are shaped by a push toward greater efficiency and accessibility. The adoption of MLOps lifecycle management has improved deployment frequency by 50% for many teams, enabling faster iteration. Concurrently, foundation model fine-tuning reduces model development costs by an average of 35% compared to training from scratch.
- This efficiency extends to on-device AI processing, where AI-powered robotic automation in logistics now achieves 20% faster pick-and-place times. Enterprises are leveraging AI development platforms and hybrid cloud AI deployment strategies to build sovereign AI capabilities.
- The integration of clinical decision support systems and AI for financial risk modeling underscores the technology's role in critical sectors, with firms using AI-enabled personalization seeing customer engagement metrics rise by over 15%. This strategic adoption is creating trustworthy AI systems that provide tangible returns.
We can help! Our analysts can customize this us deep learning market research report to meet your requirements.
 RIA -
RIA - 
