Probiotics Market Analysis US - Size and Forecast 2024-2028

Probiotics Market Analysis US - Size and Forecast 2024-2028

Published: Feb 2024 146 Pages SKU: IRTNTR77523

Market Overview at a Glance

$4.98 B
Market Opportunity
8.16%
CAGR
7.68
YoY growth 2023-2024(%)

US Probiotics Market Size 2024-2028 

The US probiotics market size is forecast to increase by USD 4.98 billion at a CAGR of 8.16% between 2023 and 2028. The market is witnessing significant growth, driven by the rising health consciousness and increasing demand for synbiotic solutions that offer digestive health benefits. Probiotics, such as Probi Defendum and Probi Digestis, are increasingly being used in various applications beyond food and beverages, including the cosmetic industry Probiotics' role in enhancing skin health is gaining popularity. However, the market remains fragmented, with numerous players offering probiotic yogurts, fermented milk, and other dairy products under various brand names like Gut Glory. This fragmentation presents both opportunities and challenges, as consumers are spoilt for choice but may also encounter counterfeit probiotic products, which can negatively impact the market's reputation. Overall, the market's growth is expected to continue, fueled by increasing consumer awareness and the expanding range of applications for probiotics.

Probiotics Market in US Size

 Request Free Sample

Probiotics have gained significant attention in the US healthcare market due to their potential health benefits for gut flora and immune health. The market for probiotics includes probiotic-rich foods, beverages, and dietary supplements. Irritable Bowel Syndrome (IBS) and other digestive disorders are major health concerns driving the demand for probiotics. Probiotics are known to improve gut health and microbiome health by introducing beneficial bacteria into the digestive system. Probiotics are used to alleviate gastrointestinal discomfort, preventative healthcare, and boost immune health. Probiotic-rich foods such as yogurt, fermented milk, and some beverages are popular sources of probiotics. Synbiotic solutions that combine probiotics with prebiotics are gaining popularity due to their ability to enhance the effectiveness of probiotics.

Furthermore, the epidemiology of digestive disorders and the increasing focus on preventive healthcare are expected to fuel the growth of the market. The market is fragmented, with a wide range of products and brands catering to different consumer preferences and health concerns. Ingredients like Probi Defendum and Probi Digestis are commonly used in probiotic supplements and functional foods. The healthcare infrastructure continues to support the growth of the market by offering easy access to probiotic products and services.

Market Segmentation

The market research report provides comprehensive data (region-wise segment analysis), with forecasts and estimates in "USD billion" for the period 2024-2028, as well as historical data from 2018-2022 for the following segments.

  • Distribution Channel
    • Offline
    • Online
  • End-user
    • Human probiotics
    • Animal probiotics
  • Product
    • Probiotic functional food and beverage
    • Supplements
    • Animal feed
  • Geography
    • US

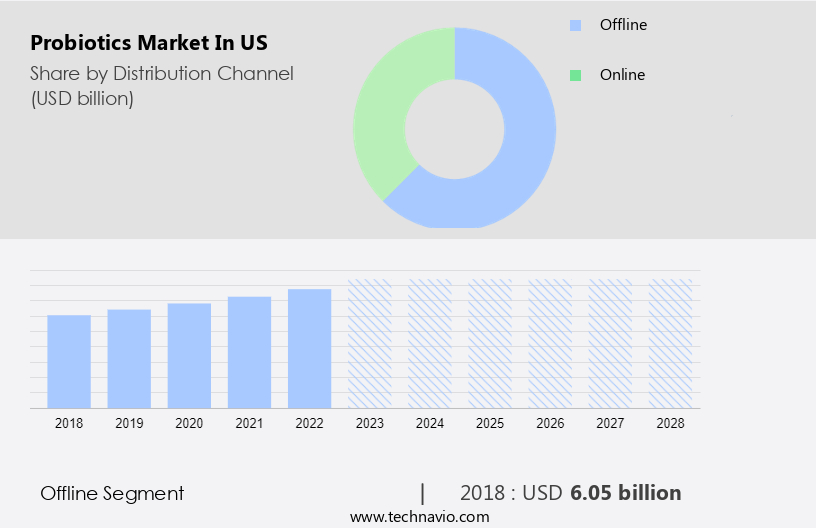
By Distribution Channel Insights

The offline segment is estimated to witness significant growth during the forecast period. The market has experienced notable growth due to increasing health consciousness and the focus on preventive healthcare. Consumers are increasingly seeking products that support gut health and microbiome balance, leading to a rise in demand for probiotics. Yogurt remains a popular source of probiotics, but dietary supplements are also gaining traction as convenient alternatives. Wellness programs and chronic disease management plans are incorporating probiotics to enhance their offerings. Offline channels, including supermarkets, hypermarkets, and pharmacies, continue to dominate the market. Brick-and-mortar stores like Walmart Inc., Target, Kmart, and Walgreens have long sold probiotic products, and the growing awareness of individual health needs has led to the expansion of their offerings to include feminine probiotic supplements.

Furthermore, the credible and trusted information provided by offline channels contributes significantly to the growth of this segment. Animal probiotics are also gaining popularity as consumers seek to improve the health of their pets. Overall, the market is expected to continue its expansion as consumers prioritize their health and seek natural solutions for digestive and other health concerns.

Probiotics Market in US Size

Get a glance at the market share of various segments Request Free Sample

The offline segment was valued at USD 6.05 billion in 2018 and showed a gradual increase during the forecast period.

Our market researchers analyzed the data with 2023 as the base year, along with the key drivers, trends, and challenges. A holistic analysis of drivers will help companies refine their marketing strategies to gain a competitive advantage.

Market Driver

The health benefits of probiotics is the key driver of the market. Probiotics play a crucial role in maintaining a healthy gut by preventing the growth of harmful bacteria in the digestive tract. This leads to improved nutrition absorption and regular bowel movements. Probiotic supplements, particularly Lactobacilli strains, have been shown to benefit women's health by preventing diseases such as bacterial vaginosis, yeast infections, and urinary tract infections. Probiotics also contribute to animal health.

Furthermore, consumption of probiotic-rich foods and beverages, such as yogurt, kefir, sauerkraut, and kimchi, or supplements, helps restore the interstitial microbial balance by lowering pH levels. Clinical studies have demonstrated that probiotics inhibit the growth of harmful microbes, including Candida, Escherichia coli, Helicobacter pylori, and Salmonella. Additionally, probiotics have been linked to reducing dental caries, preventing oral candida infections, and managing periodontitis.

Market Trends

The increasing application of probiotics in the cosmetic industry is the upcoming trend in the market. Probiotics, the beneficial microorganisms that support gut health, have gained significant attention in the US market due to their potential benefits in addressing various digestive disorders, including Irritable Bowel Syndrome (IBS). With an increasing focus on immune health, probiotics have become a popular choice for consumers seeking natural remedies.

Moreover, probiotic-rich foods, such as fermented milk and yogurt, as well as probiotic supplements and beverages, have flooded the market. The gut-skin axis, a concept that highlights the interconnection between gut health and skin conditions, further prioritizes the importance of probiotics in maintaining overall wellness. Consumers' preference for natural and holistic solutions has fueled the demand for probiotic products, making them a promising market in the US.

Market Challenge

The availability of counterfeit probiotic products is a key challenge affecting market growth. Probiotics, beneficial bacteria that support gut flora and contribute to digestive health, have gained significant popularity in the US market due to their potential benefits for individuals with digestive disorders, including Irritable Bowel Syndrome (IBS). The demand for probiotics has led to an expansion of the market, with offerings in probiotic-rich foods, beverages, and supplements.

However, the unregulated market has also given rise to counterfeit probiotic products. Regulatory authorities have been working diligently to identify and take legal action against these manufacturers, who sell their products online, often targeting unsuspecting consumers. The production and sale of these counterfeit probiotics, which lack legal approval from regulatory bodies, can result in serious consequences, including company closures. Consumers are advised to ensure they purchase probiotic products from reputable sources to maintain immune health and avoid potential harm.

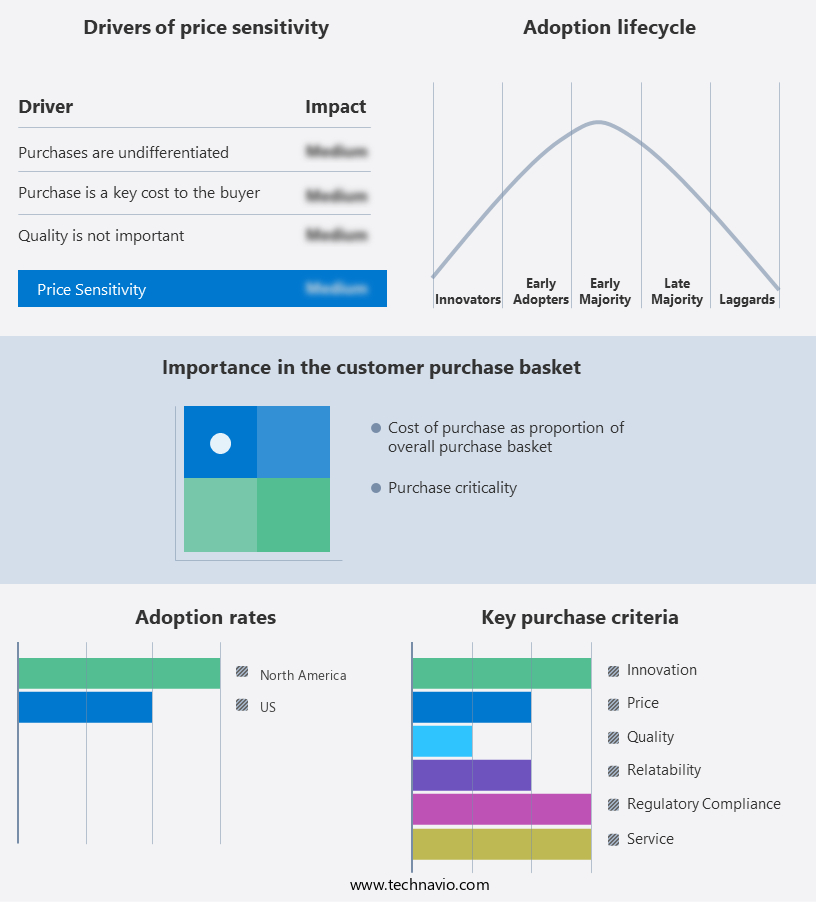
Exclusive Customer Landscape

The market forecasting report includes the adoption lifecycle of the market, covering from the innovator's stage to the laggard's stage. It focuses on adoption rates in different regions based on penetration. Furthermore, the report also includes key purchase criteria and drivers of price sensitivity to help companies evaluate and develop their market growth analysis strategies.

Probiotics Market in US Share by Geography

 Customer Landscape

Key Companies & Market Insights

Companies are implementing various strategies, such as strategic alliances, partnerships, mergers and acquisitions, geographical expansion, and product/service launches, to enhance their presence in the market.

BioGaia AB - The company offers probiotics such as BioGaia Prodentis Probiotic Lozenges, BioGaia Gastrus Probiotic Chewables, and BioGaia Osfortis Probiotic Capsules.

The market research and growth report includes detailed analyses of the competitive landscape of the market and information about key companies, including:

  • Chr Hansen Holding AS
  • CUSTOM PROBIOTICS Inc.
  • Danone
  • DuPont de Nemours Inc.
  • General Mills Inc.
  • InnovixLabs
  • Jarrow Formulas Inc.
  • Koninklijke DSM NV
  • Lallemand Inc.
  • Lifeway Foods Inc.
  • Nestle SA
  • NOW Health Group Inc.
  • Otsuka Holdings Co. Ltd.
  • PepsiCo Inc.
  • Reckitt Benckiser Group Plc
  • SFI Health
  • Swanson Health Products Inc.
  • Symrise AG
  • The Procter and Gamble Co.
  • Thorne HealthTech Inc.
  • Twinlab Consolidated Holdings Inc.
  • Yakult Honsha Co. Ltd.

Qualitative and quantitative analysis of companies has been conducted to help clients understand the wider business environment as well as the strengths and weaknesses of key market players. Data is qualitatively analyzed to categorize companies as pure play, category-focused, industry-focused, and diversified; it is quantitatively analyzed to categorize companies as dominant, leading, strong, tentative, and weak.

Research Analyst Overview

Probiotics have gained significant attention in the US market due to their role in maintaining gut flora and promoting immune health. The market for probiotics encompasses various applications, including digestive disorders such as Irritable Bowel Syndrome (IBS), preventive healthcare, and animal probiotics. Probiotics are available in various forms, including probiotic-rich foods like yogurt, fermented milk, and beverages, as well as dietary supplements, functional foods, and nutraceuticals. Health claims associated with probiotics include improving gut health, microbiome health, immune system function, and alleviating gastrointestinal discomfort. The market is fragmented, with numerous online stores offering a wide range of probiotic products.

Furthermore, consumers are increasingly health-conscious and seek natural, organic probiotics to meet their dietary needs. The epidemiology of chronic diseases, such as antibiotic-associated diarrhea and lactose intolerance, has fueled the demand for probiotics. Pharmaceutical agents and clinical trials are being explored to further validate the health benefits of probiotics. Synbiotic solutions, which combine probiotics with prebiotics, are also gaining popularity. The market is expected to grow as consumers seek to maintain a healthy gut and immune system.

Market Scope

Report Coverage

Details

Page number

146

Base year

2023

Historic period

2018-2022

Forecast period

2024-2028

Growth momentum & CAGR

Accelerate at a CAGR of 8.16%

Market Growth 2024-2028

USD 4.98 billion

Market structure

Fragmented

YoY growth 2023-2024(%)

7.68

Key companies profiled

BioGaia AB, Chr Hansen Holding AS, CUSTOM PROBIOTICS Inc., Danone, DuPont de Nemours Inc., General Mills Inc., InnovixLabs, Jarrow Formulas Inc., Koninklijke DSM NV, Lallemand Inc., Lifeway Foods Inc., Nestle SA, NOW Health Group Inc., Otsuka Holdings Co. Ltd., PepsiCo Inc., Reckitt Benckiser Group Plc, SFI Health, Swanson Health Products Inc., Symrise AG, The Procter and Gamble Co., Thorne HealthTech Inc., Twinlab Consolidated Holdings Inc., and Yakult Honsha Co. Ltd.

Market dynamics

Parent market analysis, market forecast, market growth inducers and obstacles,market forecast , fast-growing and slow-growing segment analysis, COVID-19 impact and recovery analysis and future consumer dynamics, market condition analysis for the forecast period

Customization purview

If our market report has not included the data that you are looking for, you can reach out to our analysts and get segments customized.

Competitive landscape

Leading Companies, Market Positioning of Companies, Competitive Strategies, and Industry Risks

Request Free Sample

What are the Key Data Covered in this Market Research Report?

  • CAGR of the market during the forecast period
  • Detailed information on factors that will drive the market growth and forecasting between 2024 and 2028
  • Precise estimation of the size of the market  and its contribution of the market in focus to the parent market
  • Accurate predictions about upcoming market growth and trends and changes in consumer behaviour
  • Growth of the market across US
  • Thorough analysis of the market's competitive landscape and detailed information about companies
  • Comprehensive analysis of factors that will challenge the growth of market companies

We can help! Our analysts can customize this market research report to meet your requirements Get in touch

1 Executive Summary

  • 1.1 Market overview
    • Exhibit 01: Executive Summary – Chart on Market Overview
    • Exhibit 02: Executive Summary – Data Table on Market Overview
    • Exhibit 03: Executive Summary – Chart on Country Market Characteristics
    • Exhibit 04: Executive Summary – Chart on Market Segmentation by Distribution Channel
    • Exhibit 05: Executive Summary – Chart on Market Segmentation by End-user
    • Exhibit 06: Executive Summary – Chart on Market Segmentation by Product
    • Exhibit 07: Executive Summary – Chart on Vendor Market Positioning

2 Market Landscape

  • 2.1 Market ecosystem
    • Exhibit 08: Parent market
    • Exhibit 09: Market Characteristics

3 Market Sizing

  • 3.1 Market definition
    • Exhibit 10: Offerings of vendors included in the market definition
  • 3.2 Market segment analysis
    • Exhibit 11: Market segments
  • 3.3 Market size 2023
    • 3.4 Market outlook: Forecast for 2023-2028
      • Exhibit 12: Chart on US - Market size and forecast 2023-2028 ($ billion)
      • Exhibit 13: Data Table on US - Market size and forecast 2023-2028 ($ billion)
      • Exhibit 14: Chart on US: Year-over-year growth 2023-2028 (%)
      • Exhibit 15: Data Table on US: Year-over-year growth 2023-2028 (%)

    4 Historic Market Size

    • 4.1 Probiotics market in US 2018 - 2022
      • Exhibit 16: Historic Market Size – Data Table on probiotics market in US 2018 - 2022 ($ billion)
    • 4.2 Distribution Channel Segment Analysis 2018 - 2022
      • Exhibit 17: Historic Market Size – Distribution Channel Segment 2018 - 2022 ($ billion)
    • 4.3 End-user Segment Analysis 2018 - 2022
      • Exhibit 18: Historic Market Size – End-user Segment 2018 - 2022 ($ billion)
    • 4.4 Product Segment Analysis 2018 - 2022
      • Exhibit 19: Historic Market Size – Product Segment 2018 - 2022 ($ billion)

    5 Five Forces Analysis

    • 5.1 Five forces summary
      • Exhibit 20: Five forces analysis - Comparison between 2023 and 2028
    • 5.2 Bargaining power of buyers
      • Exhibit 21: Chart on Bargaining power of buyers – Impact of key factors 2023 and 2028
    • 5.3 Bargaining power of suppliers
      • Exhibit 22: Bargaining power of suppliers – Impact of key factors in 2023 and 2028
    • 5.4 Threat of new entrants
      • Exhibit 23: Threat of new entrants – Impact of key factors in 2023 and 2028
    • 5.5 Threat of substitutes
      • Exhibit 24: Threat of substitutes – Impact of key factors in 2023 and 2028
    • 5.6 Threat of rivalry
      • Exhibit 25: Threat of rivalry – Impact of key factors in 2023 and 2028
    • 5.7 Market condition
      • Exhibit 26: Chart on Market condition - Five forces 2023 and 2028

    6 Market Segmentation by Distribution Channel

    • 6.1 Market segments
      • Exhibit 27: Chart on Distribution Channel - Market share 2023-2028 (%)
      • Exhibit 28: Data Table on Distribution Channel - Market share 2023-2028 (%)
    • 6.2 Comparison by Distribution Channel
      • Exhibit 29: Chart on Comparison by Distribution Channel
      • Exhibit 30: Data Table on Comparison by Distribution Channel
    • 6.3 Offline - Market size and forecast 2023-2028
      • Exhibit 31: Chart on Offline - Market size and forecast 2023-2028 ($ billion)
      • Exhibit 32: Data Table on Offline - Market size and forecast 2023-2028 ($ billion)
      • Exhibit 33: Chart on Offline - Year-over-year growth 2023-2028 (%)
      • Exhibit 34: Data Table on Offline - Year-over-year growth 2023-2028 (%)
    • 6.4 Online - Market size and forecast 2023-2028
      • Exhibit 35: Chart on Online - Market size and forecast 2023-2028 ($ billion)
      • Exhibit 36: Data Table on Online - Market size and forecast 2023-2028 ($ billion)
      • Exhibit 37: Chart on Online - Year-over-year growth 2023-2028 (%)
      • Exhibit 38: Data Table on Online - Year-over-year growth 2023-2028 (%)
    • 6.5 Market opportunity by Distribution Channel
      • Exhibit 39: Market opportunity by Distribution Channel ($ billion)
      • Exhibit 40: Data Table on Market opportunity by Distribution Channel ($ billion)

    7 Market Segmentation by End-user

    • 7.1 Market segments
      • Exhibit 41: Chart on End-user - Market share 2023-2028 (%)
      • Exhibit 42: Data Table on End-user - Market share 2023-2028 (%)
    • 7.2 Comparison by End-user
      • Exhibit 43: Chart on Comparison by End-user
      • Exhibit 44: Data Table on Comparison by End-user
    • 7.3 Human probiotics - Market size and forecast 2023-2028
      • Exhibit 45: Chart on Human probiotics - Market size and forecast 2023-2028 ($ billion)
      • Exhibit 46: Data Table on Human probiotics - Market size and forecast 2023-2028 ($ billion)
      • Exhibit 47: Chart on Human probiotics - Year-over-year growth 2023-2028 (%)
      • Exhibit 48: Data Table on Human probiotics - Year-over-year growth 2023-2028 (%)
    • 7.4 Animal probiotics - Market size and forecast 2023-2028
      • Exhibit 49: Chart on Animal probiotics - Market size and forecast 2023-2028 ($ billion)
      • Exhibit 50: Data Table on Animal probiotics - Market size and forecast 2023-2028 ($ billion)
      • Exhibit 51: Chart on Animal probiotics - Year-over-year growth 2023-2028 (%)
      • Exhibit 52: Data Table on Animal probiotics - Year-over-year growth 2023-2028 (%)
    • 7.5 Market opportunity by End-user
      • Exhibit 53: Market opportunity by End-user ($ billion)
      • Exhibit 54: Data Table on Market opportunity by End-user ($ billion)

    8 Market Segmentation by Product

    • 8.1 Market segments
      • Exhibit 55: Chart on Product - Market share 2023-2028 (%)
      • Exhibit 56: Data Table on Product - Market share 2023-2028 (%)
    • 8.2 Comparison by Product
      • Exhibit 57: Chart on Comparison by Product
      • Exhibit 58: Data Table on Comparison by Product
    • 8.3 Probiotic functional food and beverage - Market size and forecast 2023-2028
      • Exhibit 59: Chart on Probiotic functional food and beverage - Market size and forecast 2023-2028 ($ billion)
      • Exhibit 60: Data Table on Probiotic functional food and beverage - Market size and forecast 2023-2028 ($ billion)
      • Exhibit 61: Chart on Probiotic functional food and beverage - Year-over-year growth 2023-2028 (%)
      • Exhibit 62: Data Table on Probiotic functional food and beverage - Year-over-year growth 2023-2028 (%)
    • 8.4 Supplements - Market size and forecast 2023-2028
      • Exhibit 63: Chart on Supplements - Market size and forecast 2023-2028 ($ billion)
      • Exhibit 64: Data Table on Supplements - Market size and forecast 2023-2028 ($ billion)
      • Exhibit 65: Chart on Supplements - Year-over-year growth 2023-2028 (%)
      • Exhibit 66: Data Table on Supplements - Year-over-year growth 2023-2028 (%)
    • 8.5 Animal feed - Market size and forecast 2023-2028
      • Exhibit 67: Chart on Animal feed - Market size and forecast 2023-2028 ($ billion)
      • Exhibit 68: Data Table on Animal feed - Market size and forecast 2023-2028 ($ billion)
      • Exhibit 69: Chart on Animal feed - Year-over-year growth 2023-2028 (%)
      • Exhibit 70: Data Table on Animal feed - Year-over-year growth 2023-2028 (%)
    • 8.6 Market opportunity by Product
      • Exhibit 71: Market opportunity by Product ($ billion)
      • Exhibit 72: Data Table on Market opportunity by Product ($ billion)

    9 Customer Landscape

    • 9.1 Customer landscape overview
      • Exhibit 73: Analysis of price sensitivity, lifecycle, customer purchase basket, adoption rates, and purchase criteria

    10 Drivers, Challenges, and Trends

    • 10.1 Market drivers
      • 10.2 Market challenges
        • 10.3 Impact of drivers and challenges
          • Exhibit 74: Impact of drivers and challenges in 2023 and 2028
        • 10.4 Market trends

          11 Vendor Landscape

          • 11.1 Overview
            • 11.2 Vendor landscape
              • Exhibit 75: Overview on Criticality of inputs and Factors of differentiation
            • 11.3 Landscape disruption
              • Exhibit 76: Overview on factors of disruption
            • 11.4 Industry risks
              • Exhibit 77: Impact of key risks on business

            12 Vendor Analysis

            • 12.1 Vendors covered
              • Exhibit 78: Vendors covered
            • 12.2 Market positioning of vendors
              • Exhibit 79: Matrix on vendor position and classification
            • 12.3 BioGaia AB
              • Exhibit 80: BioGaia AB - Overview
              • Exhibit 81: BioGaia AB - Business segments
              • Exhibit 82: BioGaia AB - Key news
              • Exhibit 83: BioGaia AB - Key offerings
              • Exhibit 84: BioGaia AB - Segment focus
            • 12.4 Chr Hansen Holding AS
              • Exhibit 85: Chr Hansen Holding AS - Overview
              • Exhibit 86: Chr Hansen Holding AS - Business segments
              • Exhibit 87: Chr Hansen Holding AS - Key news
              • Exhibit 88: Chr Hansen Holding AS - Key offerings
              • Exhibit 89: Chr Hansen Holding AS - Segment focus
            • 12.5 Danone
              • Exhibit 90: Danone - Overview
              • Exhibit 91: Danone - Business segments
              • Exhibit 92: Danone - Key news
              • Exhibit 93: Danone - Key offerings
              • Exhibit 94: Danone - Segment focus
            • 12.6 DuPont de Nemours Inc.
              • Exhibit 95: DuPont de Nemours Inc. - Overview
              • Exhibit 96: DuPont de Nemours Inc. - Business segments
              • Exhibit 97: DuPont de Nemours Inc. - Key news
              • Exhibit 98: DuPont de Nemours Inc. - Key offerings
              • Exhibit 99: DuPont de Nemours Inc. - Segment focus
            • 12.7 Koninklijke DSM NV
              • Exhibit 100: Koninklijke DSM NV - Overview
              • Exhibit 101: Koninklijke DSM NV - Business segments
              • Exhibit 102: Koninklijke DSM NV - Key news
              • Exhibit 103: Koninklijke DSM NV - Key offerings
              • Exhibit 104: Koninklijke DSM NV - Segment focus
            • 12.8 Lallemand Inc.
              • Exhibit 105: Lallemand Inc. - Overview
              • Exhibit 106: Lallemand Inc. - Product / Service
              • Exhibit 107: Lallemand Inc. - Key offerings
            • 12.9 Lifeway Foods Inc.
              • Exhibit 108: Lifeway Foods Inc. - Overview
              • Exhibit 109: Lifeway Foods Inc. - Product / Service
              • Exhibit 110: Lifeway Foods Inc. - Key offerings
            • 12.10 Nestle SA
              • Exhibit 111: Nestle SA - Overview
              • Exhibit 112: Nestle SA - Business segments
              • Exhibit 113: Nestle SA - Key news
              • Exhibit 114: Nestle SA - Key offerings
              • Exhibit 115: Nestle SA - Segment focus
            • 12.11 NOW Health Group Inc.
              • Exhibit 116: NOW Health Group Inc. - Overview
              • Exhibit 117: NOW Health Group Inc. - Product / Service
              • Exhibit 118: NOW Health Group Inc. - Key offerings
            • 12.12 Otsuka Holdings Co. Ltd.
              • Exhibit 119: Otsuka Holdings Co. Ltd. - Overview
              • Exhibit 120: Otsuka Holdings Co. Ltd. - Business segments
              • Exhibit 121: Otsuka Holdings Co. Ltd. - Key offerings
              • Exhibit 122: Otsuka Holdings Co. Ltd. - Segment focus
            • 12.13 PepsiCo Inc.
              • Exhibit 123: PepsiCo Inc. - Overview
              • Exhibit 124: PepsiCo Inc. - Business segments
              • Exhibit 125: PepsiCo Inc. - Key news
              • Exhibit 126: PepsiCo Inc. - Key offerings
              • Exhibit 127: PepsiCo Inc. - Segment focus
            • 12.14 Reckitt Benckiser Group Plc
              • Exhibit 128: Reckitt Benckiser Group Plc - Overview
              • Exhibit 129: Reckitt Benckiser Group Plc - Business segments
              • Exhibit 130: Reckitt Benckiser Group Plc - Key offerings
              • Exhibit 131: Reckitt Benckiser Group Plc - Segment focus
            • 12.15 Symrise AG
              • Exhibit 132: Symrise AG - Overview
              • Exhibit 133: Symrise AG - Business segments
              • Exhibit 134: Symrise AG - Key offerings
              • Exhibit 135: Symrise AG - Segment focus
            • 12.16 The Procter and Gamble Co.
              • Exhibit 136: The Procter and Gamble Co. - Overview
              • Exhibit 137: The Procter and Gamble Co. - Business segments
              • Exhibit 138: The Procter and Gamble Co. - Key news
              • Exhibit 139: The Procter and Gamble Co. - Key offerings
              • Exhibit 140: The Procter and Gamble Co. - Segment focus
            • 12.17 Yakult Honsha Co. Ltd.
              • Exhibit 141: Yakult Honsha Co. Ltd. - Overview
              • Exhibit 142: Yakult Honsha Co. Ltd. - Business segments
              • Exhibit 143: Yakult Honsha Co. Ltd. - Key offerings
              • Exhibit 144: Yakult Honsha Co. Ltd. - Segment focus

            13 Appendix

            • 13.1 Scope of the report
              • 13.2 Inclusions and exclusions checklist
                • Exhibit 145: Inclusions checklist
                • Exhibit 146: Exclusions checklist
              • 13.3 Currency conversion rates for US$
                • Exhibit 147: Currency conversion rates for US$
              • 13.4 Research methodology
                • Exhibit 148: Research methodology
                • Exhibit 149: Validation techniques employed for market sizing
                • Exhibit 150: Information sources
              • 13.5 List of abbreviations
                • Exhibit 151: List of abbreviations

              Research Methodology

              Technavio presents a detailed picture of the market by way of study, synthesis, and summation of data from multiple sources. The analysts have presented the various facets of the market with a particular focus on identifying the key industry influencers. The data thus presented is comprehensive, reliable, and the result of extensive research, both primary and secondary.

              INFORMATION SOURCES

              Primary sources

              • Manufacturers and suppliers
              • Channel partners
              • Industry experts
              • Strategic decision makers

              Secondary sources

              • Industry journals and periodicals
              • Government data
              • Financial reports of key industry players
              • Historical data
              • Press releases

              DATA ANALYSIS

              Data Synthesis

              • Collation of data
              • Estimation of key figures
              • Analysis of derived insights

              Data Validation

              • Triangulation with data models
              • Reference against proprietary databases
              • Corroboration with industry experts

              REPORT WRITING

              Qualitative

              • Market drivers
              • Market challenges
              • Market trends
              • Five forces analysis

              Quantitative

              • Market size and forecast
              • Market segmentation
              • Geographical insights
              • Competitive landscape

              Interested in this report?

              Get your sample now to see our research methodology and insights!

              Download Now

              Frequently Asked Questions

              Probioticsin US market growth will increase by $ 4.98 bn during 2024-2028.

              The Probioticsin US market is expected to grow at a CAGR of 8.16% during 2024-2028.

              Probioticsin US market is segmented by Distribution Channel( Offline, Online) End-user( Human probiotics, Animal probiotics) Product( Probiotic functional food and beverage, Supplements, Animal feed)

              BioGaia AB, Chr Hansen Holding AS, CUSTOM PROBIOTICS Inc., Danone, DuPont de Nemours Inc., General Mills Inc., InnovixLabs, Jarrow Formulas Inc., Koninklijke DSM NV, Lallemand Inc., Lifeway Foods Inc., Nestle SA, NOW Health Group Inc., Otsuka Holdings Co. Ltd., PepsiCo Inc., Reckitt Benckiser Group Plc, SFI Health, Swanson Health Products Inc., Symrise AG, The Procter and Gamble Co., Thorne HealthTech Inc., Twinlab Consolidated Holdings Inc., Yakult Honsha Co. Ltd. are a few of the key vendors in the Probioticsin US market.

              North America will register the highest growth rate of 100% among the other regions. Therefore, the Probioticsin US market in North America is expected to garner significant business opportunities for the vendors during the forecast period.

              US, North America

              • Health benefits of probioticsProbiotics prevent the growth of harmful bacteria inside the digestive tract is the driving factor this market.
              • leading to an improvement in nutrition absorption and bowel movements. Probiotic supplements increase the Lactobacilli count in women and prevent diseases such as bacterial vaginosis is the driving factor this market.
              • yeast infection is the driving factor this market.
              • and urinary tract infection. These products are also beneficial for animal health. The consumption of probiotic products improves the interstitial microbial balance by lowering the pH levels. Clinical studies have also shown that the intake of probiotics prevents the growth of harmful microbes is the driving factor this market.
              • such as Candida is the driving factor this market.
              • Escherichia coli is the driving factor this market.
              • Helicobacter pylori is the driving factor this market.
              • and Salmonella. They also help reduce dental caries is the driving factor this market.
              • prevent oral candida infections is the driving factor this market.
              • and manage periodontitis. Probiotics are usually used as dietary supplements in foods and beverages to provide health benefits to the human digestive system and skin nourishment. An increase in consumer interest in consuming healthy foods to improve health and immunity is driving the growth of the probiotics market in US. The growth in the food and beverage industry in the US due to increasing consumer spending and favorable government initiatives is expected to serve as one of the major driving factors in the growth of probiotics. Dairy-free probiotic products can be a good option for snacking since they are low in carbohydrates and calories. Thus is the driving factor this market.
              • the above reasons will ensure high growth of the probiotics market in US during the forecast period. is the driving factor this market.

              The Probioticsin US market vendors should focus on grabbing business opportunities from the Offline segment as it accounted for the largest market share in the base year.
              RIA - Research AI Assistant
              Ask RIA