US Sulfuric Acid Market Size 2026-2030
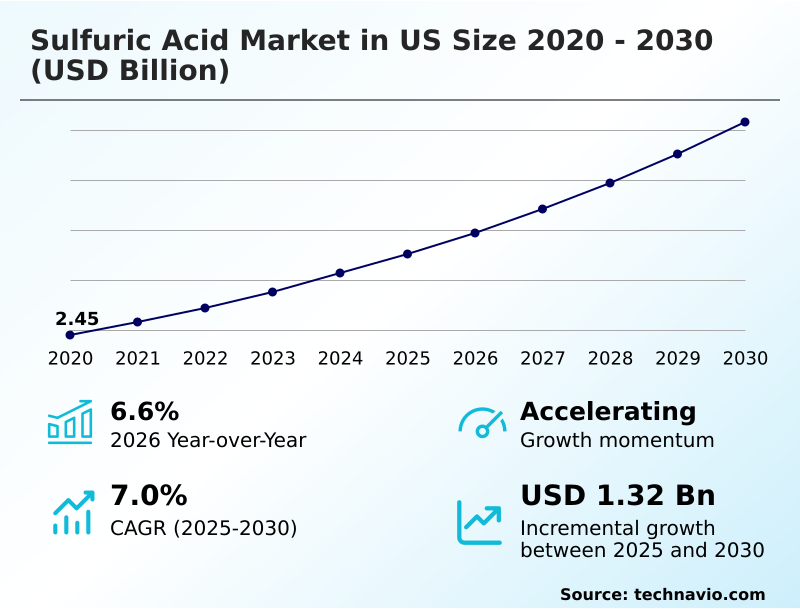
The us sulfuric acid market size is valued to increase by USD 1.32 billion, at a CAGR of 7% from 2025 to 2030. Growing fertilizer demand boosts sulfuric acid consumption will drive the us sulfuric acid market.
Major Market Trends & Insights
- By Raw Material - Elemental sulfur segment was valued at USD 2.08 billion in 2024
- By Application - Fertilizer segment accounted for the largest market revenue share in 2024
Market Size & Forecast
- Market Opportunities: USD 2.13 billion
- Market Future Opportunities: USD 1.32 billion
- CAGR from 2025 to 2030 : 7%
Market Summary
- The sulfuric acid market in US is a foundational component of the nation's industrial economy, driven by robust demand from the agricultural and metal processing sectors. Key market dynamics revolve around the consistent need for phosphate fertilizers to support crop yields and the increasing use of acid in metal leaching for battery components essential to the energy transition.
- A significant trend is the pivot toward high-purity and electronic-grade sulfuric acid, which is critical for the expanding domestic semiconductor industry. However, producers face persistent challenges from feedstock price volatility, which can compress margins and create planning uncertainty. As a business scenario, a petroleum refinery might invest in a spent acid regeneration unit.
- This creates a closed-loop system, reducing reliance on virgin acid procurement and improving operational efficiency by mitigating exposure to fluctuating raw material costs. This strategy not only enhances supply chain resilience but also aligns with growing corporate sustainability mandates, turning an industrial byproduct into a valuable, reusable asset while addressing waste stream neutralization effectively.
What will be the Size of the US Sulfuric Acid Market during the forecast period?
Get Key Insights on Market Forecast (PDF) Get Free Sample
How is the US Sulfuric Acid Market Segmented?
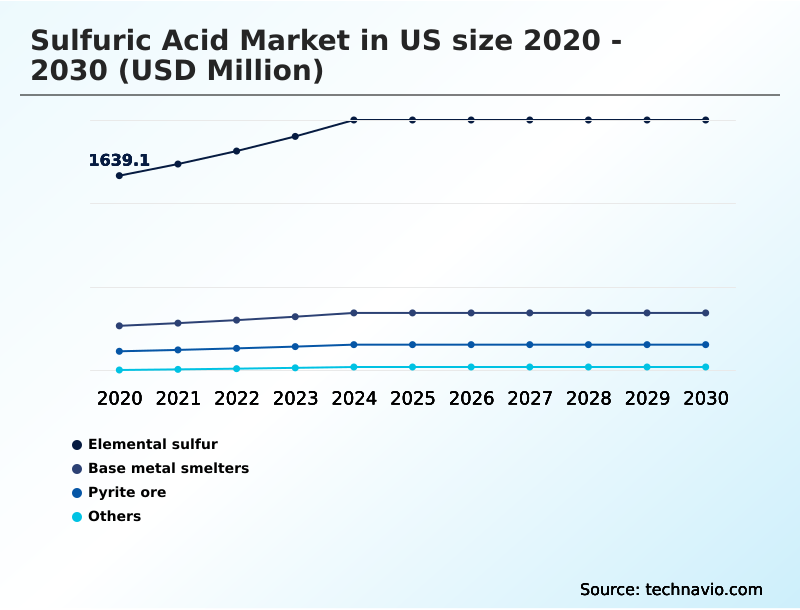
The us sulfuric acid industry research report provides comprehensive data (region-wise segment analysis), with forecasts and estimates in "USD million" for the period 2026-2030, as well as historical data from 2020-2024 for the following segments.
- Raw material
- Elemental sulfur
- Base metal smelters
- Pyrite ore
- Others
- Application
- Fertilizer
- Chemical production
- Metal processing
- Others
- Distribution channel
- Offline
- Online
- Geography
- North America
- US
- North America
By Raw Material Insights
The elemental sulfur segment is estimated to witness significant growth during the forecast period.
The elemental sulfur segment is the primary feedstock source, with its availability tied to petroleum refining and natural gas processing. The cost-efficiency of the contact process in sulfur-burning plants, which require lower capital expenditure, solidifies its dominance.
Logistical advantages in transporting solid or molten sulfur support localized production near major consumption hubs, such as fertilizer manufacturing centers. This segment benefits from high-purity inputs that streamline the production of industrial-grade acid and minimize waste, simplifying environmental compliance.
Strategic acquisitions within the industry focus on integrating these high-capacity sulfur-burning assets to ensure stable supply chains, with recent consolidations aiming to improve supply chain resilience by at least 15% for downstream industrial users of both virgin sulfuric acid and byproduct sulfuric acid.
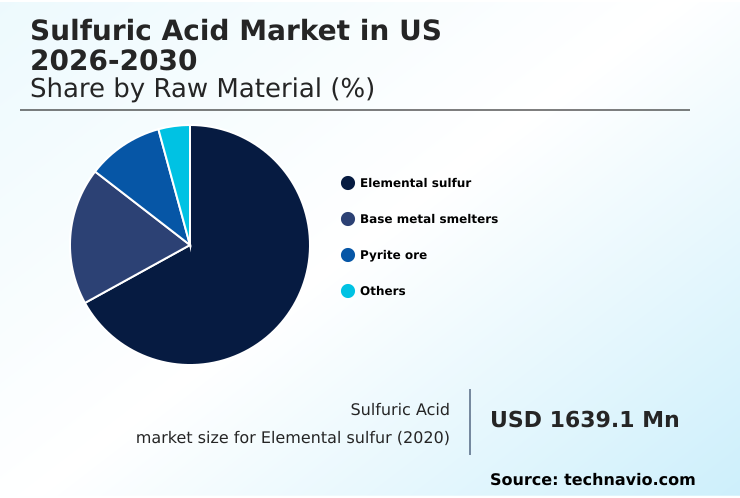
The Elemental sulfur segment was valued at USD 2.08 billion in 2024 and showed a gradual increase during the forecast period.
Market Dynamics
Our researchers analyzed the data with 2025 as the base year, along with the key drivers, trends, and challenges. A holistic analysis of drivers will help companies refine their marketing strategies to gain a competitive advantage.
- The economic viability of the sulfuric acid market in US is shaped by the constant evaluation of elemental sulfur vs smelter acid production methods. While the production of acid from pyrite ore roasting is less common, the core of the industry relies on sulfur-burning and byproduct recovery.
- Sulfuric acid in phosphate fertilizer production remains the largest demand driver, but the need for high-purity acid for semiconductor cleaning is the fastest-growing niche, presenting distinct challenges in electronic-grade acid production. Managing the cost impact of sulfur feedstock volatility is a persistent operational hurdle, compelling companies to enhance sulfuric acid supply chain resilience.
- This includes optimizing the logistics of transporting corrosive chemicals, a significant factor given the hazardous material transport logistics involved. Consequently, there is a growing focus on the market dynamics of virgin vs recycled acid, with spent acid regeneration in oil refineries becoming a cornerstone of circularity.
- Environmental compliance for acid plants, particularly concerning managing SO2 emissions in acid production, is driving investment in technologies that also improve energy efficiency in sulfuric acid manufacturing. In fact, modern plants can achieve up to a 15% reduction in energy use compared to older facilities.
- The role of acid in wastewater pH control and its use in metal pickling and sulfuric acid for battery metal processing, especially byproduct acid from copper smelting, further diversify its application base.
- Demand from chemical synthesis pathways continues to underscore the acid's fundamental role, even as the price elasticity of industrial sulfuric acid is tested by supply chain pressures and the impact of rail transport on acid delivery schedules.
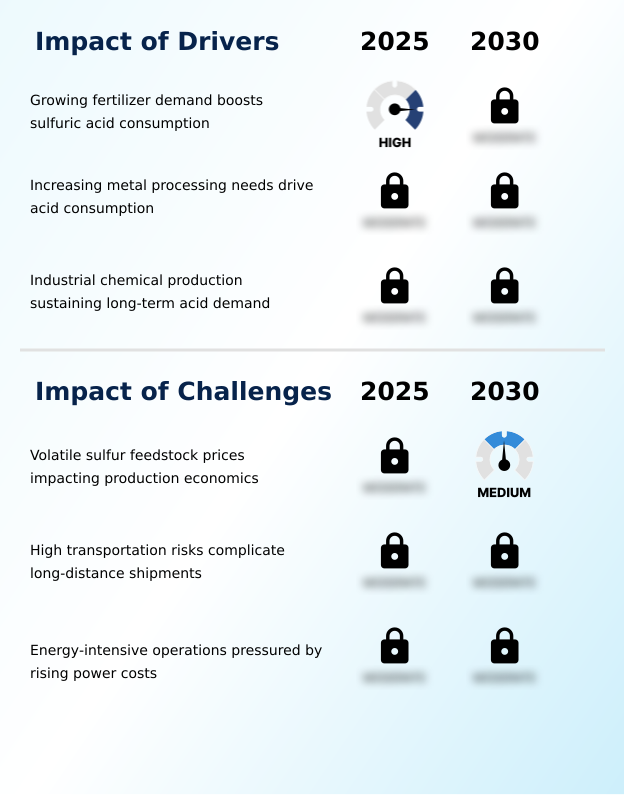
What are the key market drivers leading to the rise in the adoption of US Sulfuric Acid Industry?
- The expanding demand for fertilizers, particularly phosphate-based types, serves as a primary driver for increased sulfuric acid consumption.
- The sulfuric acid market in US is propelled by strong, sustained demand from foundational industries. The fertilizer sector remains the primary driver, with phosphate fertilizers consistently accounting for over 60% of domestic consumption.
- This demand is anchored in the need for agricultural productivity and food security.
- A second major driver is the increasing need for ore processing and metal leaching, particularly for copper and nickel used in electric vehicle batteries; demand in this segment is growing at a rate nearly twice that of the broader market.
- Furthermore, industrial chemical manufacturing provides a stable demand base, where sulfuric acid serves as a critical process catalyst and chemical reagent in numerous chemical synthesis pathways. These core drivers ensure high utilization rates at facilities producing via the contact process.
What are the market trends shaping the US Sulfuric Acid Industry?
- A definitive shift toward cleaner and more efficient production technologies is gaining traction across the industry, propelled by stricter environmental regulations and the pursuit of operational sustainability.
- Key trends are reshaping the sulfuric acid market in US, with a notable push toward cleaner production and circularity. The adoption of advanced emissions control technology, such as the double absorption process, is becoming standard for new acid plants, with some achieving a 40% greater reduction in sulfur dioxide emissions than legacy systems.
- Simultaneously, the growing emphasis on a circular economy is fueling the expansion of acid regeneration services, where facilities can recover over 98% of spent acid from refineries and chemical operations. This reduces the demand for virgin sulfuric acid. Another significant trend is the rising demand for electronic-grade acid to support the domestic semiconductor industry.
- This high-margin segment now accounts for a growing share of capital expenditure, reflecting a strategic shift toward value-added products and feedstock procurement.
What challenges does the US Sulfuric Acid Industry face during its growth?
- The volatility of sulfur feedstock prices presents a significant challenge, directly impacting the production economics and margin stability for manufacturers.
- The primary challenges facing the sulfuric acid market in US stem from operational and logistical cost pressures. Feedstock cost volatility is a major concern, as the price of elemental sulfur can account for up to 70% of total production expenses, creating significant uncertainty in production economics.
- Transportation presents another hurdle, with hazardous material transport logistics being complex and costly, particularly given the reliance on rail networks susceptible to congestion and delays. Finally, energy-intensive production processes expose manufacturers to rising power costs, which can erode profitability.
- A 10% increase in regional electricity prices can directly translate to a nearly 5% rise in operating costs for a typical acid plant, compelling investment in energy-efficient technologies like wet gas scrubbing.
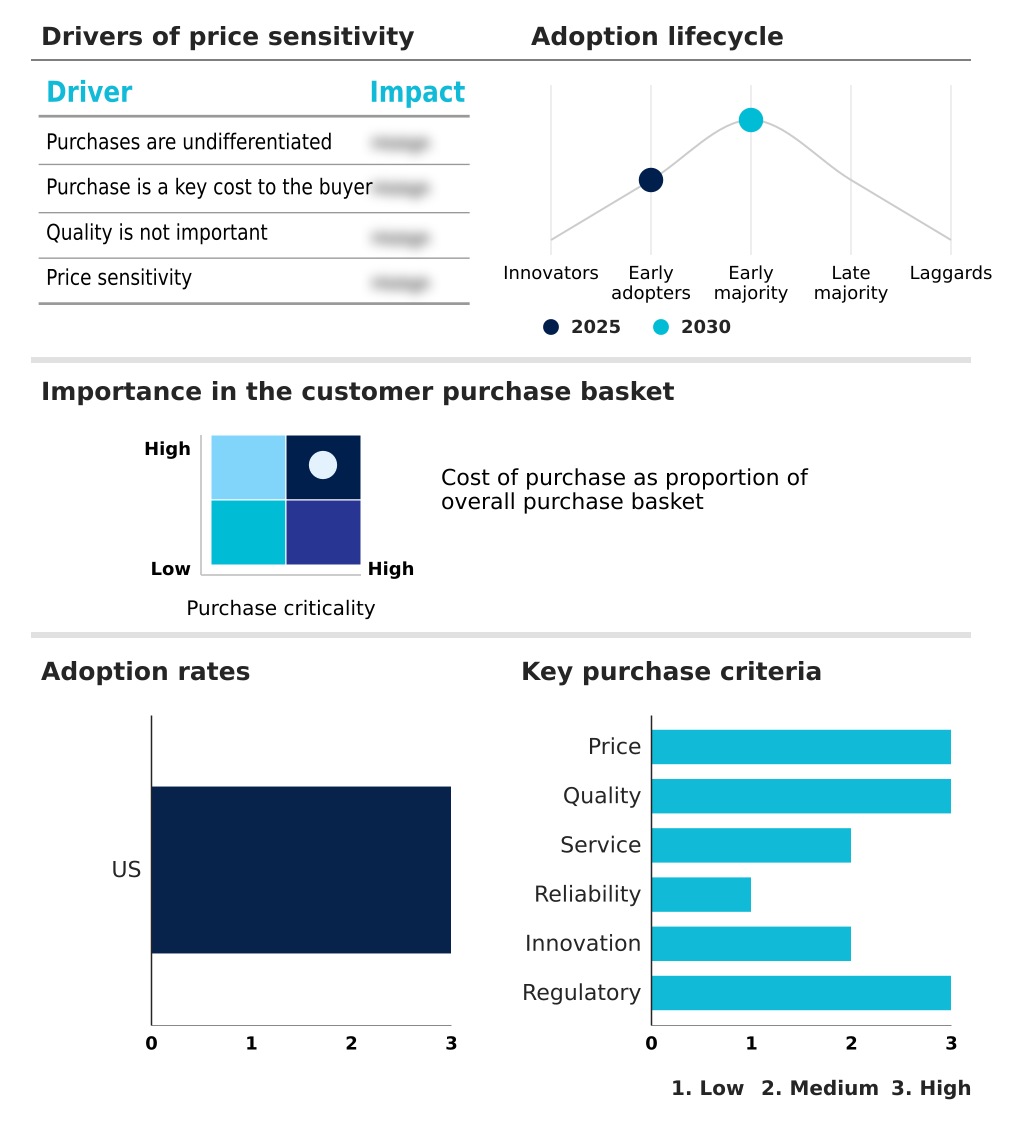
Exclusive Technavio Analysis on Customer Landscape
The us sulfuric acid market forecasting report includes the adoption lifecycle of the market, covering from the innovator’s stage to the laggard’s stage. It focuses on adoption rates in different regions based on penetration. Furthermore, the us sulfuric acid market report also includes key purchase criteria and drivers of price sensitivity to help companies evaluate and develop their market growth analysis strategies.
Customer Landscape of US Sulfuric Acid Industry
Competitive Landscape
Companies are implementing various strategies, such as strategic alliances, us sulfuric acid market forecast, partnerships, mergers and acquisitions, geographical expansion, and product/service launches, to enhance their presence in the industry.
AdvanSix Inc. - Analysis indicates a key offering involves sulfuric acid produced as a co-product of caprolactam manufacturing, serving a variety of industrial applications.
The industry research and growth report includes detailed analyses of the competitive landscape of the market and information about key companies, including:
- AdvanSix Inc.
- Austin Powder
- BASF SE
- Cornerstone Chemical Co.
- Dyno Nobel
- Ecovyst Inc.
- Freeport McMoRan Inc.
- Indorama Ventures Public Co.
- INEOS Group Holdings S.A.
- JR Simplot Co
- Koch IP Holdings LLC.
- Kuehne Chemical Co Inc.
- LSB Industries Inc
- Nutrien Ltd.
- Nyrstar
- Olin Corp.
- Orica Ltd.
- PVS Chemicals Inc.
- Rio Tinto Ltd.
- The Mosaic Co.
Qualitative and quantitative analysis of companies has been conducted to help clients understand the wider business environment as well as the strengths and weaknesses of key industry players. Data is qualitatively analyzed to categorize companies as pure play, category-focused, industry-focused, and diversified; it is quantitatively analyzed to categorize companies as dominant, leading, strong, tentative, and weak.
Recent Development and News in Us sulfuric acid market
- In May 2025, Ecovyst Inc. finalized the acquisition of sulfuric acid production assets from Cornerstone Chemical Company in Waggaman, Louisiana, for approximately thirty-five million dollars to enhance its production capacity.
- In May 2025, BASF SE announced a strategic investment to construct a new plant dedicated to producing semiconductor-grade sulfuric acid, meeting the high-purity demands of advanced chip manufacturing.
- In January 2025, AdvanSix Inc. reported achieving record annual production across its sulfuric acid unit operations, highlighting a strategic focus on maximizing output and operational efficiency.
- In January 2025, the International Council on Mining and Metals (ICMM) and the International Network for Acid Prevention (INAP) launched a new global resource to help mining companies better manage acid rock drainage.
Dive into Technavio’s robust research methodology, blending expert interviews, extensive data synthesis, and validated models for unparalleled US Sulfuric Acid Market insights. See full methodology.
| Market Scope | |
|---|---|
| Page number | 194 |
| Base year | 2025 |
| Historic period | 2020-2024 |
| Forecast period | 2026-2030 |
| Growth momentum & CAGR | Accelerate at a CAGR of 7% |
| Market growth 2026-2030 | USD 1319.4 million |
| Market structure | Fragmented |
| YoY growth 2025-2026(%) | 6.6% |
| Key countries | US |
| Competitive landscape | Leading Companies, Market Positioning of Companies, Competitive Strategies, and Industry Risks |
Research Analyst Overview
- The sulfuric acid market in US is characterized by a fundamental tension between its role as a high-volume industrial commodity and the escalating demand for specialized, high-value grades. The industry's backbone is the contact process, utilized in sulfur-burning plants to produce industrial-grade acid for foundational sectors like phosphate fertilizers and non-ferrous metals processing.
- However, the market's forward momentum is increasingly defined by the production of high-purity sulfuric acid and electronic-grade acid, driven by the domestic expansion of semiconductor manufacturing. This creates a critical boardroom-level decision regarding capital allocation: whether to invest in modernizing existing acid plant infrastructure for efficiency or to channel funds into new facilities capable of meeting parts-per-trillion purity standards.
- This strategic choice is complicated by persistent feedstock price volatility and logistical challenges. The rise of spent acid regeneration and wet gas scrubbing technologies offers a pathway to operational resilience and improved environmental performance, with some advanced facilities improving catalytic conversion efficiency by over 5%.
- Ultimately, success hinges on balancing the economics of producing metallurgical grade acid and byproduct sulfuric acid with capturing premium pricing in high-tech applications.
What are the Key Data Covered in this US Sulfuric Acid Market Research and Growth Report?
-
What is the expected growth of the US Sulfuric Acid Market between 2026 and 2030?
-
USD 1.32 billion, at a CAGR of 7%
-
-
What segmentation does the market report cover?
-
The report is segmented by Raw Material (Elemental sulfur, Base metal smelters, Pyrite ore, and Others), Application (Fertilizer, Chemical production, Metal processing, and Others), Distribution Channel (Offline, and Online) and Geography (North America)
-
-
Which regions are analyzed in the report?
-
North America
-
-
What are the key growth drivers and market challenges?
-
Growing fertilizer demand boosts sulfuric acid consumption, Volatile sulfur feedstock prices impacting production economics
-
-
Who are the major players in the US Sulfuric Acid Market?
-
AdvanSix Inc., Austin Powder, BASF SE, Cornerstone Chemical Co., Dyno Nobel, Ecovyst Inc., Freeport McMoRan Inc., Indorama Ventures Public Co., INEOS Group Holdings S.A., JR Simplot Co, Koch IP Holdings LLC., Kuehne Chemical Co Inc., LSB Industries Inc, Nutrien Ltd., Nyrstar, Olin Corp., Orica Ltd., PVS Chemicals Inc., Rio Tinto Ltd. and The Mosaic Co.
-
Market Research Insights
- The sulfuric acid market in US exhibits complex dynamics, balancing high-volume commodity demand with the growth of specialized, high-purity applications. The market's trajectory is heavily influenced by industrial feedstock needs for sectors like agriculture, where fertilizer production remains a primary consumer. Concurrently, the push for supply chain resilience in advanced industries creates new demand streams.
- For instance, advanced spent acid regeneration systems now achieve over a 98% recovery rate, promoting circular economy principles. Furthermore, the technical requirements for electronic-grade acid have intensified, with specifications for certain impurities being 40% tighter than just a few years ago, underscoring the shift toward value-added products.
- This dual focus pressures producers to optimize production economics while investing in sophisticated purification capabilities for downstream industrial users.
We can help! Our analysts can customize this us sulfuric acid market research report to meet your requirements.
 RIA -
RIA - 
