
Vector Database Market Size 2025-2029
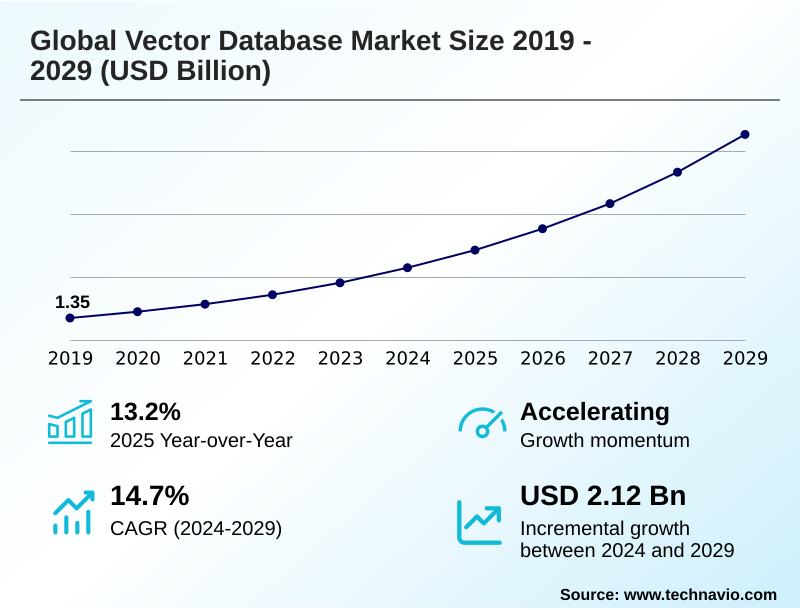
The vector database market size is valued to increase by USD 2.12 billion, at a CAGR of 14.7% from 2024 to 2029. Proliferation of generative AI and large language models will drive the vector database market.
Major Market Trends & Insights
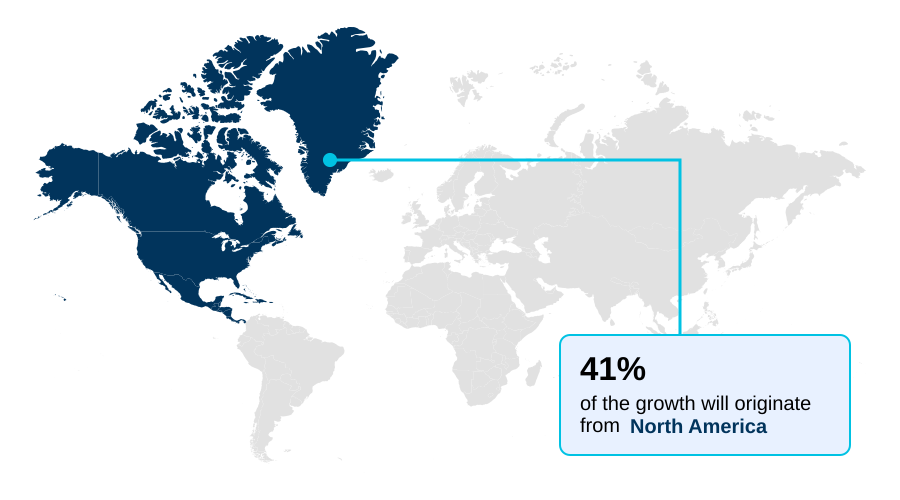
- North America dominated the market and accounted for a 41.2% growth during the forecast period.
- By Deployment - On-premises segment was valued at USD 1.19 billion in 2023
- By Application - NLP segment accounted for the largest market revenue share in 2023
Market Size & Forecast
- Market Opportunities: USD 2.92 billion
- Market Future Opportunities: USD 2.12 billion
- CAGR from 2024 to 2029 : 14.7%
Market Summary
- The vector database market is undergoing unprecedented expansion, driven by the critical need to manage and query unstructured data for AI applications. The surge in generative AI and large language models has made these databases a foundational component of the modern data stack. They enable sophisticated semantic search and retrieval-augmented generation, significantly improving the accuracy and relevance of AI-driven responses.
- For instance, in e-commerce, this technology powers hyper-personalized recommendation engines by understanding the contextual similarity between products and user preferences, moving beyond simple keyword matching. A key trend is the integration of vector search into existing platforms, simplifying data architecture.
- However, the market faces challenges related to implementation complexity and the high computational costs of managing billions of high-dimensional vector embeddings. As organizations seek to unlock insights from their vast data reserves, the demand for scalable, efficient vector databases that can perform low-latency similarity searches is becoming a strategic imperative for competitive advantage.
What will be the Size of the Vector Database Market during the forecast period?
Get Key Insights on Market Forecast (PDF) Get Free Sample
How is the Vector Database Market Segmented?
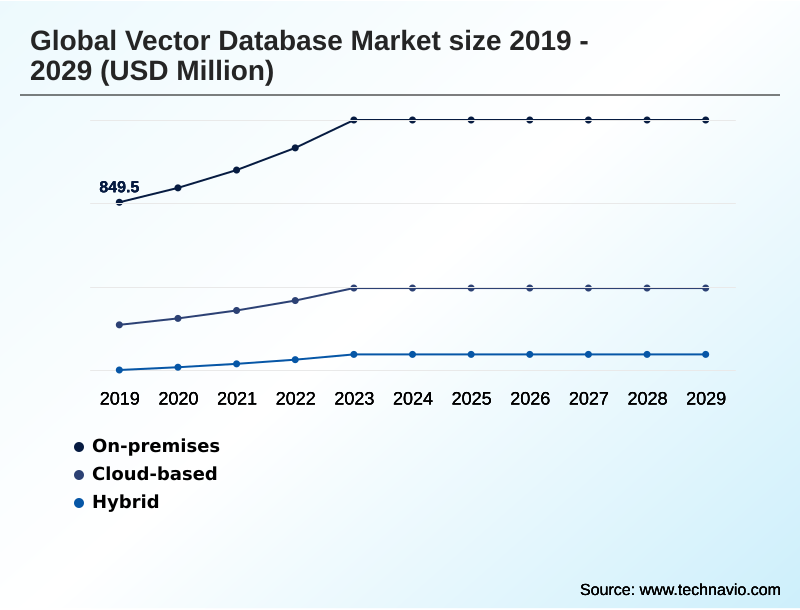
The vector database industry research report provides comprehensive data (region-wise segment analysis), with forecasts and estimates in "USD million" for the period 2025-2029, as well as historical data from 2019-2023 for the following segments.
- Deployment
- On-premises
- Cloud-based
- Hybrid
- Application
- NLP
- Image and video recognition
- Recommendation systems
- Fraud detection
- End-user
- IT and telecommunications
- BFSI
- Retail and e-commerce
- Healthcare
- Others
- Geography
- North America
- US
- Canada
- Mexico
- APAC
- China
- Japan
- India
- Europe
- Germany
- UK
- France
- Middle East and Africa
- UAE
- Saudi Arabia
- Israel
- South America
- Brazil
- Argentina
- Colombia
- Rest of World (ROW)
- North America
By Deployment Insights
The on-premises segment is estimated to witness significant growth during the forecast period.
The on-premises model remains critical for entities requiring stringent data security and governance.
This deployment is essential for sectors like finance and healthcare, which mandate that sensitive data and proprietary embeddings stay within physical control, aligning with complex data sovereignty solutions. These systems offer maximum control, minimizing third-party data access risks.
An ai-native data platform deployed on-premise leverages on-disk indexing algorithms and hybrid memory-disk solutions for the efficient unstructured data indexing of large, proprietary datasets, facilitating high-throughput querying for internal tools like an intelligent code search or document search platform.
This architecture supports advanced data filtering and NoSQL vector integration while ensuring multi-tenant vector isolation and enabling regulatory compliance search, reducing network-related delays by over 30% for latency-sensitive applications.
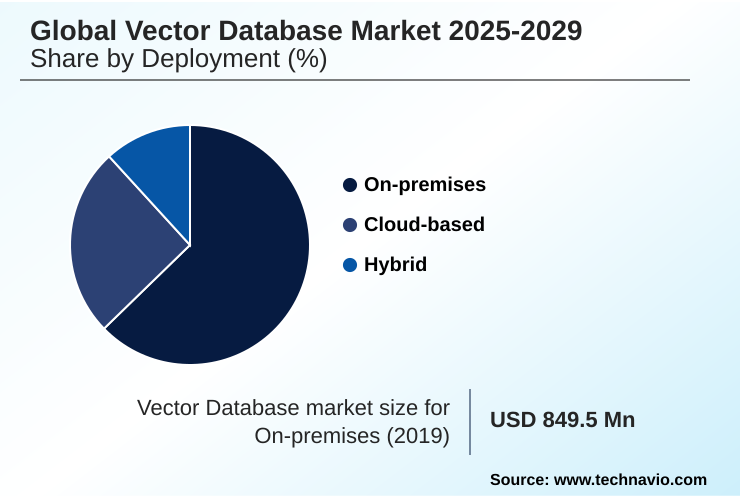
The On-premises segment was valued at USD 1.19 billion in 2023 and showed a gradual increase during the forecast period.
Regional Analysis
North America is estimated to contribute 41.2% to the growth of the global market during the forecast period.Technavio’s analysts have elaborately explained the regional trends and drivers that shape the market during the forecast period.
See How Vector Database Market Demand is Rising in North America Get Free Sample
The market's geographic landscape is led by North America, which accounts for 41.2% of incremental growth, driven by its concentration of AI research and hyperscale cloud providers.
This region sees high adoption of enterprise-grade vector search and open-source embedding database technologies. The APAC market is the fastest-growing, with a projected growth of 15.0%, fueled by massive digitalization and investment in AI.
In this region, a multimodal vector store is critical for e-commerce and mobile applications, powering both semantic information retrieval and content-based image retrieval.
European adoption is shaped by data privacy regulations, favoring solutions that support hybrid search queries and robust governance.
Across all regions, the technology enables applications from financial fraud detection patterns to intelligent virtual assistants, transforming how organizations execute semantic similarity search on document analysis vectors and build multi-modal search applications.
Market Dynamics
Our researchers analyzed the data with 2024 as the base year, along with the key drivers, trends, and challenges. A holistic analysis of drivers will help companies refine their marketing strategies to gain a competitive advantage.
- Achieving competitive advantage in the vector database market requires a deep focus on several critical factors. Businesses are actively comparing in-memory vs on-disk vector search to balance cost and performance.
- The adoption of cost-effective on-disk indexing techniques is crucial for scaling vector databases to billions of embeddings, especially for use cases in vector database for genomic data analysis and vector database for personalized e-commerce. Success hinges on meticulously benchmarking vector database performance metrics, as optimizing query latency in vector search is a key differentiator.
- For organizations building RAG applications with vector databases, the goal is reducing hallucinations with retrieval-augmented generation. This involves the careful selecting embedding models for unstructured data and managing unstructured data in AI workflows. A thorough serverless vector database cost-benefit analysis is now standard practice before integrating vector search into existing platforms.
- As deployments mature, securing sensitive data in vector databases and using vectors for real-time fraud detection are paramount. This is especially true for applications in vector database for financial fraud detection, vector database for predictive maintenance, vector database for supply chain optimization, and multi-modal search for media archives.
- Platforms that perfect the hybrid search with keyword and semantic queries are seeing adoption rates nearly double those of single-function systems.
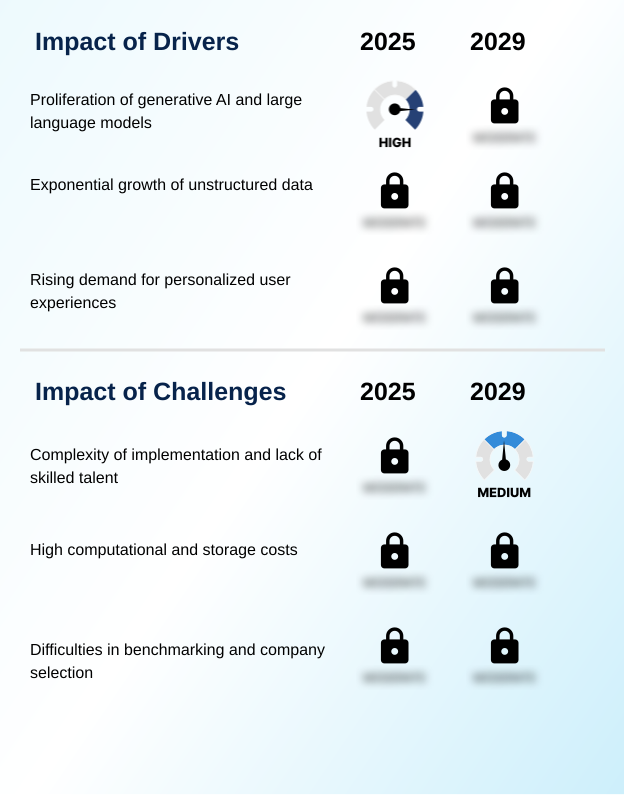
What are the key market drivers leading to the rise in the adoption of Vector Database Industry?
- The proliferation of generative AI and large language models (LLMs) is the primary driver for the market, as these models rely on vector databases for semantic understanding and memory.
- The market is fundamentally driven by the proliferation of generative AI infrastructure and the need to process unstructured data, which now constitutes over 80% of new enterprise data.
- Technologies like retrieval-augmented generation and sophisticated text embedding models rely on an ai-native vector database for semantic context retrieval.
- These systems store high dimensional vector embeddings to serve as a long-term large language model memory, which improves model accuracy by 25%. The demand for a real-time recommendation engine, visual product discovery, and personalized content curation is pushing adoption.
- Applications powered by video recognition embedding and unstructured data analysis are becoming mainstream, highlighting the database's role as the engine for conversational AI memory and next-generation AI platforms.
What are the market trends shaping the Vector Database Industry?
- A defining market trend is the strategic integration of vector search capabilities into established, multi-purpose data platforms. This is driven by an enterprise preference to leverage existing infrastructure for new AI-powered applications.
- A key market trend is the shift toward a serverless vector architecture and fully managed vector database service offerings, which are becoming a core modern data stack component. These serverless vector database solutions abstract away infrastructure complexity, accelerating enterprise AI application development for a new ai-powered discovery application.
- This model, which utilizes techniques like vector quantization techniques and solid-state drive optimization over traditional in-memory indexing, reduces infrastructure costs by up to 50%. By decoupling compute and storage, it enables scalable vector indexing of AI model training data on demand.
- This approach is ideal for integrating vector capabilities into a columnar database or time-series database, accelerating deployment cycles by 4x and lowering barriers to innovation.
What challenges does the Vector Database Industry face during its growth?
- The inherent complexity of implementation and management, coupled with a significant lack of skilled talent, presents a primary challenge affecting widespread industry adoption and growth.
- A primary challenge is the complexity of implementation, which often requires a 15% increase in specialized data science budgets. Choosing the right embedding model selection and tuning an approximate nearest neighbor algorithm like hierarchical navigable small world are non-trivial tasks.
- Misconfiguration can reduce search recall by 10%, impacting the low-latency query performance essential for applications like AIOps anomaly detection and predictive maintenance analysis. Effective data embedding management and real-time vector processing demand deep expertise.
- Achieving the right balance between cost and query latency reduction for low-latency similarity search remains a hurdle, hindering the widespread use of contextual search functionality and conversational user interface support for tasks such as semantic text classification.
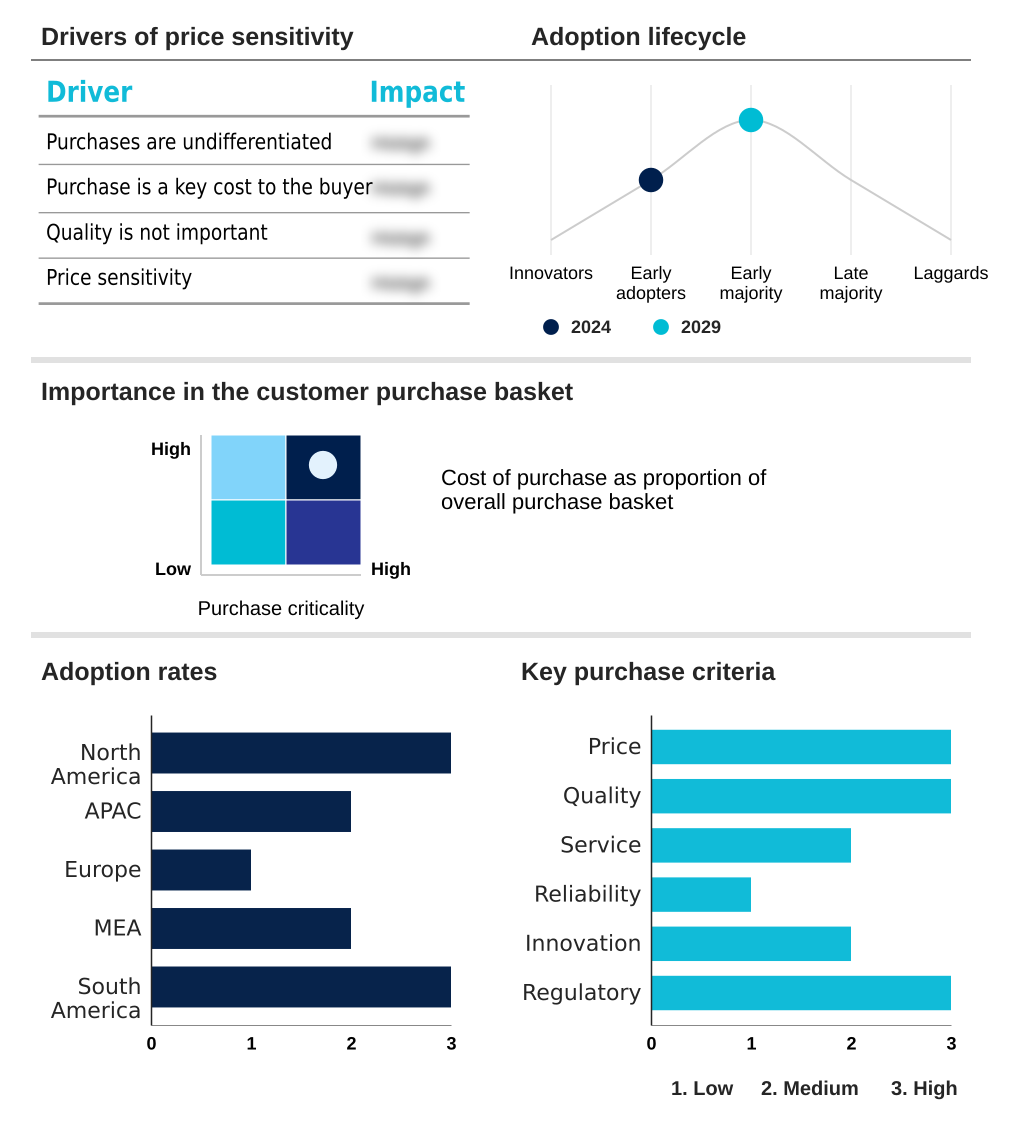
Exclusive Technavio Analysis on Customer Landscape
The vector database market forecasting report includes the adoption lifecycle of the market, covering from the innovator’s stage to the laggard’s stage. It focuses on adoption rates in different regions based on penetration. Furthermore, the vector database market report also includes key purchase criteria and drivers of price sensitivity to help companies evaluate and develop their market growth analysis strategies.
Customer Landscape of Vector Database Industry
Competitive Landscape
Companies are implementing various strategies, such as strategic alliances, vector database market forecast, partnerships, mergers and acquisitions, geographical expansion, and product/service launches, to enhance their presence in the industry.
Activeloop - Key offerings center on fully managed, serverless vector database platforms designed to support scalable, low-latency AI applications such as semantic search and retrieval-augmented generation.
The industry research and growth report includes detailed analyses of the competitive landscape of the market and information about key companies, including:
- Activeloop
- Amazon Web Services Inc.
- Chroma
- ClickHouse Inc.
- Crunchy Data Solutions Inc.
- DataStax Inc.
- Elasticsearch B.V.
- Google LLC
- KX Systems Inc.
- LanceDB Inc.
- Meta Platforms Inc.
- MongoDB Inc.
- Pinecone Systems Inc.
- Qdrant
- Redis Ltd.
- SingleStore Inc.
- Vespa.ai AS
- Weaviate B.V.
- Zilliz
Qualitative and quantitative analysis of companies has been conducted to help clients understand the wider business environment as well as the strengths and weaknesses of key industry players. Data is qualitatively analyzed to categorize companies as pure play, category-focused, industry-focused, and diversified; it is quantitatively analyzed to categorize companies as dominant, leading, strong, tentative, and weak.
Recent Development and News in Vector database market
- In October, 2024, G42, an AI and cloud computing company based in the UAE, was a key contributor to the launch of Jais, a high-quality Arabic LLM, signaling a growing need for vector database infrastructure to support region-specific models.
- In September, 2024, Amazon Web Services Inc. announced a major investment plan to expand its cloud computing infrastructure in Brazil, providing the low-latency access required to effectively utilize advanced AI services, including managed vector databases.
- In May, 2025, Pinecone Systems Inc. announced the general availability of Pinecone serverless, a new architecture for its vector database explicitly designed to reduce costs by separating compute and storage resources for common AI workloads.
- In April, 2025, LanceDB Inc., a startup developing a serverless and storage-first vector database, announced a successful seed funding round aimed at reducing the infrastructure costs associated with vector search.
Dive into Technavio’s robust research methodology, blending expert interviews, extensive data synthesis, and validated models for unparalleled Vector Database Market insights. See full methodology.
| Market Scope | |
|---|---|
| Page number | 302 |
| Base year | 2024 |
| Historic period | 2019-2023 |
| Forecast period | 2025-2029 |
| Growth momentum & CAGR | Accelerate at a CAGR of 14.7% |
| Market growth 2025-2029 | USD 2123.9 million |
| Market structure | Fragmented |
| YoY growth 2024-2025(%) | 13.2% |
| Key countries | US, Canada, Mexico, China, Japan, India, South Korea, Australia, Indonesia, Germany, UK, France, The Netherlands, Italy, Spain, UAE, Saudi Arabia, Israel, South Africa, Turkey, Brazil, Argentina and Colombia |
| Competitive landscape | Leading Companies, Market Positioning of Companies, Competitive Strategies, and Industry Risks |
Research Analyst Overview
- The vector database market is defined by a rapid innovation cycle centered on the management of high dimensional vector embeddings. The core technology relies on ANN indexing algorithm frameworks like hierarchical navigable small world to enable low-latency similarity search and semantic context retrieval.
- A major focus is on optimizing architectures, from traditional in-memory indexing to more scalable serverless vector architecture and on-disk indexing algorithms with solid-state drive optimization. Leading solutions now offer hybrid memory-disk solutions and advanced data filtering to balance cost and performance. This is critical for high-throughput querying and query latency reduction.
- Key features like vector quantization techniques are becoming standard for managing data embedding management at scale. This infrastructure is the backbone for a new class of applications, from conversational AI memory and retrieval-augmented generation to video recognition embedding and semantic similarity search in document analysis vectors.
- The market's evolution from niche tools to integrated NoSQL vector integration within columnar database and time-series database platforms, often featuring multi-tenant vector isolation, has allowed enterprises to achieve a 30% reduction in data processing time for AI-native vector database workloads.
What are the Key Data Covered in this Vector Database Market Research and Growth Report?
-
What is the expected growth of the Vector Database Market between 2025 and 2029?
-
USD 2.12 billion, at a CAGR of 14.7%
-
-
What segmentation does the market report cover?
-
The report is segmented by Deployment (On-premises, Cloud-based, and Hybrid), Application (NLP, Image and video recognition, Recommendation systems, and Fraud detection), End-user (IT and telecommunications, BFSI, Retail and e-commerce, Healthcare, and Others) and Geography (North America, APAC, Europe, Middle East and Africa, South America)
-
-
Which regions are analyzed in the report?
-
North America, APAC, Europe, Middle East and Africa and South America
-
-
What are the key growth drivers and market challenges?
-
Proliferation of generative AI and large language models, Complexity of implementation and lack of skilled talent
-
-
Who are the major players in the Vector Database Market?
-
Activeloop, Amazon Web Services Inc., Chroma, ClickHouse Inc., Crunchy Data Solutions Inc., DataStax Inc., Elasticsearch B.V., Google LLC, KX Systems Inc., LanceDB Inc., Meta Platforms Inc., MongoDB Inc., Pinecone Systems Inc., Qdrant, Redis Ltd., SingleStore Inc., Vespa.ai AS, Weaviate B.V. and Zilliz
-
Market Research Insights
- The market's momentum is driven by the urgent need for a robust generative AI infrastructure and efficient unstructured data analysis. Platforms offering a managed vector database service or a complete serverless vector database are gaining traction, with some achieving a 60% reduction in operational overhead.
- These technologies are crucial for enterprise AI application development, underpinning functionalities from an ai-powered discovery application to a real-time recommendation engine that can improve user engagement by over 25%. As a modern data stack component, they enable ai-powered semantic search, visual product discovery, and intelligent virtual assistants.
- The ability to perform low-latency query performance for applications like AIOps anomaly detection and financial fraud detection patterns is critical. This push toward personalized content curation and scalable vector indexing makes these systems indispensable for building the next generation of AI-native data platforms.
We can help! Our analysts can customize this vector database market research report to meet your requirements.
 RIA -
RIA - 
