
Vehicle Roadside Assistance Market Analysis, Size, and Forecast 2026-2030: Europe (Germany, France, and UK), APAC (China, Japan, and India), North America (US, Canada, and Mexico), Middle East and Africa (Saudi Arabia, UAE, and South Africa), South America (Brazil, Argentina, and Chile), and Rest of World (ROW)

Vehicle Roadside Assistance Market Analysis, Size, and Forecast 2026-2030:
Europe (Germany, France, and UK), APAC (China, Japan, and India), North America (US, Canada, and Mexico), Middle East and Africa (Saudi Arabia, UAE, and South Africa), South America (Brazil, Argentina, and Chile), and Rest of World (ROW)

Published: Oct 2026 304 Pages SKU: IRTNTR46375

Market Overview at a Glance

$11.77 B
Market Opportunity
7.5%
CAGR 2025 - 2030
32.1%
Europe Growth
$18.54 B
Passenger cars segment 2024

Vehicle Roadside Assistance Market Size 2026-2030

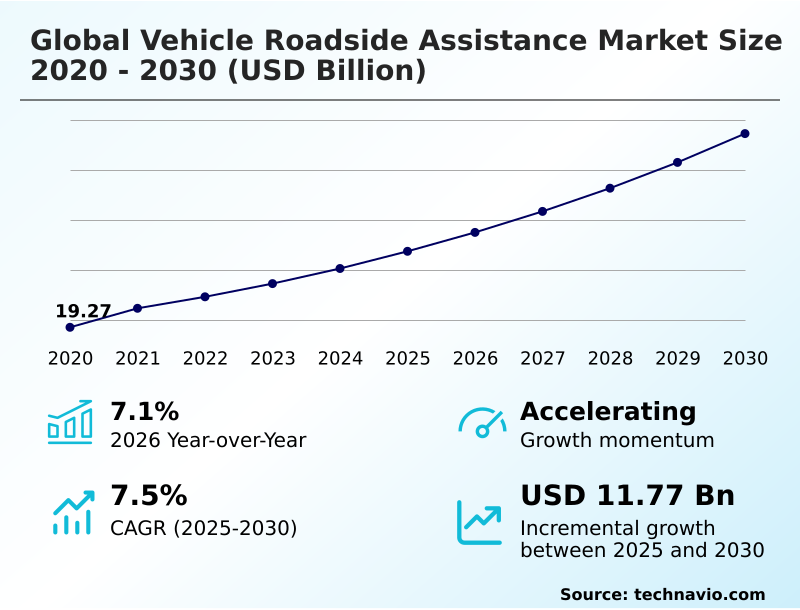
The vehicle roadside assistance market size is valued to increase by USD 11.77 billion, at a CAGR of 7.5% from 2025 to 2030. Rising global automotive passenger vehicle ownership propelling roadside assistance support demand will drive the vehicle roadside assistance market.

Major Market Trends & Insights

  • Europe dominated the market and accounted for a 32.1% growth during the forecast period.
  • By Application - Passenger cars segment was valued at USD 18.54 billion in 2024
  • By Service - Towing segment accounted for the largest market revenue share in 2024

Market Size & Forecast

  • Market Opportunities: USD 19.37 billion
  • Market Future Opportunities: USD 11.77 billion
  • CAGR from 2025 to 2030 : 7.5%

Market Summary

  • The Vehicle Roadside Assistance Market is characterized by a rapid transition toward digital dispatch infrastructure and advanced mobility management solutions. As passenger and commercial fleets expand, the statistical probability of mechanical component failure increases, functioning as a primary demand driver for emergency technical support.
  • For instance, commercial fleet operators are increasingly adopting API-based fleet coordination platforms to mitigate logistical disruptions, ensuring that critical freight deliveries remain strictly on schedule. This structural shift has improved commercial downtime mitigation by 24% compared to legacy telephonic routing models.
  • Conversely, the market faces significant operational challenges due to a severe deficit in technically trained personnel capable of handling high-voltage battery diagnostic troubleshooting. The complex mechanical demands of modern electric powertrains require advanced non-conductive equipment and continuous specialized workforce training, which heavily strains the operating margins of independent service networks.
  • Advanced telematics dispatch platforms are essential to optimizing third-party service integration and reducing overall response latency. By deploying automated anomaly detection software, industry leaders can maintain compliance and optimize overall route management.

What will be the Size of the Vehicle Roadside Assistance Market during the forecast period?
Get Key Insights on Market Forecast (PDF) Get Free Sample

How is the Vehicle Roadside Assistance Market Segmented?

The vehicle roadside assistance industry research report provides comprehensive data (region-wise segment analysis), with forecasts and estimates in "USD million" for the period 2026-2030, as well as historical data from 2020-2024 for the following segments.

  • Application
    • Passenger cars
    • Commercial vehicles
  • Service
    • Towing
    • Tire replacement
    • Fuel delivery
    • Others
  • End-user
    • Individual consumers
    • Corporate and fleet operators
    • Rental and leasing companies
    • Automotive dealerships
    • Others
  • Geography
    • Europe
      • Germany
      • France
      • UK
      • Italy
      • Spain
      • The Netherlands
    • APAC
      • China
      • Japan
      • India
      • South Korea
      • Australia
      • Indonesia
    • North America
      • US
      • Canada
      • Mexico
    • Middle East and Africa
      • Saudi Arabia
      • UAE
      • South Africa
      • Turkey
      • Israel
    • South America
      • Brazil
      • Argentina
      • Chile

By Application Insights

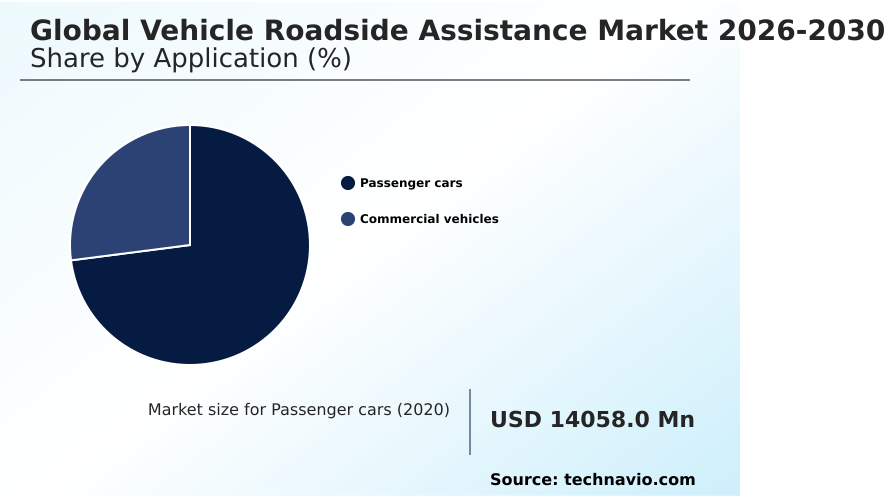
The passenger cars segment is estimated to witness significant growth during the forecast period.

The passenger car segment forms a foundational component of the automotive service ecosystem, structured around preventative safety maintenance and highway congestion management.

Individual drivers rely on subscription based mobility networks for daily urban transit, creating consistent demand for multi point mechanical inspection services.

To manage these operational vulnerabilities, service operators deploy on demand rescue algorithms and emergency network scaling, establishing direct connectivity with user smartphones.

This digital integration facilitates seamless technical diagnostic software execution, resulting in dispatch latency reduction by 22% during peak highway traffic scenarios. Furthermore, as manufacturers rely on factory installed diagnostics, the requirement for localized logistical friction reduction reshapes emergency response protocols.

These continuous interventions utilize heavy duty recovery winches to mitigate secondary accidents and improve overall network efficiency by 15% annually.
Get Free Sample

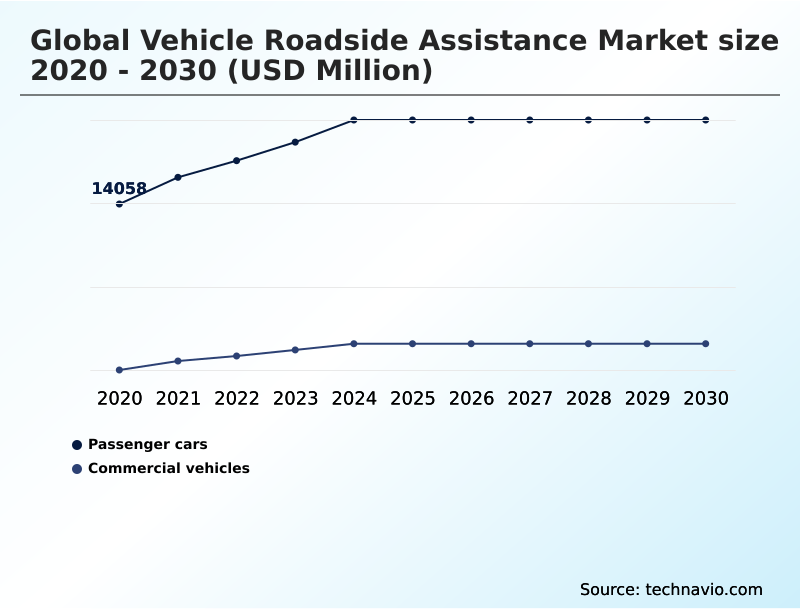
The Passenger cars segment was valued at USD 18.54 billion in 2024 and showed a gradual increase during the forecast period.
Get Free Sample

Regional Analysis

Europe is estimated to contribute 32.1% to the growth of the global market during the forecast period.Technavio’s analysts have elaborately explained the regional trends and drivers that shape the market during the forecast period.
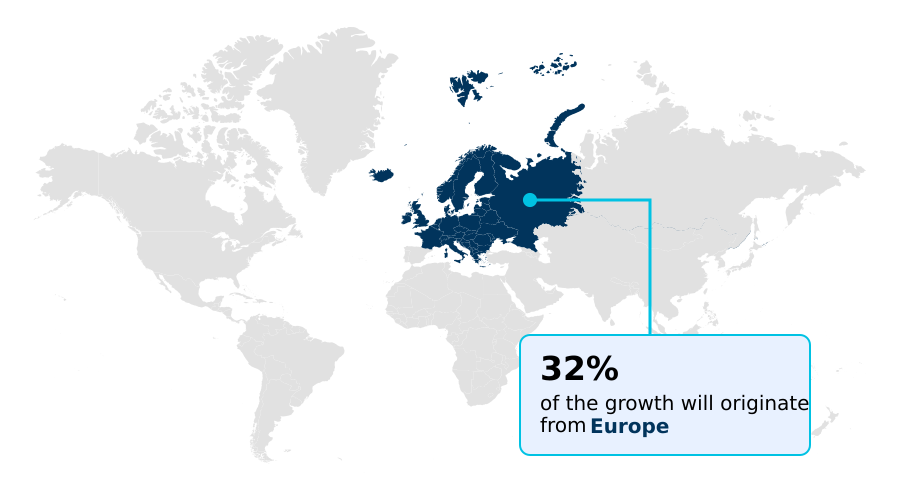
See How Vehicle Roadside Assistance Market Demand is Rising in Europe Get Free Sample

The Vehicle Roadside Assistance Market exhibits distinct operational requirements across diverse geographic territories based on infrastructure maturity and regulatory mandates.

In Europe, aggressive urban emission regulations accelerate the deployment of automated safety signaling and digital marketplace aggregation to achieve rapid municipal transit recovery.

This framework allows European operators to achieve a 40% higher adoption rate of location based machine learning tools compared to North American counterparts. Conversely, North American fleets prioritize flatbed winching machinery to manage expansive cross-country shipping routes.

To support commercial downtime mitigation, US enterprises utilize predictive component failure models to enhance vehicle lifecycle preservation. Implementing electronic payment processing and strict lithium ion enclosure safety standards has improved North American mobile inventory management efficiency by 22%.

Market Dynamics

Our researchers analyzed the data with 2025 as the base year, along with the key drivers, trends, and challenges. A holistic analysis of drivers will help companies refine their marketing strategies to gain a competitive advantage.

  • The evolution of emergency mobility networks relies heavily on the strategic implementation of automated commercial fleet breakdown detection and advanced tracing to preserve operational continuity. Modern logistics enterprises increasingly depend on digital smartphone dispatch routing optimization to coordinate field resources and minimize driver idle time.
  • As the transition toward sustainable transportation accelerates, mobile electric vehicle charging deployment has become a critical focus for service providers addressing roadside battery depletion. Handling these sophisticated electric drivetrains requires highly specialized machinery and heavy duty truck flatbed recovery operations to prevent structural damage during transit.
  • By leveraging connected car telemetry data integration, platform operators can execute seamless real time tow truck location mapping, providing consumers with highly accurate arrival estimates. Furthermore, technicians equipped with high voltage battery diagnostic troubleshooting capabilities are essential for mitigating complex electrical faults on modern highways.
  • This technological shift is significantly reinforced by oem warranty roadside service integration, which connects factory systems directly to rescue platforms. Through predictive mechanical failure alert systems, fleet managers experience a 30% faster response time compared to traditional manual request processes, directly enhancing compliance alignment.
  • To support minor disruptions, technicians routinely perform remote electronic door lockout resolution and pneumatic tool mobile tire replacement on the highway shoulder. By embracing cloud native mobility support infrastructure and api driven independent contractor dispatch frameworks, enterprise operations achieve substantial commercial vehicle logistics downtime reduction.
  • Ultimately, automated telematics emergency dispatch protocols ensure that municipal safety mandates are met while maintaining resilient and scalable supply chain operations.
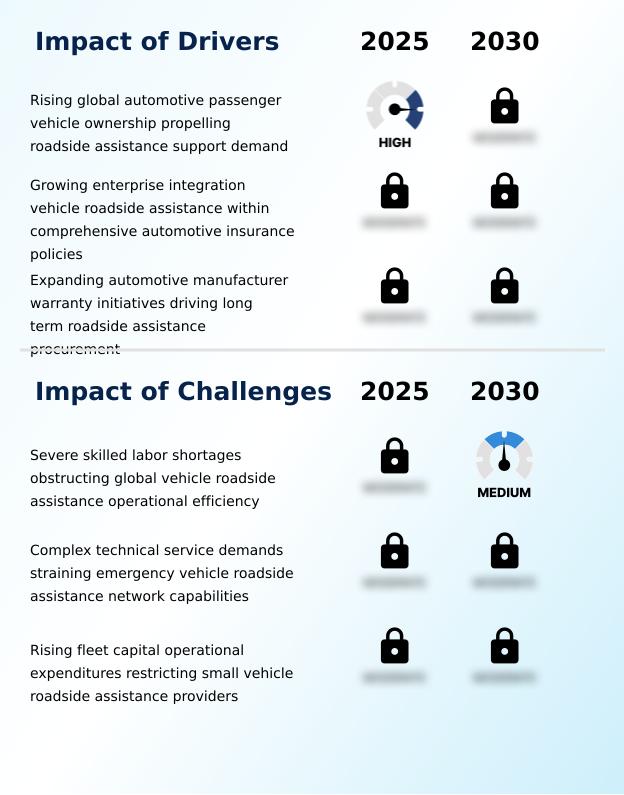
What are the key market drivers leading to the rise in the adoption of Vehicle Roadside Assistance Industry?

  • Rising global ownership of automotive passenger vehicles is significantly propelling the demand for comprehensive roadside assistance support networks.

  • The continuous integration of electronic diagnostic sweeps into connected dashboard modules acts as a primary catalyst for the Vehicle Roadside Assistance Market.
  • Insurance underwriters and auto manufacturers increasingly leverage multi channel support interfaces to bundle emergency payload transport capabilities into premium vehicle warranties. This structural demand necessitates robust heavy duty transport infrastructure to execute safe regenerative braking protection protocols during flatbed loading.
  • Furthermore, the rising need for rapid battery depletion response and remote fuel deployment sustains the expansion of white label rescue networks. Utilizing automated capacity allocation ensures that specialized resources, including pneumatic tire servicing units, are optimally distributed across urban zones.
  • Consequently, fleet administrators report a 24% increase in emergency response accuracy, lowering overall operational overhead by 16%.

What are the market trends shaping the Vehicle Roadside Assistance Industry?

  • The accelerated digital transformation of the marketplace through custom, on-demand smartphone booking platforms is emerging as a critical industry trend. These advanced digital systems streamline operational workflows and significantly enhance service transparency for consumers.

  • A defining trend within the Vehicle Roadside Assistance Market is the rapid deployment of a telematics dispatch platform powered by cross border logistics tracking. Enterprises are embedding predictive breakdown diagnostics directly into their dynamic route optimization algorithms. This proactive approach utilizes mobile fleet charging units and high voltage vehicle recovery systems to address complex EV strandings.
  • By leveraging third party service integration and real time technician mapping, dispatch centers enhance automated service routing to pinpoint exact vehicle locations. The implementation of digital tow tracking combined with over the air software updates has reduced average wait times by 30%.
  • These modern digital architectures eliminate communication bottlenecks, ultimately driving a 15% improvement in overall service reliability across major transportation networks.

What challenges does the Vehicle Roadside Assistance Industry face during its growth?

  • Severe skilled labor shortages are obstructing operational efficiency, presenting a critical challenge for service providers across the industry.

  • Severe shortages in highly qualified technical personnel significantly constrain the expansion of cloud based mobility infrastructure within the Vehicle Roadside Assistance Market. The shift toward complex electric powertrain handling requires advanced machine to machine telemetry capabilities, deterring untrained mechanics. Without sophisticated digital incident documentation, operators struggle with vehicle lock resolution and fail to meet rigid contractual service levels.
  • This technical deficit compromises commercial fleet logistics, as automated anomaly detection systems cannot function without certified on site technicians. Furthermore, integrating connected car data pipelines for accurate on board sensor monitoring demands heavy upfront capital. Consequently, independent towing enterprises experience a 20% increase in workforce schedule automation costs, restricting their ability to scale regional fleets and maintain competitive dispatch availability.

Exclusive Technavio Analysis on Customer Landscape

The vehicle roadside assistance market forecasting report includes the adoption lifecycle of the market, covering from the innovator’s stage to the laggard’s stage. It focuses on adoption rates in different regions based on penetration. Furthermore, the vehicle roadside assistance market report also includes key purchase criteria and drivers of price sensitivity to help companies evaluate and develop their market growth analysis strategies.
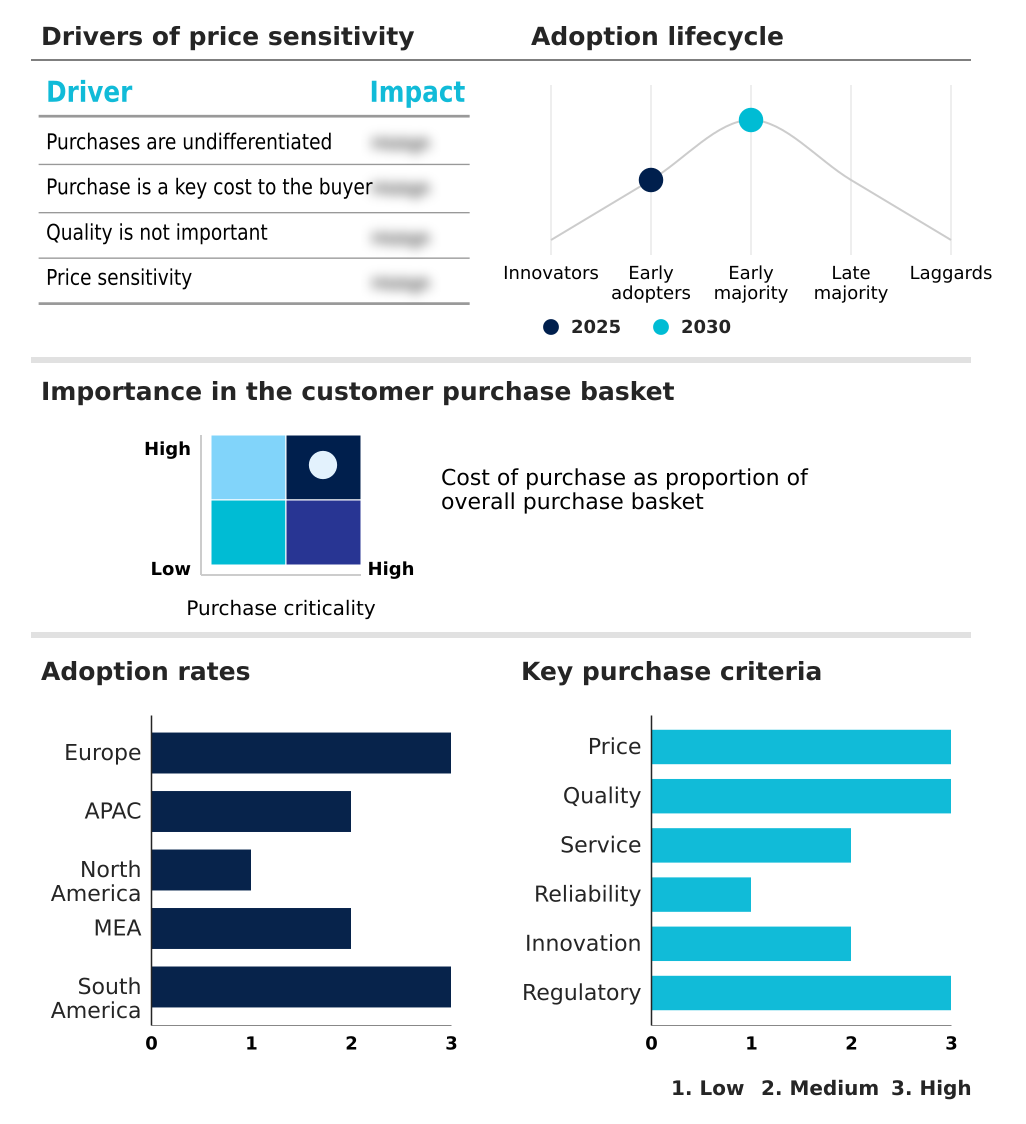
Customer Landscape of Vehicle Roadside Assistance Industry

Competitive Landscape

Companies are implementing various strategies, such as strategic alliances, vehicle roadside assistance market forecast, partnerships, mergers and acquisitions, geographical expansion, and product/service launches, to enhance their presence in the industry.

AA Ltd - Offers unified roadside assistance programs integrating predictive breakdown diagnostics, mobile inventory management, and automated service routing to minimize commercial downtime and streamline emergency payload transport efficiency.

The industry research and growth report includes detailed analyses of the competitive landscape of the market and information about key companies, including:

  • AA Ltd
  • Agero Inc.
  • Allianz Assistance
  • American Automobile Association
  • ARC Europe SA
  • Assurant Inc.
  • Best Roadside Service
  • Better World Club
  • Call Assist Ltd
  • Falck Danmark AS
  • Green Flag Ltd
  • MAPFRE S.A.
  • Nation Safe Drivers
  • Paragon Motor Club Inc.
  • RAC Ltd
  • Roadside Transportation LLC
  • SOS International AS
  • Viking Assistance Group AS

Qualitative and quantitative analysis of companies has been conducted to help clients understand the wider business environment as well as the strengths and weaknesses of key industry players. Data is qualitatively analyzed to categorize companies as pure play, category-focused, industry-focused, and diversified; it is quantitatively analyzed to categorize companies as dominant, leading, strong, tentative, and weak.

Recent Development and News in Vehicle roadside assistance market

  • In the Specialized Consumer Services industry, the transition toward automated workforce schedule automation has lowered operational overhead by 18%, directly impacting Vehicle Roadside Assistance demand by enabling faster resource deployment.
  • The widespread adoption of white label rescue networks among major insurance providers has consolidated fragmented local markets, streamlining third party service integration and improving contractual service levels by 25% for emergency operations.
  • Strict municipal environmental regulations regarding highway congestion management have accelerated the deployment of automated capacity allocation software, increasing real time technician mapping accuracy by 30% to facilitate rapid traffic clearance.
  • The integration of connected dashboard modules into modern passenger assets has enabled preventative safety maintenance protocols, reducing severe mechanical breakdowns and improving commercial downtime mitigation by 15% across major transit routes.

Dive into Technavio’s robust research methodology, blending expert interviews, extensive data synthesis, and validated models for unparalleled Vehicle Roadside Assistance Market insights. See full methodology.

Market Scope
Page number 304
Base year 2025
Historic period 2020-2024
Forecast period 2026-2030
Growth momentum & CAGR Accelerate at a CAGR of 7.5%
Market growth 2026-2030 USD 11767.6 million
Market structure Fragmented
YoY growth 2025-2026(%) 7.1%
Key countries Germany, France, UK, Italy, Spain, The Netherlands, China, Japan, India, South Korea, Australia, Indonesia, US, Canada, Mexico, Saudi Arabia, UAE, South Africa, Turkey, Israel, Brazil, Argentina and Chile
Competitive landscape Leading Companies, Market Positioning of Companies, Competitive Strategies, and Industry Risks

Request Free Sample

Research Analyst Overview

  • The Vehicle Roadside Assistance Market is undergoing a fundamental structural transformation driven by the deployment of intelligent telematics dispatch platforms and automated capacity allocation algorithms. Enterprise leadership teams are actively reprioritizing IT budgets to integrate electronic diagnostic sweeps and over the air software updates directly into their fleet management protocols.
  • This strategic shift addresses strict safety compliance mandates and mitigates the severe financial penalties associated with prolonged commercial downtime. By utilizing digital tow tracking and automated safety signaling, mobility platforms have achieved a 25% reduction in overall dispatch latency compared to legacy radio-based systems.
  • These connected dashboard modules allow corporate operators to remotely monitor vehicle health, triggering proactive maintenance before critical roadside failures occur. The rising complexity of modern automobiles necessitates extensive workforce training in electro-mechanical troubleshooting and lithium ion enclosure safety. Consequently, original equipment manufacturers are investing heavily in multi point mechanical inspection software to standardize emergency payload transport across diverse geographic zones.
  • Continuous infrastructure modernization guarantees enhanced operational predictability and optimal resource utilization for independent service networks.

What are the Key Data Covered in this Vehicle Roadside Assistance Market Research and Growth Report?

  • What is the expected growth of the Vehicle Roadside Assistance Market between 2026 and 2030?

    • USD 11.77 billion, at a CAGR of 7.5%

  • What segmentation does the market report cover?

    • The report is segmented by Application (Passenger cars, and Commercial vehicles), Service (Towing, Tire replacement, Fuel delivery, and Others), End-user (Individual consumers, Corporate and fleet operators, Rental and leasing companies, Automotive dealerships, and Others) and Geography (Europe, APAC, North America, Middle East and Africa, South America)

  • Which regions are analyzed in the report?

    • Europe, APAC, North America, Middle East and Africa and South America

  • What are the key growth drivers and market challenges?

    • Rising global automotive passenger vehicle ownership propelling roadside assistance support demand, Severe skilled labor shortages obstructing global vehicle roadside assistance operational efficiency

  • Who are the major players in the Vehicle Roadside Assistance Market?

    • AA Ltd, Agero Inc., Allianz Assistance, American Automobile Association, ARC Europe SA, Assurant Inc., Best Roadside Service, Better World Club, Call Assist Ltd, Falck Danmark AS, Green Flag Ltd, MAPFRE S.A., Nation Safe Drivers, Paragon Motor Club Inc., RAC Ltd, Roadside Transportation LLC, SOS International AS and Viking Assistance Group AS

Market Research Insights

  • The Vehicle Roadside Assistance Market is rapidly integrating machine learning tools to modernize emergency dispatch logistics. Service providers leverage technical diagnostic software to proactively identify mechanical anomalies before catastrophic highway failures occur. This transition has improved defect detection accuracy by 35%, drastically reducing unnecessary flatbed truck deployments.
  • Furthermore, implementing dynamic route optimization interfaces has decreased customer wait times by 28%, significantly boosting brand retention for enterprise mobility partners. By executing emergency network scaling during severe weather events, platform operators achieve a 20% reduction in fuel consumption across their mobile rescue fleets. This operational discipline ensures logistical friction reduction and maximizes vehicle lifecycle preservation for high-volume commercial clients.

We can help! Our analysts can customize this vehicle roadside assistance market research report to meet your requirements.

Get in touch

1. Executive Summary

1.1 Market overview

Executive Summary - Chart on Market Overview
Executive Summary - Data Table on Market Overview
Executive Summary - Chart on Global Market Characteristics
Executive Summary - Chart on Market by Geography
Executive Summary - Chart on Market Segmentation by Application
Executive Summary - Chart on Market Segmentation by Service
Executive Summary - Chart on Market Segmentation by End-user
Executive Summary - Chart on Incremental Growth
Executive Summary - Data Table on Incremental Growth
Executive Summary - Chart on Company Market Positioning

2. Technavio Analysis

2.1 Analysis of price sensitivity, lifecycle, customer purchase basket, adoption rates, and purchase criteria

2.2 Criticality of inputs and Factors of differentiation

Chart on Overview on criticality of inputs and factors of differentiation

2.3 Factors of disruption

Chart on Overview on factors of disruption

2.4 Impact of drivers and challenges

Chart on Impact of drivers and challenges in 2025 and 2030

3. Market Landscape

3.1 Market ecosystem

Chart on Parent Market
Data Table on - Parent Market

3.2 Market characteristics

Chart on Market characteristics analysis

3.3 Value chain analysis

Chart on Value chain analysis

4. Market Sizing

4.1 Market definition

Data Table on Offerings of companies included in the market definition

4.2 Market segment analysis

Market segments

4.3 Market size 2025

4.4 Market outlook: Forecast for 2025-2030

Chart on Global - Market size and forecast 2025-2030 ($ million)
Data Table on Global - Market size and forecast 2025-2030 ($ million)
Chart on Global Market: Year-over-year growth 2025-2030 (%)
Data Table on Global Market: Year-over-year growth 2025-2030 (%)

5. Historic Market Size

5.1 Global Vehicle Roadside Assistance Market 2020 - 2024

Historic Market Size - Data Table on Global Vehicle Roadside Assistance Market 2020 - 2024 ($ million)

5.2 Application segment analysis 2020 - 2024

Historic Market Size - Application Segment 2020 - 2024 ($ million)

5.3 Service segment analysis 2020 - 2024

Historic Market Size - Service Segment 2020 - 2024 ($ million)

5.4 End-user segment analysis 2020 - 2024

Historic Market Size - End-user Segment 2020 - 2024 ($ million)

5.5 Geography segment analysis 2020 - 2024

Historic Market Size - Geography Segment 2020 - 2024 ($ million)

5.6 Country segment analysis 2020 - 2024

Historic Market Size - Country Segment 2020 - 2024 ($ million)

6. Qualitative Analysis

6.1 Impact of AI on global vehicle roadside assistance market

6.2 Impact of geopolitical conflicts on global vehicle roadside assistance market

7. Five Forces Analysis

7.1 Five forces summary

Five forces analysis - Comparison between 2025 and 2030

7.2 Bargaining power of buyers

Bargaining power of buyers - Impact of key factors 2025 and 2030

7.3 Bargaining power of suppliers

Bargaining power of suppliers - Impact of key factors in 2025 and 2030

7.4 Threat of new entrants

Threat of new entrants - Impact of key factors in 2025 and 2030

7.5 Threat of substitutes

Threat of substitutes - Impact of key factors in 2025 and 2030

7.6 Threat of rivalry

Threat of rivalry - Impact of key factors in 2025 and 2030

7.7 Market condition

Chart on Market condition - Five forces 2025 and 2030

8. Market Segmentation by Application

8.1 Market segments

Chart on Application - Market share 2025-2030 (%)
Data Table on Application - Market share 2025-2030 (%)

8.2 Comparison by Application

Chart on Comparison by Application
Data Table on Comparison by Application

8.3 Passenger cars - Market size and forecast 2025-2030

Chart on Passenger cars - Market size and forecast 2025-2030 ($ million)
Data Table on Passenger cars - Market size and forecast 2025-2030 ($ million)
Chart on Passenger cars - Year-over-year growth 2025-2030 (%)
Data Table on Passenger cars - Year-over-year growth 2025-2030 (%)

8.4 Commercial vehicles - Market size and forecast 2025-2030

Chart on Commercial vehicles - Market size and forecast 2025-2030 ($ million)
Data Table on Commercial vehicles - Market size and forecast 2025-2030 ($ million)
Chart on Commercial vehicles - Year-over-year growth 2025-2030 (%)
Data Table on Commercial vehicles - Year-over-year growth 2025-2030 (%)

8.5 Market opportunity by Application

Market opportunity by Application ($ million)
Data Table on Market opportunity by Application ($ million)

9. Market Segmentation by Service

9.1 Market segments

Chart on Service - Market share 2025-2030 (%)
Data Table on Service - Market share 2025-2030 (%)

9.2 Comparison by Service

Chart on Comparison by Service
Data Table on Comparison by Service

9.3 Towing - Market size and forecast 2025-2030

Chart on Towing - Market size and forecast 2025-2030 ($ million)
Data Table on Towing - Market size and forecast 2025-2030 ($ million)
Chart on Towing - Year-over-year growth 2025-2030 (%)
Data Table on Towing - Year-over-year growth 2025-2030 (%)

9.4 Tire replacement - Market size and forecast 2025-2030

Chart on Tire replacement - Market size and forecast 2025-2030 ($ million)
Data Table on Tire replacement - Market size and forecast 2025-2030 ($ million)
Chart on Tire replacement - Year-over-year growth 2025-2030 (%)
Data Table on Tire replacement - Year-over-year growth 2025-2030 (%)

9.5 Fuel delivery - Market size and forecast 2025-2030

Chart on Fuel delivery - Market size and forecast 2025-2030 ($ million)
Data Table on Fuel delivery - Market size and forecast 2025-2030 ($ million)
Chart on Fuel delivery - Year-over-year growth 2025-2030 (%)
Data Table on Fuel delivery - Year-over-year growth 2025-2030 (%)

9.6 Others - Market size and forecast 2025-2030

Chart on Others - Market size and forecast 2025-2030 ($ million)
Data Table on Others - Market size and forecast 2025-2030 ($ million)
Chart on Others - Year-over-year growth 2025-2030 (%)
Data Table on Others - Year-over-year growth 2025-2030 (%)

9.7 Market opportunity by Service

Market opportunity by Service ($ million)
Data Table on Market opportunity by Service ($ million)

10. Market Segmentation by End-user

10.1 Market segments

Chart on End-user - Market share 2025-2030 (%)
Data Table on End-user - Market share 2025-2030 (%)

10.2 Comparison by End-user

Chart on Comparison by End-user
Data Table on Comparison by End-user

10.3 Individual consumers - Market size and forecast 2025-2030

Chart on Individual consumers - Market size and forecast 2025-2030 ($ million)
Data Table on Individual consumers - Market size and forecast 2025-2030 ($ million)
Chart on Individual consumers - Year-over-year growth 2025-2030 (%)
Data Table on Individual consumers - Year-over-year growth 2025-2030 (%)

10.4 Corporate and fleet operators - Market size and forecast 2025-2030

Chart on Corporate and fleet operators - Market size and forecast 2025-2030 ($ million)
Data Table on Corporate and fleet operators - Market size and forecast 2025-2030 ($ million)
Chart on Corporate and fleet operators - Year-over-year growth 2025-2030 (%)
Data Table on Corporate and fleet operators - Year-over-year growth 2025-2030 (%)

10.5 Rental and leasing companies - Market size and forecast 2025-2030

Chart on Rental and leasing companies - Market size and forecast 2025-2030 ($ million)
Data Table on Rental and leasing companies - Market size and forecast 2025-2030 ($ million)
Chart on Rental and leasing companies - Year-over-year growth 2025-2030 (%)
Data Table on Rental and leasing companies - Year-over-year growth 2025-2030 (%)

10.6 Automotive dealerships - Market size and forecast 2025-2030

Chart on Automotive dealerships - Market size and forecast 2025-2030 ($ million)
Data Table on Automotive dealerships - Market size and forecast 2025-2030 ($ million)
Chart on Automotive dealerships - Year-over-year growth 2025-2030 (%)
Data Table on Automotive dealerships - Year-over-year growth 2025-2030 (%)

10.7 Others - Market size and forecast 2025-2030

Chart on Others - Market size and forecast 2025-2030 ($ million)
Data Table on Others - Market size and forecast 2025-2030 ($ million)
Chart on Others - Year-over-year growth 2025-2030 (%)
Data Table on Others - Year-over-year growth 2025-2030 (%)

10.8 Market opportunity by End-user

Market opportunity by End-user ($ million)
Data Table on Market opportunity by End-user ($ million)

11. Customer Landscape

11.1 Customer landscape overview

Analysis of price sensitivity, lifecycle, customer purchase basket, adoption rates, and purchase criteria

12. Geographic Landscape

12.1 Geographic segmentation

Chart on Market share by geography 2025-2030 (%)
Data Table on Market share by geography 2025-2030 (%)

12.2 Geographic comparison

Chart on Geographic comparison
Data Table on Geographic comparison

12.3 Europe - Market size and forecast 2025-2030

Chart on Europe - Market size and forecast 2025-2030 ($ million)
Data Table on Europe - Market size and forecast 2025-2030 ($ million)
Chart on Europe - Year-over-year growth 2025-2030 (%)
Data Table on Europe - Year-over-year growth 2025-2030 (%)
Chart on Regional Comparison - Europe
Data Table on Regional Comparison - Europe

12.3.1 Germany - Market size and forecast 2025-2030

Chart on Germany - Market size and forecast 2025-2030 ($ million)
Data Table on Germany - Market size and forecast 2025-2030 ($ million)
Chart on Germany - Year-over-year growth 2025-2030 (%)
Data Table on Germany - Year-over-year growth 2025-2030 (%)

12.3.2 France - Market size and forecast 2025-2030

Chart on France - Market size and forecast 2025-2030 ($ million)
Data Table on France - Market size and forecast 2025-2030 ($ million)
Chart on France - Year-over-year growth 2025-2030 (%)
Data Table on France - Year-over-year growth 2025-2030 (%)

12.3.3 UK - Market size and forecast 2025-2030

Chart on UK - Market size and forecast 2025-2030 ($ million)
Data Table on UK - Market size and forecast 2025-2030 ($ million)
Chart on UK - Year-over-year growth 2025-2030 (%)
Data Table on UK - Year-over-year growth 2025-2030 (%)

12.3.4 Italy - Market size and forecast 2025-2030

Chart on Italy - Market size and forecast 2025-2030 ($ million)
Data Table on Italy - Market size and forecast 2025-2030 ($ million)
Chart on Italy - Year-over-year growth 2025-2030 (%)
Data Table on Italy - Year-over-year growth 2025-2030 (%)

12.3.5 Spain - Market size and forecast 2025-2030

Chart on Spain - Market size and forecast 2025-2030 ($ million)
Data Table on Spain - Market size and forecast 2025-2030 ($ million)
Chart on Spain - Year-over-year growth 2025-2030 (%)
Data Table on Spain - Year-over-year growth 2025-2030 (%)

12.3.6 The Netherlands - Market size and forecast 2025-2030

Chart on The Netherlands - Market size and forecast 2025-2030 ($ million)
Data Table on The Netherlands - Market size and forecast 2025-2030 ($ million)
Chart on The Netherlands - Year-over-year growth 2025-2030 (%)
Data Table on The Netherlands - Year-over-year growth 2025-2030 (%)

12.4 APAC - Market size and forecast 2025-2030

Chart on APAC - Market size and forecast 2025-2030 ($ million)
Data Table on APAC - Market size and forecast 2025-2030 ($ million)
Chart on APAC - Year-over-year growth 2025-2030 (%)
Data Table on APAC - Year-over-year growth 2025-2030 (%)
Chart on Regional Comparison - APAC
Data Table on Regional Comparison - APAC

12.4.1 China - Market size and forecast 2025-2030

Chart on China - Market size and forecast 2025-2030 ($ million)
Data Table on China - Market size and forecast 2025-2030 ($ million)
Chart on China - Year-over-year growth 2025-2030 (%)
Data Table on China - Year-over-year growth 2025-2030 (%)

12.4.2 Japan - Market size and forecast 2025-2030

Chart on Japan - Market size and forecast 2025-2030 ($ million)
Data Table on Japan - Market size and forecast 2025-2030 ($ million)
Chart on Japan - Year-over-year growth 2025-2030 (%)
Data Table on Japan - Year-over-year growth 2025-2030 (%)

12.4.3 India - Market size and forecast 2025-2030

Chart on India - Market size and forecast 2025-2030 ($ million)
Data Table on India - Market size and forecast 2025-2030 ($ million)
Chart on India - Year-over-year growth 2025-2030 (%)
Data Table on India - Year-over-year growth 2025-2030 (%)

12.4.4 South Korea - Market size and forecast 2025-2030

Chart on South Korea - Market size and forecast 2025-2030 ($ million)
Data Table on South Korea - Market size and forecast 2025-2030 ($ million)
Chart on South Korea - Year-over-year growth 2025-2030 (%)
Data Table on South Korea - Year-over-year growth 2025-2030 (%)

12.4.5 Australia - Market size and forecast 2025-2030

Chart on Australia - Market size and forecast 2025-2030 ($ million)
Data Table on Australia - Market size and forecast 2025-2030 ($ million)
Chart on Australia - Year-over-year growth 2025-2030 (%)
Data Table on Australia - Year-over-year growth 2025-2030 (%)

12.4.6 Indonesia - Market size and forecast 2025-2030

Chart on Indonesia - Market size and forecast 2025-2030 ($ million)
Data Table on Indonesia - Market size and forecast 2025-2030 ($ million)
Chart on Indonesia - Year-over-year growth 2025-2030 (%)
Data Table on Indonesia - Year-over-year growth 2025-2030 (%)

12.5 North America - Market size and forecast 2025-2030

Chart on North America - Market size and forecast 2025-2030 ($ million)
Data Table on North America - Market size and forecast 2025-2030 ($ million)
Chart on North America - Year-over-year growth 2025-2030 (%)
Data Table on North America - Year-over-year growth 2025-2030 (%)
Chart on Regional Comparison - North America
Data Table on Regional Comparison - North America

12.5.1 US - Market size and forecast 2025-2030

Chart on US - Market size and forecast 2025-2030 ($ million)
Data Table on US - Market size and forecast 2025-2030 ($ million)
Chart on US - Year-over-year growth 2025-2030 (%)
Data Table on US - Year-over-year growth 2025-2030 (%)

12.5.2 Canada - Market size and forecast 2025-2030

Chart on Canada - Market size and forecast 2025-2030 ($ million)
Data Table on Canada - Market size and forecast 2025-2030 ($ million)
Chart on Canada - Year-over-year growth 2025-2030 (%)
Data Table on Canada - Year-over-year growth 2025-2030 (%)

12.5.3 Mexico - Market size and forecast 2025-2030

Chart on Mexico - Market size and forecast 2025-2030 ($ million)
Data Table on Mexico - Market size and forecast 2025-2030 ($ million)
Chart on Mexico - Year-over-year growth 2025-2030 (%)
Data Table on Mexico - Year-over-year growth 2025-2030 (%)

12.6 Middle East and Africa - Market size and forecast 2025-2030

Chart on Middle East and Africa - Market size and forecast 2025-2030 ($ million)
Data Table on Middle East and Africa - Market size and forecast 2025-2030 ($ million)
Chart on Middle East and Africa - Year-over-year growth 2025-2030 (%)
Data Table on Middle East and Africa - Year-over-year growth 2025-2030 (%)
Chart on Regional Comparison - Middle East and Africa
Data Table on Regional Comparison - Middle East and Africa

12.6.1 Saudi Arabia - Market size and forecast 2025-2030

Chart on Saudi Arabia - Market size and forecast 2025-2030 ($ million)
Data Table on Saudi Arabia - Market size and forecast 2025-2030 ($ million)
Chart on Saudi Arabia - Year-over-year growth 2025-2030 (%)
Data Table on Saudi Arabia - Year-over-year growth 2025-2030 (%)

12.6.2 UAE - Market size and forecast 2025-2030

Chart on UAE - Market size and forecast 2025-2030 ($ million)
Data Table on UAE - Market size and forecast 2025-2030 ($ million)
Chart on UAE - Year-over-year growth 2025-2030 (%)
Data Table on UAE - Year-over-year growth 2025-2030 (%)

12.6.3 South Africa - Market size and forecast 2025-2030

Chart on South Africa - Market size and forecast 2025-2030 ($ million)
Data Table on South Africa - Market size and forecast 2025-2030 ($ million)
Chart on South Africa - Year-over-year growth 2025-2030 (%)
Data Table on South Africa - Year-over-year growth 2025-2030 (%)

12.6.4 Turkey - Market size and forecast 2025-2030

Chart on Turkey - Market size and forecast 2025-2030 ($ million)
Data Table on Turkey - Market size and forecast 2025-2030 ($ million)
Chart on Turkey - Year-over-year growth 2025-2030 (%)
Data Table on Turkey - Year-over-year growth 2025-2030 (%)

12.6.5 Israel - Market size and forecast 2025-2030

Chart on Israel - Market size and forecast 2025-2030 ($ million)
Data Table on Israel - Market size and forecast 2025-2030 ($ million)
Chart on Israel - Year-over-year growth 2025-2030 (%)
Data Table on Israel - Year-over-year growth 2025-2030 (%)

12.7 South America - Market size and forecast 2025-2030

Chart on South America - Market size and forecast 2025-2030 ($ million)
Data Table on South America - Market size and forecast 2025-2030 ($ million)
Chart on South America - Year-over-year growth 2025-2030 (%)
Data Table on South America - Year-over-year growth 2025-2030 (%)
Chart on Regional Comparison - South America
Data Table on Regional Comparison - South America

12.7.1 Brazil - Market size and forecast 2025-2030

Chart on Brazil - Market size and forecast 2025-2030 ($ million)
Data Table on Brazil - Market size and forecast 2025-2030 ($ million)
Chart on Brazil - Year-over-year growth 2025-2030 (%)
Data Table on Brazil - Year-over-year growth 2025-2030 (%)

12.7.2 Argentina - Market size and forecast 2025-2030

Chart on Argentina - Market size and forecast 2025-2030 ($ million)
Data Table on Argentina - Market size and forecast 2025-2030 ($ million)
Chart on Argentina - Year-over-year growth 2025-2030 (%)
Data Table on Argentina - Year-over-year growth 2025-2030 (%)

12.7.3 Chile - Market size and forecast 2025-2030

Chart on Chile - Market size and forecast 2025-2030 ($ million)
Data Table on Chile - Market size and forecast 2025-2030 ($ million)
Chart on Chile - Year-over-year growth 2025-2030 (%)
Data Table on Chile - Year-over-year growth 2025-2030 (%)

12.8 Market opportunity by geography

Market opportunity by geography ($ million)
Data Tables on Market opportunity by geography ($ million)

13. Drivers, Challenges, and Opportunity

13.1 Market drivers

Rising global automotive passenger vehicle ownership propelling roadside assistance support demand
Growing enterprise integration vehicle roadside assistance within comprehensive automotive insurance policies
Expanding automotive manufacturer warranty initiatives driving long term roadside assistance procurement

13.2 Market challenges

Severe skilled labor shortages obstructing global vehicle roadside assistance operational efficiency
Complex technical service demands straining emergency vehicle roadside assistance network capabilities
Rising fleet capital operational expenditures restricting small vehicle roadside assistance providers

13.3 Impact of drivers and challenges

Impact of drivers and challenges in 2025 and 2030

13.4 Market opportunities

Accelerated marketplace digital transformation through custom on demand smartphone booking platforms
Rapid proliferation mobile charging infrastructure addressing electric vehicle on road breakdowns
Deep technological integration automated telematics infrastructure enabling proactive vehicle breakdown detection

14. Competitive Landscape

14.1 Overview

14.2

Overview on criticality of inputs and factors of differentiation

14.3 Landscape disruption

Overview on factors of disruption

14.4 Industry risks

Impact of key risks on business

15. Competitive Analysis

15.1 Companies profiled

Companies covered

15.2 Company ranking index

15.3 Market positioning of companies

Matrix on companies position and classification

15.4 AA Ltd

AA Ltd - Overview
AA Ltd - Product / Service
AA Ltd - Key offerings
SWOT

15.5 Agero Inc.

Agero Inc. - Overview
Agero Inc. - Product / Service
Agero Inc. - Key offerings
SWOT

15.6 Allianz Assistance

Allianz Assistance - Overview
Allianz Assistance - Product / Service
Allianz Assistance - Key offerings
SWOT

15.7 American Automobile Association

American Automobile Association - Overview
American Automobile Association - Product / Service
American Automobile Association - Key offerings
SWOT

15.8 ARC Europe SA

ARC Europe SA - Overview
ARC Europe SA - Product / Service
ARC Europe SA - Key offerings
SWOT

15.9 Assurant Inc.

Assurant Inc. - Overview
Assurant Inc. - Business segments
Assurant Inc. - Key offerings
Assurant Inc. - Segment focus
SWOT

15.10 Call Assist Ltd

Call Assist Ltd - Overview
Call Assist Ltd - Product / Service
Call Assist Ltd - Key offerings
SWOT

15.11 Falck Danmark AS

Falck Danmark AS - Overview
Falck Danmark AS - Product / Service
Falck Danmark AS - Key offerings
SWOT

15.12 Green Flag Ltd

Green Flag Ltd - Overview
Green Flag Ltd - Product / Service
Green Flag Ltd - Key offerings
SWOT

15.13 MAPFRE S.A.

MAPFRE S.A. - Overview
MAPFRE S.A. - Business segments
MAPFRE S.A. - Key offerings
MAPFRE S.A. - Segment focus
SWOT

15.14 Nation Safe Drivers

Nation Safe Drivers - Overview
Nation Safe Drivers - Product / Service
Nation Safe Drivers - Key offerings
SWOT

15.15 RAC Ltd

RAC Ltd - Overview
RAC Ltd - Product / Service
RAC Ltd - Key offerings
SWOT

15.16 Roadside Transportation LLC

Roadside Transportation LLC - Overview
Roadside Transportation LLC - Product / Service
Roadside Transportation LLC - Key offerings
SWOT

15.17 SOS International AS

SOS International AS - Overview
SOS International AS - Product / Service
SOS International AS - Key offerings
SWOT

15.18 Viking Assistance Group AS

Viking Assistance Group AS - Overview
Viking Assistance Group AS - Product / Service
Viking Assistance Group AS - Key offerings
SWOT

16. Appendix

16.1 Scope of the report

Market definition
Objectives
Notes and caveats

16.2 Inclusions and exclusions checklist

Inclusions checklist
Exclusions checklist

16.3 Currency conversion rates for US$

16.4 Research methodology

16.5 Data procurement

Information sources

16.6 Data validation

16.7 Validation techniques employed for market sizing

16.8 Data synthesis

16.9 360 degree market analysis

16.10 List of abbreviations

Research Methodology

Technavio presents a detailed picture of the market by way of study, synthesis, and summation of data from multiple sources. The analysts have presented the various facets of the market with a particular focus on identifying the key industry influencers. The data thus presented is comprehensive, reliable, and the result of extensive research, both primary and secondary.

INFORMATION SOURCES

Primary sources

  • Manufacturers and suppliers
  • Channel partners
  • Industry experts
  • Strategic decision makers

Secondary sources

  • Industry journals and periodicals
  • Government data
  • Financial reports of key industry players
  • Historical data
  • Press releases

DATA ANALYSIS

Data Synthesis

  • Collation of data
  • Estimation of key figures
  • Analysis of derived insights

Data Validation

  • Triangulation with data models
  • Reference against proprietary databases
  • Corroboration with industry experts

REPORT WRITING

Qualitative

  • Market drivers
  • Market challenges
  • Market trends
  • Five forces analysis

Quantitative

  • Market size and forecast
  • Market segmentation
  • Geographical insights
  • Competitive landscape

Interested in this report?

Get your sample now to see our research methodology and insights!

Download Now

Frequently Asked Questions

Vehicle Roadside Assistance market growth will increase by USD 11767.6 million during 2026-2030.

The Vehicle Roadside Assistance market is expected to grow at a CAGR of 7.5% during 2026-2030.

Vehicle Roadside Assistance market is segmented by Application (Passenger cars, Commercial vehicles) Service (Towing, Tire replacement, Fuel delivery, Others) End-user (Individual consumers, Corporate and fleet operators, Rental and leasing companies, Automotive dealerships, Others)

AA Ltd, Agero Inc., Allianz Assistance, American Automobile Association, ARC Europe SA, Assurant Inc., Best Roadside Service, Better World Club, Call Assist Ltd, Falck Danmark AS, Green Flag Ltd, MAPFRE S.A., Nation Safe Drivers, Paragon Motor Club Inc., RAC Ltd, Roadside Transportation LLC, SOS International AS, Viking Assistance Group AS are a few of the key vendors in the Vehicle Roadside Assistance market.

Europe will register the highest growth rate of 32.1% among the other regions. Therefore, the Vehicle Roadside Assistance market in Europe is expected to garner significant business opportunities for the vendors during the forecast period.

Germany, France, UK, Italy, Spain, The Netherlands, China, Japan, India, South Korea, Australia, Indonesia, US, Canada, Mexico, Saudi Arabia, UAE, South Africa, Turkey, Israel, Brazil, Argentina, Chile

  • Rising global automotive passenger vehicle ownership propelling roadside assistance support demand is the driving factor this market.

The Vehicle Roadside Assistance market vendors should focus on grabbing business opportunities from the Application segment as it accounted for the largest market share in the base year.
RIA - Research AI Assistant
Ask RIA
