Vessel Traffic Management System Market Analysis APAC, Europe, North America, Middle East and Africa, South America - US, China, India, Japan, Singapore, Germany, UK, UAE, South Korea, France - Size and Forecast 2025-2029

Vessel Traffic Management System Market Analysis APAC, Europe, North America, Middle East and Africa, South America - US, China, India, Japan, Singapore, Germany, UK, UAE, South Korea, France - Size and Forecast 2025-2029

Published: Jan 2025 212 Pages SKU: IRTNTR71502

Market Overview at a Glance

$616.4 Mn
Market Opportunity
4.8%
CAGR
3.4
YoY growth 2024-2025(%)

Vessel Traffic Management System Market Size 2025-2029

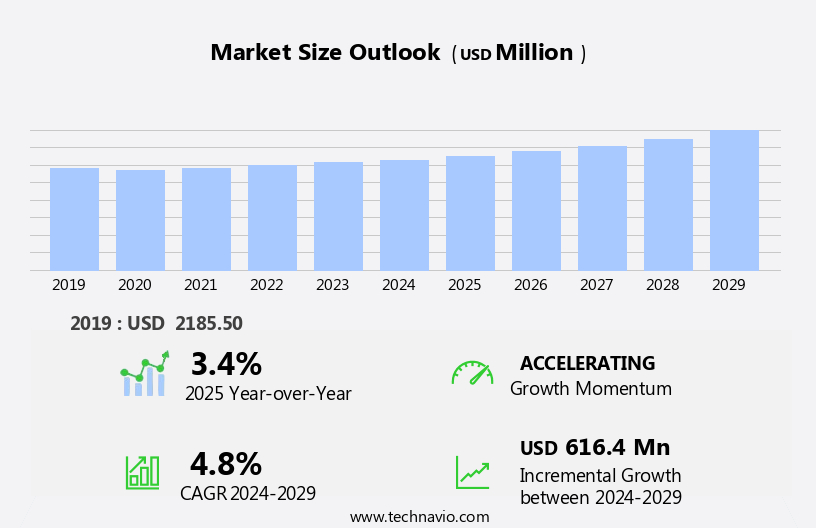
The vessel traffic management system market size is forecast to increase by USD 616.4 million, at a CAGR of 4.8% between 2024 and 2029.

  • The Vessel Traffic Management System (VTMS) market is witnessing significant growth, driven by the increasing volume of maritime trade. The need for efficient and secure navigation of vessels in congested waterways is becoming increasingly crucial, leading to a surge in demand for advanced VTMS solutions. Furthermore, new product launches in the market are introducing innovative features, such as real-time monitoring and automated decision-making, enhancing the overall value proposition. However, the market faces challenges in the form of high implementation costs. Integrating and maintaining complex VTMS systems can be costly, especially for smaller organizations or developing countries.
  • This can act as a barrier to entry for some potential buyers, limiting market penetration. Despite these challenges, companies seeking to capitalize on the market opportunities can focus on offering cost-effective solutions or financing options to overcome this obstacle. Additionally, collaborating with local governments and organizations to provide training and support can help build trust and increase market share. Overall, the VTMS market presents significant potential for growth, with the ability to improve safety, efficiency, and security in maritime transportation.

What will be the Size of the Vessel Traffic Management System Market during the forecast period?

Vessel Traffic Management System Market Size

Explore in-depth regional segment analysis with market size data - historical 2019-2023 and forecasts 2025-2029 - in the full report.  
Request Free Sample

The market is characterized by its continuous evolution and dynamic nature, driven by advancements in technology and the growing demand for efficient and safe maritime operations. Network infrastructure plays a crucial role in facilitating real-time data communication and exchange, enabling predictive modeling and collision avoidance systems. Cloud computing and data processing enable the storage and analysis of vast amounts of data, from position reporting to environmental monitoring, providing valuable insights for risk assessment and port efficiency. Operator interfaces and user experience (UX) are increasingly prioritized to ensure seamless integration of various components, including radar systems, incident management systems, and reporting tools.

Technical support and software updates are essential for maintaining system reliability and ensuring compliance with evolving regulations. Artificial intelligence (AI) and machine learning (ML) are transforming vessel traffic management systems, offering advanced capabilities for data analysis, decision support, and route optimization. Real-time tracking and data visualization enable effective monitoring of traffic flow and congestion, while satellite communication and CCTV cameras enhance coastal surveillance and environmental protection. Vessel identification and course prediction are critical for efficient port management, while maintenance contracts and data validation ensure system integrity and availability. The ongoing development of vessel traffic management systems continues to unfold, with new applications and technologies emerging to address the evolving needs of the maritime industry.

How is this Vessel Traffic Management System Industry segmented?

The vessel traffic management system industry research report provides comprehensive data (region-wise segment analysis), with forecasts and estimates in "USD million" for the period 2025-2029, as well as historical data from 2019-2023 for the following segments.

  • Component
    • Hardware
    • Software
    • Services
  • End-user
    • Commercial
    • Military
  • Geography
    • North America
      • US
    • Europe
      • France
      • Germany
      • UK
    • Middle East and Africa
      • UAE
    • APAC
      • China
      • India
      • Japan
      • Singapore
      • South Korea
    • Rest of World (ROW)

By Component Insights

The hardware segment is estimated to witness significant growth during the forecast period.

The market encompasses various technologies and components that facilitate safe and efficient maritime navigation. Network infrastructure forms the backbone of these systems, enabling seamless data communication between vessels, shore-based facilities, and authorities. Predictive modeling and cloud computing enhance the system's capabilities, providing real-time insights and improving overall performance. Environmental monitoring is another crucial aspect, ensuring compliance with regulations and protecting marine ecosystems. Data communication protocols and position reporting enable accurate vessel tracking and data exchange. Operator interfaces and real-time tracking offer enhanced situational awareness, while data analytics and processing enable informed decision-making. Risk assessment and collision avoidance systems are integral to maintaining maritime safety, utilizing AIS message decoding and sensor fusion.

Technical support and software updates ensure system reliability and seamless integration. Radar systems and incident management systems provide critical information for emergency response. Training programs and historical data analysis optimize traffic flow and enhance port efficiency. Compliance regulations, shore-based radar, and maritime safety are essential considerations for VTMS. Big data analytics and machine learning algorithms improve system performance and enable predictive maintenance. Vessel identification, data storage, course prediction, and maintenance contracts are essential components of the system. Port management systems, reporting tools, and traffic monitoring software optimize port operations and improve overall efficiency. Artificial intelligence, navigation safety, and congestion monitoring enhance the system's capabilities, ensuring safe and efficient maritime navigation.

Vessel Traffic Management System Market Size

Request Free Sample

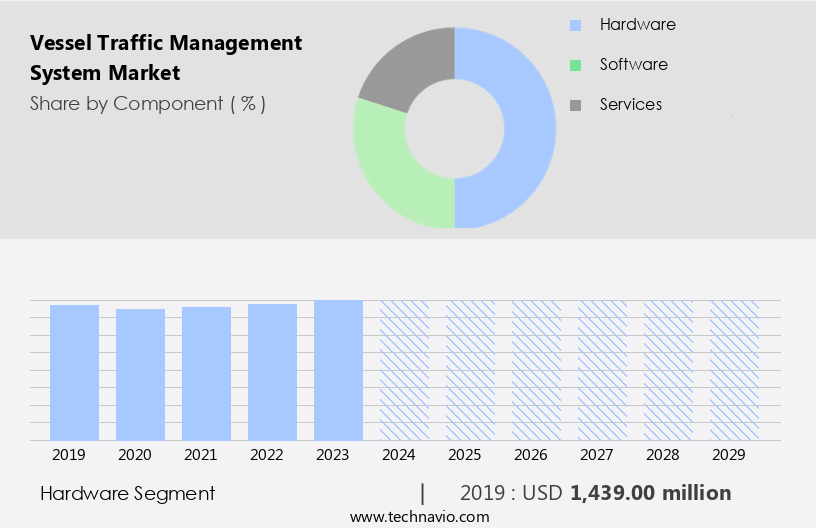
The Hardware segment was valued at USD 1439.00 million in 2019 and showed a gradual increase during the forecast period.

Regional Analysis

APAC is estimated to contribute 53% to the growth of the global market during the forecast period. Technavio's analysts have elaborately explained the regional trends and drivers that shape the market during the forecast period.

Vessel Traffic Management System Market Share by Geography

 Request Free Sample

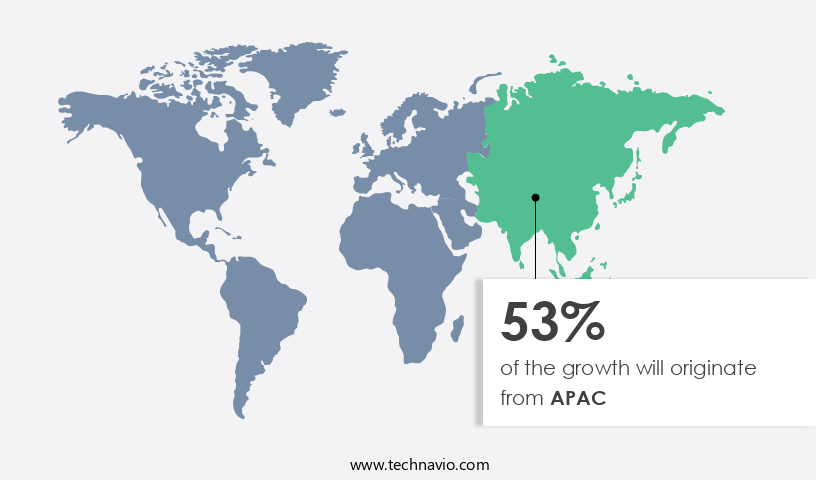
In the dynamic and crucial maritime industry, the Asia-Pacific (APAC) region plays a significant role in global trade, necessitating advanced vessel traffic management systems (VTMS). China, India, and Singapore are key contributors to this region's maritime activities, with China's maritime transport sector handling 30.1% of global marine shipping in 2023, marking a 2.2 percentage point increase from the previous year. This sector moved an impressive 4.96 billion tons of foreign trade cargo through coastal ports, demonstrating a 9% year-on-year growth. Network infrastructure, predictive modeling, and cloud computing are essential components of these systems, enabling real-time tracking, data analytics, and data processing.

Collision avoidance systems, incident management, and risk assessment rely on data communication protocols and position reporting. Operator interfaces, training programs, and vessel identification ensure efficient and effective system usage. Environmental monitoring, compliance regulations, and maritime safety are crucial aspects of these systems, integrating radar systems, satellite communication, CCTV cameras, and coastal surveillance. Big data analytics, machine learning, and sensor fusion provide decision support systems, enhancing system reliability and integration. AI, emergency response, data visualization, and user experience optimize navigation safety and port efficiency. Vessel tracking, route optimization, and traffic flow optimization are integral to environmental protection and maritime surveillance.

Software updates, maintenance contracts, and reporting tools ensure system continuity and performance.

Market Dynamics

Our researchers analyzed the data with 2024 as the base year, along with the key drivers, trends, and challenges. A holistic analysis of drivers will help companies refine their marketing strategies to gain a competitive advantage.

The market is a dynamic and evolving sector that focuses on enhancing maritime safety, efficiency, and communication. Integrating advanced technologies such as Automatic Identification System (AIS), Long Range Identification and Tracking (LRIT), and Vessel Traffic Services (VTS), these systems facilitate real-time monitoring, collision avoidance, and optimized routing. Additionally, they ensure compliance with International Maritime Organization (IMO) regulations, providing situational awareness and reducing congestion in busy waterways. Real-time weather information, integrated bridge systems, and automated information exchange further strengthen the capabilities of vessel traffic management systems. These solutions foster collaboration between port authorities, shipping lines, and other stakeholders, ensuring secure, efficient, and sustainable maritime operations.

What are the key market drivers leading to the rise in the adoption of Vessel Traffic Management System Industry?

  • The significant increase in maritime trade volume serves as the primary market driver. 
  • The vessel traffic management system (VTMS) market is experiencing significant growth due to the increasing volume of maritime trade. In 2023, global maritime trade rebounded, expanding by 2.4% to reach 12.3 billion tons, following a contraction in the previous year. This trend highlights the importance of maritime transport in international commerce and the need for effective traffic management systems to handle the rising cargo volumes. The market is expected to continue expanding, with a predicted growth rate of 2% in 2024 and an average annual growth rate of 2.4% through 2029. This sustained growth in maritime trade is driving demand for advanced VTMS solutions, as ports and shipping companies strive to enhance operational efficiency, ensure safety, and optimize vessel movements.
  • Network infrastructure, predictive modeling, cloud computing, environmental monitoring, data communication protocols, position reporting, operator interfaces, real-time tracking, data analytics, data processing, risk assessment, collision avoidance systems, and AIS message decoding are integral components of modern VTMS. Technical support is also crucial to ensure seamless system operation. These features enable ports and shipping companies to manage vessel traffic more effectively, reducing congestion, minimizing delays, and improving overall productivity. By leveraging advanced technologies, VTMS solutions facilitate safer, more efficient, and environmentally sustainable maritime operations.

What are the market trends shaping the Vessel Traffic Management System Industry?

  • The trend in the market is toward new product launches. As a professional, I can provide you with up-to-date information on upcoming product introductions.
  • The market is experiencing substantial growth due to the increasing emphasis on enhancing port efficiency, safety, and security. Advanced technologies, such as radar systems, incident management systems, speed monitoring, and historical data analysis, are driving this trend. For instance, the Subic Bay Metropolitan Authority (SBMA) recently introduced a modern vessel traffic management system to replace an outdated infrastructure at the Port of Subic. This new system, which incorporates satellite communication, CCTV cameras, and traffic flow optimization, positions Subic Bay Freeport as a world-class port. Similarly, the Authority of the Freeport Area of Bataan (AFAB) launched a high-tech vessel communication system to streamline communication between vessels and port authorities.
  • These initiatives underscore the importance of adopting advanced technologies to meet the demands of maritime trade and ensure the smooth and secure movement of vessels. Additionally, vessel tracking, route optimization, environmental protection, and big data analytics are other key areas of focus for market participants. Compliance with regulations is also a significant factor driving market growth.

What challenges does the Vessel Traffic Management System Industry face during its growth?

  • The high implementation costs pose a significant challenge to the growth of the industry. This obstacle, which is a common concern among industry professionals, can hinder the expansion and progress of businesses in this sector. 
  • The global Vessel Traffic Management System (VTMS) market requires substantial investment due to high implementation costs. Advanced VTMS deployment involves expenses on infrastructure, technology, and skilled personnel for radar systems, Automatic Identification System (AIS) equipment, sensors, communication devices, data storage solutions, and software platforms. Integration costs, ongoing maintenance, and operator training further add to the financial burden. For instance, a small to medium-sized port's basic VTMS setup may cost between USD 1 million and USD5 million, depending on the system's scale and complexity. In contrast, major ports with high traffic volumes can invest between USD 10 million and over USD 30 million for advanced VTMS, including features like artificial intelligence (AI) for course prediction, data visualization for port efficiency, and emergency response systems for maritime safety.
  • These investments ensure the implementation of sophisticated traffic monitoring software, port management systems, and reporting tools that optimize port operations, enhance maritime safety, and improve overall port efficiency.

Exclusive Customer Landscape

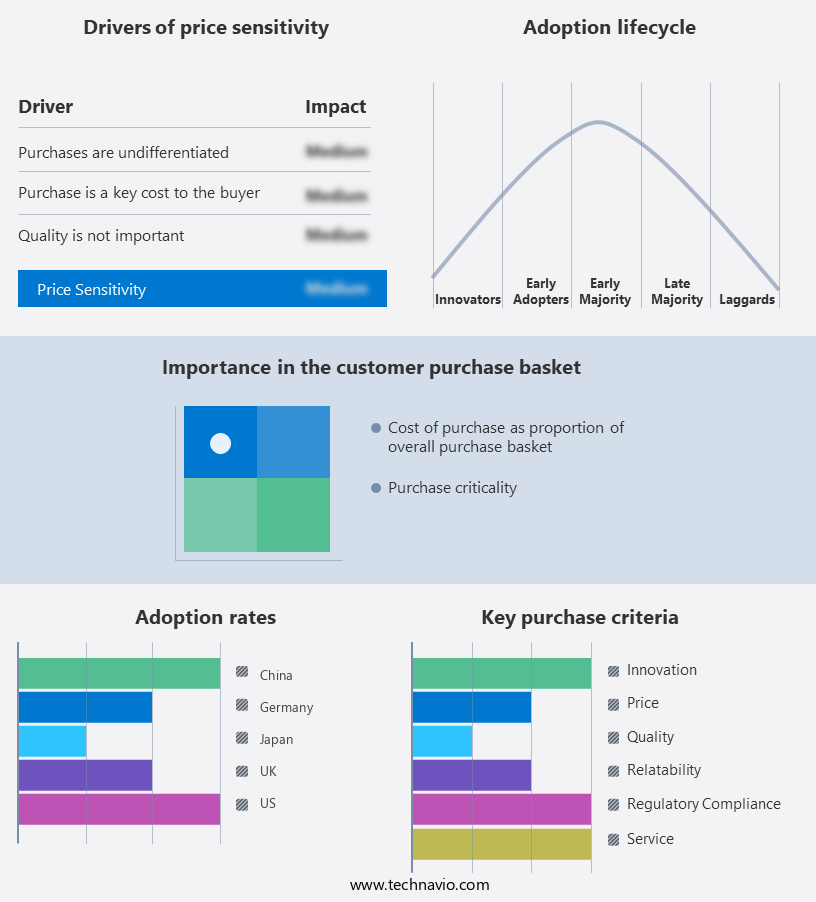
The vessel traffic management system market forecasting report includes the adoption lifecycle of the market, covering from the innovator's stage to the laggard's stage. It focuses on adoption rates in different regions based on penetration. Furthermore, the vessel traffic management system market report also includes key purchase criteria and drivers of price sensitivity to help companies evaluate and develop their market growth analysis strategies.

Vessel Traffic Management System Market Share by Geography

 Customer Landscape

Key Companies & Market Insights

Companies are implementing various strategies, such as strategic alliances, vessel traffic management system market forecast, partnerships, mergers and acquisitions, geographical expansion, and product/service launches, to enhance their presence in the industry.

ARS T and TT - The company delivers vessel traffic management systems, such as smartVTS, enabling effective navigational and managerial decision-making for maritime traffic. 

The industry research and growth report includes detailed analyses of the competitive landscape of the market and information about key companies, including:

  • ARS T and TT
  • Frequentis AG
  • Indra Sistemas SA
  • Israel Aerospace Industries Ltd.
  • Japan Radio Co. Ltd.
  • Kongsberg Gruppen ASA
  • L3Harris Technologies Inc.
  • Leonardo Spa
  • Mesemar
  • Northrop Grumman Corp.
  • Rolls Royce Holdings Plc
  • Rolta India Ltd.
  • Saab AB
  • Singapore Technologies Engineering Ltd.
  • SRT Marine Systems Plc
  • Technolution BV
  • Terma AS
  • Thales Group
  • Tidalis
  • Tokyo Keiki Inc.
  • Wartsila Corp.

Qualitative and quantitative analysis of companies has been conducted to help clients understand the wider business environment as well as the strengths and weaknesses of key industry players. Data is qualitatively analyzed to categorize companies as pure play, category-focused, industry-focused, and diversified; it is quantitatively analyzed to categorize companies as dominant, leading, strong, tentative, and weak.

Recent Development and News in Vessel Traffic Management System Market

  • In January 2024, Transas Solutions, a leading provider of maritime navigation and communication solutions, announced the launch of its new Vessel Traffic Management Information System (VTMIS), named "SmartPort," at the World Maritime Technology Conference. SmartPort is designed to enhance port security, improve traffic management, and reduce emissions by integrating real-time data from various sources (Transas Solutions press release).
  • In March 2024, Sperry Marine, a leading supplier of marine navigation and communication systems, and Maritime New Zealand signed a strategic partnership agreement to deploy Sperry Marine's Automatic Radar Plotting Aids (ARPAs) and Vessel Traffic Services (VTS) systems in New Zealand's major ports. This collaboration aims to improve port safety and efficiency (Sperry Marine press release).
  • In May 2024, KONGSBERG, a Norwegian technology company, secured a contract worth over USD 10 million from the Port of Rotterdam to deliver its Vessel Traffic Management Information System (VTMIS). The system is designed to optimize port traffic and enhance safety by integrating real-time data from multiple sources (KONGSBERG press release).
  • In April 2025, the European Maritime Safety Agency (EMSA) approved the implementation of the European Vessel Traffic Monitoring and Information Systems Regulation (VTMIS) in all EU Member States. This regulation aims to improve maritime safety and security by mandating the installation and operation of VTMIS in EU waters (EMSA press release).

Research Analyst Overview

  • The Vessel Traffic Management System (VTMS) market is experiencing significant evolution, driven by the integration of advanced technologies and increasing focus on maritime cybersecurity threats. System audits are essential to ensure compliance with safety standards and international regulations. Edge computing enables real-time data processing, while operator training is crucial for effective utilization of these systems. Sea conditions and human factors continue to pose challenges, necessitating drone surveillance and automated berthing systems. Network vulnerabilities and software vulnerabilities require robust security measures, including maritime cybersecurity threats and compliance certifications. Geographical data, cargo types, and port infrastructure are critical factors influencing VTMS market dynamics.
  • Remote diagnostics and performance dashboards facilitate efficient system upgrades and maintenance. Weather data, wave height, water depth, and environmental factors are integral to optimizing vessel performance. Data breaches and digital twin technology are shaping the future of VTMS, with 5G connectivity and IoT sensors enhancing data integration and real-time monitoring. Autonomous vessels, navigation aids, hydrographic charts, and near-miss incidents are key areas of focus for market growth. System upgrades and international regulations are addressing the challenges of maritime accidents and ensuring safety.

Dive into Technavio's robust research methodology, blending expert interviews, extensive data synthesis, and validated models for unparalleled Vessel Traffic Management System Market insights. See full methodology.

Market Scope

Report Coverage

Details

Page number

212

Base year

2024

Historic period

2019-2023

Forecast period

2025-2029

Growth momentum & CAGR

Accelerate at a CAGR of 4.8%

Market growth 2025-2029

USD 616.4 million

Market structure

Concentrated

YoY growth 2024-2025(%)

3.4

Key countries

US, China, India, Japan, Singapore, Germany, UK, UAE, South Korea, and France

Competitive landscape

Leading Companies, Market Positioning of Companies, Competitive Strategies, and Industry Risks

Request Free Sample

What are the Key Data Covered in this Vessel Traffic Management System Market Research and Growth Report?

  • CAGR of the Vessel Traffic Management System industry during the forecast period
  • Detailed information on factors that will drive the growth and forecasting between 2025 and 2029
  • Precise estimation of the size of the market and its contribution of the industry in focus to the parent market
  • Accurate predictions about upcoming growth and trends and changes in consumer behaviour
  • Growth of the market across APAC, Europe, North America, Middle East and Africa, and South America
  • Thorough analysis of the market's competitive landscape and detailed information about companies
  • Comprehensive analysis of factors that will challenge the vessel traffic management system market growth of industry companies

We can help! Our analysts can customize this vessel traffic management system market research report to meet your requirements.

Get in touch

1 Executive Summary

  • 1.1 Market overview
    • Executive Summary - Chart on Market Overview
    • Executive Summary - Data Table on Market Overview
    • Executive Summary - Chart on Global Market Characteristics
    • Executive Summary - Chart on Market by Geography
    • Executive Summary - Chart on Market Segmentation by Component
    • Executive Summary - Chart on Market Segmentation by End-user
    • Executive Summary - Chart on Incremental Growth
    • Executive Summary - Data Table on Incremental Growth
    • Executive Summary - Chart on Company Market Positioning

2 Technavio Analysis

  • 2.1 Analysis of price sensitivity, lifecycle, customer purchase basket, adoption rates, and purchase criteria
    • Analysis of price sensitivity, lifecycle, customer purchase basket, adoption rates, and purchase criteria
  • 2.2 Criticality of inputs and Factors of differentiation
    • Overview on criticality of inputs and factors of differentiation
  • 2.3 Factors of disruption
    • Overview on factors of disruption
  • 2.4 Impact of drivers and challenges
    • Impact of drivers and challenges in 2024 and 2029

3 Market Landscape

  • 3.1 Market ecosystem
    • Parent Market
    • Data Table on - Parent Market
  • 3.2 Market characteristics
    • Market characteristics analysis
  • 3.3 Value chain analysis
    • Value chain analysis

4 Market Sizing

  • 4.1 Market definition
    • Offerings of companies included in the market definition
  • 4.2 Market segment analysis
    • Market segments
  • 4.3 Market size 2024
    • 4.4 Market outlook: Forecast for 2024-2029
      • Chart on Global - Market size and forecast 2024-2029 ($ million)
      • Data Table on Global - Market size and forecast 2024-2029 ($ million)
      • Chart on Global Market: Year-over-year growth 2024-2029 (%)
      • Data Table on Global Market: Year-over-year growth 2024-2029 (%)

    5 Historic Market Size

    • 5.1 Global Vessel Traffic Management System Market 2019 - 2023
      • Historic Market Size - Data Table on Global Vessel Traffic Management System Market 2019 - 2023 ($ million)
    • 5.2 Component segment analysis 2019 - 2023
      • Historic Market Size - Component Segment 2019 - 2023 ($ million)
    • 5.3 End-user segment analysis 2019 - 2023
      • Historic Market Size - End-user Segment 2019 - 2023 ($ million)
    • 5.4 Geography segment analysis 2019 - 2023
      • Historic Market Size - Geography Segment 2019 - 2023 ($ million)
    • 5.5 Country segment analysis 2019 - 2023
      • Historic Market Size - Country Segment 2019 - 2023 ($ million)

    6 Qualitative Analysis

    • 6.1 Impact of AI on Global Vessel Traffic Management System Market

      7 Five Forces Analysis

      • 7.1 Five forces summary
        • Five forces analysis - Comparison between 2024 and 2029
      • 7.2 Bargaining power of buyers
        • Bargaining power of buyers - Impact of key factors 2024 and 2029
      • 7.3 Bargaining power of suppliers
        • Bargaining power of suppliers - Impact of key factors in 2024 and 2029
      • 7.4 Threat of new entrants
        • Threat of new entrants - Impact of key factors in 2024 and 2029
      • 7.5 Threat of substitutes
        • Threat of substitutes - Impact of key factors in 2024 and 2029
      • 7.6 Threat of rivalry
        • Threat of rivalry - Impact of key factors in 2024 and 2029
      • 7.7 Market condition
        • Chart on Market condition - Five forces 2024 and 2029

      8 Market Segmentation by Component

      • 8.1 Market segments
        • Chart on Component - Market share 2024-2029 (%)
        • Data Table on Component - Market share 2024-2029 (%)
      • 8.2 Comparison by Component
        • Chart on Comparison by Component
        • Data Table on Comparison by Component
      • 8.3 Hardware - Market size and forecast 2024-2029
        • Chart on Hardware - Market size and forecast 2024-2029 ($ million)
        • Data Table on Hardware - Market size and forecast 2024-2029 ($ million)
        • Chart on Hardware - Year-over-year growth 2024-2029 (%)
        • Data Table on Hardware - Year-over-year growth 2024-2029 (%)
      • 8.4 Software - Market size and forecast 2024-2029
        • Chart on Software - Market size and forecast 2024-2029 ($ million)
        • Data Table on Software - Market size and forecast 2024-2029 ($ million)
        • Chart on Software - Year-over-year growth 2024-2029 (%)
        • Data Table on Software - Year-over-year growth 2024-2029 (%)
      • 8.5 Services - Market size and forecast 2024-2029
        • Chart on Services - Market size and forecast 2024-2029 ($ million)
        • Data Table on Services - Market size and forecast 2024-2029 ($ million)
        • Chart on Services - Year-over-year growth 2024-2029 (%)
        • Data Table on Services - Year-over-year growth 2024-2029 (%)
      • 8.6 Market opportunity by Component
        • Market opportunity by Component ($ million)
        • Data Table on Market opportunity by Component ($ million)

      9 Market Segmentation by End-user

      • 9.1 Market segments
        • Chart on End-user - Market share 2024-2029 (%)
        • Data Table on End-user - Market share 2024-2029 (%)
      • 9.2 Comparison by End-user
        • Chart on Comparison by End-user
        • Data Table on Comparison by End-user
      • 9.3 Commercial - Market size and forecast 2024-2029
        • Chart on Commercial - Market size and forecast 2024-2029 ($ million)
        • Data Table on Commercial - Market size and forecast 2024-2029 ($ million)
        • Chart on Commercial - Year-over-year growth 2024-2029 (%)
        • Data Table on Commercial - Year-over-year growth 2024-2029 (%)
      • 9.4 Military - Market size and forecast 2024-2029
        • Chart on Military - Market size and forecast 2024-2029 ($ million)
        • Data Table on Military - Market size and forecast 2024-2029 ($ million)
        • Chart on Military - Year-over-year growth 2024-2029 (%)
        • Data Table on Military - Year-over-year growth 2024-2029 (%)
      • 9.5 Market opportunity by End-user
        • Market opportunity by End-user ($ million)
        • Data Table on Market opportunity by End-user ($ million)

      10 Customer Landscape

      • 10.1 Customer landscape overview
        • Analysis of price sensitivity, lifecycle, customer purchase basket, adoption rates, and purchase criteria

      11 Geographic Landscape

      • 11.1 Geographic segmentation
        • Chart on Market share by geography 2024-2029 (%)
        • Data Table on Market share by geography 2024-2029 (%)
      • 11.2 Geographic comparison
        • Chart on Geographic comparison
        • Data Table on Geographic comparison
      • 11.3 APAC - Market size and forecast 2024-2029
        • Chart on APAC - Market size and forecast 2024-2029 ($ million)
        • Data Table on APAC - Market size and forecast 2024-2029 ($ million)
        • Chart on APAC - Year-over-year growth 2024-2029 (%)
        • Data Table on APAC - Year-over-year growth 2024-2029 (%)
      • 11.4 Europe - Market size and forecast 2024-2029
        • Chart on Europe - Market size and forecast 2024-2029 ($ million)
        • Data Table on Europe - Market size and forecast 2024-2029 ($ million)
        • Chart on Europe - Year-over-year growth 2024-2029 (%)
        • Data Table on Europe - Year-over-year growth 2024-2029 (%)
      • 11.5 North America - Market size and forecast 2024-2029
        • Chart on North America - Market size and forecast 2024-2029 ($ million)
        • Data Table on North America - Market size and forecast 2024-2029 ($ million)
        • Chart on North America - Year-over-year growth 2024-2029 (%)
        • Data Table on North America - Year-over-year growth 2024-2029 (%)
      • 11.6 Middle East and Africa - Market size and forecast 2024-2029
        • Chart on Middle East and Africa - Market size and forecast 2024-2029 ($ million)
        • Data Table on Middle East and Africa - Market size and forecast 2024-2029 ($ million)
        • Chart on Middle East and Africa - Year-over-year growth 2024-2029 (%)
        • Data Table on Middle East and Africa - Year-over-year growth 2024-2029 (%)
      • 11.7 South America - Market size and forecast 2024-2029
        • Chart on South America - Market size and forecast 2024-2029 ($ million)
        • Data Table on South America - Market size and forecast 2024-2029 ($ million)
        • Chart on South America - Year-over-year growth 2024-2029 (%)
        • Data Table on South America - Year-over-year growth 2024-2029 (%)
      • 11.8 US - Market size and forecast 2024-2029
        • Chart on US - Market size and forecast 2024-2029 ($ million)
        • Data Table on US - Market size and forecast 2024-2029 ($ million)
        • Chart on US - Year-over-year growth 2024-2029 (%)
        • Data Table on US - Year-over-year growth 2024-2029 (%)
      • 11.9 China - Market size and forecast 2024-2029
        • Chart on China - Market size and forecast 2024-2029 ($ million)
        • Data Table on China - Market size and forecast 2024-2029 ($ million)
        • Chart on China - Year-over-year growth 2024-2029 (%)
        • Data Table on China - Year-over-year growth 2024-2029 (%)
      • 11.10 India - Market size and forecast 2024-2029
        • Chart on India - Market size and forecast 2024-2029 ($ million)
        • Data Table on India - Market size and forecast 2024-2029 ($ million)
        • Chart on India - Year-over-year growth 2024-2029 (%)
        • Data Table on India - Year-over-year growth 2024-2029 (%)
      • 11.11 Japan - Market size and forecast 2024-2029
        • Chart on Japan - Market size and forecast 2024-2029 ($ million)
        • Data Table on Japan - Market size and forecast 2024-2029 ($ million)
        • Chart on Japan - Year-over-year growth 2024-2029 (%)
        • Data Table on Japan - Year-over-year growth 2024-2029 (%)
      • 11.12 Singapore - Market size and forecast 2024-2029
        • Chart on Singapore - Market size and forecast 2024-2029 ($ million)
        • Data Table on Singapore - Market size and forecast 2024-2029 ($ million)
        • Chart on Singapore - Year-over-year growth 2024-2029 (%)
        • Data Table on Singapore - Year-over-year growth 2024-2029 (%)
      • 11.13 Germany - Market size and forecast 2024-2029
        • Chart on Germany - Market size and forecast 2024-2029 ($ million)
        • Data Table on Germany - Market size and forecast 2024-2029 ($ million)
        • Chart on Germany - Year-over-year growth 2024-2029 (%)
        • Data Table on Germany - Year-over-year growth 2024-2029 (%)
      • 11.14 UK - Market size and forecast 2024-2029
        • Chart on UK - Market size and forecast 2024-2029 ($ million)
        • Data Table on UK - Market size and forecast 2024-2029 ($ million)
        • Chart on UK - Year-over-year growth 2024-2029 (%)
        • Data Table on UK - Year-over-year growth 2024-2029 (%)
      • 11.15 UAE - Market size and forecast 2024-2029
        • Chart on UAE - Market size and forecast 2024-2029 ($ million)
        • Data Table on UAE - Market size and forecast 2024-2029 ($ million)
        • Chart on UAE - Year-over-year growth 2024-2029 (%)
        • Data Table on UAE - Year-over-year growth 2024-2029 (%)
      • 11.16 South Korea - Market size and forecast 2024-2029
        • Chart on South Korea - Market size and forecast 2024-2029 ($ million)
        • Data Table on South Korea - Market size and forecast 2024-2029 ($ million)
        • Chart on South Korea - Year-over-year growth 2024-2029 (%)
        • Data Table on South Korea - Year-over-year growth 2024-2029 (%)
      • 11.17 France - Market size and forecast 2024-2029
        • Chart on France - Market size and forecast 2024-2029 ($ million)
        • Data Table on France - Market size and forecast 2024-2029 ($ million)
        • Chart on France - Year-over-year growth 2024-2029 (%)
        • Data Table on France - Year-over-year growth 2024-2029 (%)
      • 11.18 Market opportunity by geography
        • Market opportunity by geography ($ million)
        • Data Tables on Market opportunity by geography ($ million)

      12 Drivers, Challenges, and Opportunity/Restraints

      • 12.1 Market drivers
        • 12.2 Market challenges
          • 12.3 Impact of drivers and challenges
            • Impact of drivers and challenges in 2024 and 2029
          • 12.4 Market opportunities/restraints

            13 Competitive Landscape

            • 13.1 Overview
              • 13.2 Competitive Landscape
                • Overview on criticality of inputs and factors of differentiation
              • 13.3 Landscape disruption
                • Overview on factors of disruption
              • 13.4 Industry risks
                • Impact of key risks on business

              14 Competitive Analysis

              • 14.1 Companies profiled
                • Companies covered
              • 14.2 Company ranking index
                • Company ranking index
              • 14.3 Market positioning of companies
                • Matrix on companies position and classification
              • 14.4 Frequentis AG
                • Frequentis AG - Overview
                • Frequentis AG - Business segments
                • Frequentis AG - Key offerings
                • Frequentis AG - Segment focus
                • SWOT
              • 14.5 Indra Sistemas SA
                • Indra Sistemas SA - Overview
                • Indra Sistemas SA - Business segments
                • Indra Sistemas SA - Key news
                • Indra Sistemas SA - Key offerings
                • Indra Sistemas SA - Segment focus
                • SWOT
              • 14.6 Japan Radio Co. Ltd.
                • Japan Radio Co. Ltd. - Overview
                • Japan Radio Co. Ltd. - Product / Service
                • Japan Radio Co. Ltd. - Key offerings
                • SWOT
              • 14.7 Kongsberg Gruppen ASA
                • Kongsberg Gruppen ASA - Overview
                • Kongsberg Gruppen ASA - Business segments
                • Kongsberg Gruppen ASA - Key news
                • Kongsberg Gruppen ASA - Key offerings
                • Kongsberg Gruppen ASA - Segment focus
                • SWOT
              • 14.8 L3Harris Technologies Inc.
                • L3Harris Technologies Inc. - Overview
                • L3Harris Technologies Inc. - Business segments
                • L3Harris Technologies Inc. - Key news
                • L3Harris Technologies Inc. - Key offerings
                • L3Harris Technologies Inc. - Segment focus
                • SWOT
              • 14.9 Leonardo Spa
                • Leonardo Spa - Overview
                • Leonardo Spa - Business segments
                • Leonardo Spa - Key news
                • Leonardo Spa - Key offerings
                • Leonardo Spa - Segment focus
                • SWOT
              • 14.10 Northrop Grumman Corp.
                • Northrop Grumman Corp. - Overview
                • Northrop Grumman Corp. - Business segments
                • Northrop Grumman Corp. - Key news
                • Northrop Grumman Corp. - Key offerings
                • Northrop Grumman Corp. - Segment focus
                • SWOT
              • 14.11 Rolls Royce Holdings Plc
                • Rolls Royce Holdings Plc - Overview
                • Rolls Royce Holdings Plc - Business segments
                • Rolls Royce Holdings Plc - Key offerings
                • Rolls Royce Holdings Plc - Segment focus
                • SWOT
              • 14.12 Rolta India Ltd.
                • Rolta India Ltd. - Overview
                • Rolta India Ltd. - Product / Service
                • Rolta India Ltd. - Key offerings
                • SWOT
              • 14.13 Saab AB
                • Saab AB - Overview
                • Saab AB - Business segments
                • Saab AB - Key news
                • Saab AB - Key offerings
                • Saab AB - Segment focus
                • SWOT
              • 14.14 Singapore Technologies Engineering Ltd.
                • Singapore Technologies Engineering Ltd. - Overview
                • Singapore Technologies Engineering Ltd. - Business segments
                • Singapore Technologies Engineering Ltd. - Key news
                • Singapore Technologies Engineering Ltd. - Key offerings
                • Singapore Technologies Engineering Ltd. - Segment focus
                • SWOT
              • 14.15 SRT Marine Systems Plc
                • SRT Marine Systems Plc - Overview
                • SRT Marine Systems Plc - Product / Service
                • SRT Marine Systems Plc - Key offerings
                • SWOT
              • 14.16 Thales Group
                • Thales Group - Overview
                • Thales Group - Business segments
                • Thales Group - Key news
                • Thales Group - Key offerings
                • Thales Group - Segment focus
                • SWOT
              • 14.17 Tokyo Keiki Inc.
                • Tokyo Keiki Inc. - Overview
                • Tokyo Keiki Inc. - Product / Service
                • Tokyo Keiki Inc. - Key offerings
                • SWOT
              • 14.18 Wartsila Corp.
                • Wartsila Corp. - Overview
                • Wartsila Corp. - Business segments
                • Wartsila Corp. - Key news
                • Wartsila Corp. - Key offerings
                • Wartsila Corp. - Segment focus
                • SWOT

              15 Appendix

              • 15.1 Scope of the report
                • 15.2 Inclusions and exclusions checklist
                  • Inclusions checklist
                  • Exclusions checklist
                • 15.3 Currency conversion rates for US$
                  • Currency conversion rates for US$
                • 15.4 Research methodology
                  • Research methodology
                • 15.5 Data procurement
                  • Information sources
                • 15.6 Data validation
                  • Data validation
                • 15.7 Validation techniques employed for market sizing
                  • Validation techniques employed for market sizing
                • 15.8 Data synthesis
                  • Data synthesis
                • 15.9 360 degree market analysis
                  • 360 degree market analysis
                • 15.10 List of abbreviations
                  • List of abbreviations

                Research Methodology

                Technavio presents a detailed picture of the market by way of study, synthesis, and summation of data from multiple sources. The analysts have presented the various facets of the market with a particular focus on identifying the key industry influencers. The data thus presented is comprehensive, reliable, and the result of extensive research, both primary and secondary.

                INFORMATION SOURCES

                Primary sources

                • Manufacturers and suppliers
                • Channel partners
                • Industry experts
                • Strategic decision makers

                Secondary sources

                • Industry journals and periodicals
                • Government data
                • Financial reports of key industry players
                • Historical data
                • Press releases

                DATA ANALYSIS

                Data Synthesis

                • Collation of data
                • Estimation of key figures
                • Analysis of derived insights

                Data Validation

                • Triangulation with data models
                • Reference against proprietary databases
                • Corroboration with industry experts

                REPORT WRITING

                Qualitative

                • Market drivers
                • Market challenges
                • Market trends
                • Five forces analysis

                Quantitative

                • Market size and forecast
                • Market segmentation
                • Geographical insights
                • Competitive landscape

                Interested in this report?

                Get your sample now to see our research methodology and insights!

                Download Now

                Frequently Asked Questions

                Vessel Traffic Management System market growth will increase by $ 616.4 mn during 2025-2029 .

                The Vessel Traffic Management System market is expected to grow at a CAGR of 4.8% during 2025-2029 .

                Vessel Traffic Management System market is segmented by Component( Hardware, Software, Services) End-user( Commercial, Military, North America, Middle East and Africa, South America)

                ARS T and TT, Frequentis AG, Indra Sistemas SA, Israel Aerospace Industries Ltd., Japan Radio Co. Ltd., Kongsberg Gruppen ASA, L3Harris Technologies Inc., Leonardo Spa, Mesemar, Northrop Grumman Corp., Rolls Royce Holdings Plc, Rolta India Ltd., Saab AB, Singapore Technologies Engineering Ltd., SRT Marine Systems Plc, Technolution BV, Terma AS, Thales Group, Tidalis, Tokyo Keiki Inc., Wartsila Corp. are a few of the key vendors in the Vessel Traffic Management System market.

                APAC will register the highest growth rate of 53% among the other regions. Therefore, the Vessel Traffic Management System market in APAC is expected to garner significant business opportunities for the vendors during the forecast period.

                US, China, India, Japan, Singapore, Germany, UK, UAE, South Korea, France

                • Rising volume of maritime tradeThe global vessel traffic management system market is significantly driven by the rising volume of maritime trade. In 2023 is the driving factor this market.
                • global maritime trade experienced a notable recovery is the driving factor this market.
                • growing by 2.4% to reach 12.3 billion tons is the driving factor this market.
                • rebounding from the contraction observed in 2022. This resurgence underscores the critical role of maritime transport in global trade and the increasing need for efficient traffic management systems to handle the growing volume of goods transported by sea.The sector is projected to continue its upward trajectory is the driving factor this market.
                • with an anticipated growth rate of 2% in 2024 and an average annual growth rate of 2.4% through 2029. This sustained growth in maritime trade is expected to drive the demand for advanced VTMS solutions is the driving factor this market.
                • as ports and shipping companies seek to optimize their operations is the driving factor this market.
                • enhance safety is the driving factor this market.
                • and improve the efficiency of vessel movements.As global trade volumes increase is the driving factor this market.
                • the complexity of managing maritime traffic also rises. Ports are handling larger vessels and higher traffic densities is the driving factor this market.
                • necessitating the adoption of sophisticated VTMS technologies to ensure smooth and safe navigation. These systems provide real-time monitoring is the driving factor this market.
                • vessel tracking is the driving factor this market.
                • and traffic management capabilities is the driving factor this market.
                • enabling port authorities to manage the flow of vessels more effectively and reduce the risk of accidents and congestion.Moreover is the driving factor this market.
                • the expansion of global trade routes and the development of new shipping lanes further highlight the importance of VTMS in maintaining efficient maritime operations. As new ports and terminals are established to accommodate the growing trade volumes is the driving factor this market.
                • the implementation of advanced VTMS solutions becomes essential to support the seamless movement of vessels and ensure the safety of maritime operations.As ports and shipping companies strive to enhance their operational efficiency and safety is the driving factor this market.
                • the demand for sophisticated VTMS solutions is expected to rise is the driving factor this market.
                • supporting the ongoing development and expansion of the global maritime industry. is the driving factor this market.

                The Vessel Traffic Management System market vendors should focus on grabbing business opportunities from the Hardware segment as it accounted for the largest market share in the base year.