Veterinary Chemistry Analyzers Market Analysis, Size, and Forecast 2025-2029: North America (US, Canada, and Mexico), Europe (Germany, UK, and France), APAC (China, India, and Japan), South America (Brazil, Argentina, and Colombia), Middle East and Africa (Saudi Arabia, UAE, and Turkey), Asia, Rest of World (ROW)

Veterinary Chemistry Analyzers Market Analysis, Size, and Forecast 2025-2029:
North America (US, Canada, and Mexico), Europe (Germany, UK, and France), APAC (China, India, and Japan), South America (Brazil, Argentina, and Colombia), Middle East and Africa (Saudi Arabia, UAE, and Turkey), Asia, Rest of World (ROW)

Published: Dec 2025 288 Pages SKU: IRTNTR73139

Market Overview at a Glance

$442.7 Mn
Market Opportunity
6.5%
CAGR 2024 - 2029
39.1%
North America Growth
$633.3 Mn
Instruments segment 2023

Veterinary Chemistry Analyzers Market Size 2025-2029

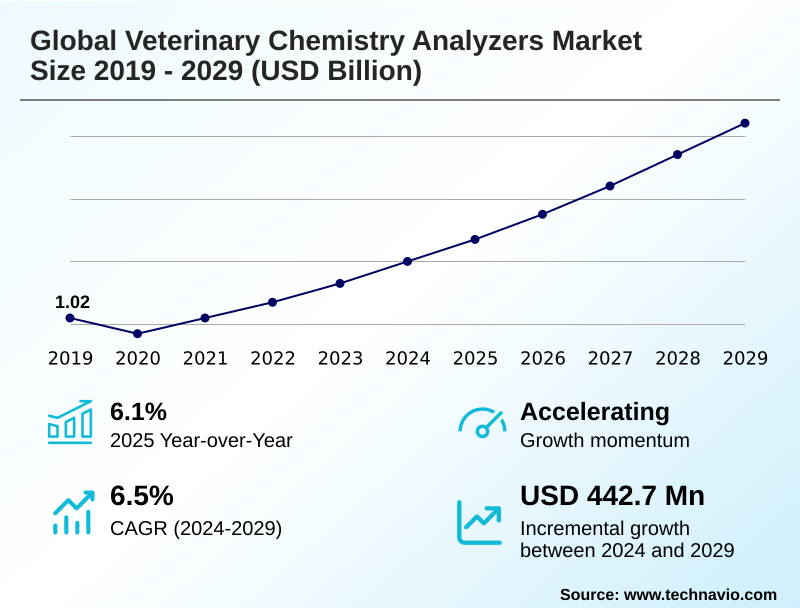
The veterinary chemistry analyzers market size is valued to increase by USD 442.7 million, at a CAGR of 6.5% from 2024 to 2029. Ascendancy of companion animal ownership and humanization trend will drive the veterinary chemistry analyzers market.

Major Market Trends & Insights

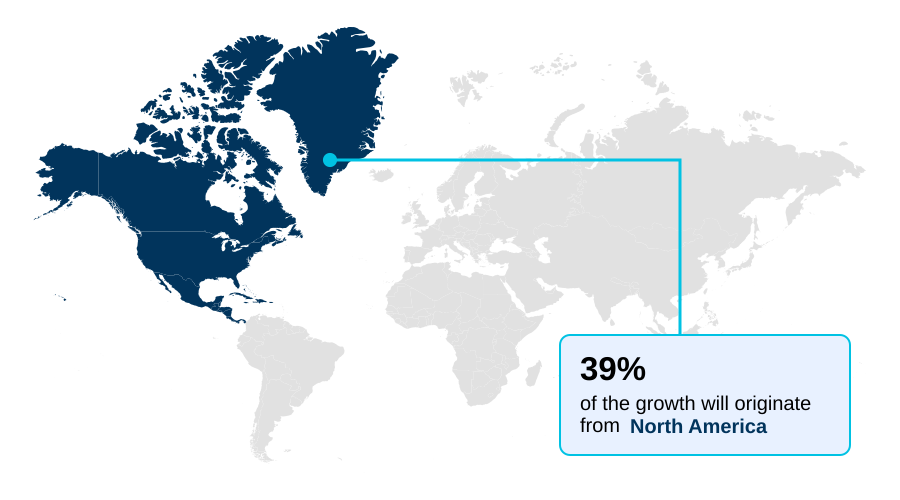
  • North America dominated the market and accounted for a 39.1% growth during the forecast period.
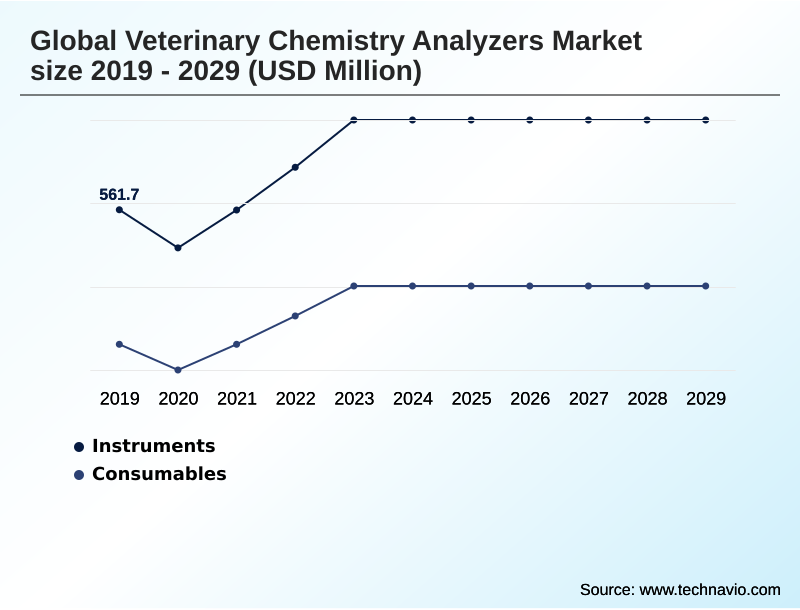
  • By Product - Instruments segment was valued at USD 633.3 million in 2023
  • By Type - Benchtop analyzers segment accounted for the largest market revenue share in 2023

Market Size & Forecast

  • Market Opportunities: USD 627.8 million
  • Market Future Opportunities: USD 442.7 million
  • CAGR from 2024 to 2029 : 6.5%

Market Summary

  • The veterinary chemistry analyzers market is defined by its role in advancing animal healthcare through sophisticated in-vitro diagnostic instruments. These systems perform automated biochemical analysis on samples, providing critical data for disease detection, management, and preventive care in both companion and production animals.
  • Key drivers include the humanization of pets, which elevates owner expectations for care standards, and the economic necessity of herd health management in livestock industries. A primary trend is the dual development of compact point-of-care testing (POCT) devices for in-clinic use and high-throughput automation in central reference labs.
  • For instance, a small animal clinic can leverage a benchtop chemistry analyzer to perform immediate pre-anesthetic screening, significantly improving patient safety and operational workflow efficiency without delaying surgical procedures. However, the high capital investment and recurring reagent costs associated with closed-system platforms present a persistent challenge, influencing purchasing decisions and market penetration, especially within smaller, independent practices.
  • Technological innovation focuses on enhancing the diagnostic test menu, improving user-friendliness, and enabling better data integration with practice management software.

What will be the Size of the Veterinary Chemistry Analyzers Market during the forecast period?

Get Key Insights on Market Forecast (PDF) Request Free Sample

How is the Veterinary Chemistry Analyzers Market Segmented?

The veterinary chemistry analyzers industry research report provides comprehensive data (region-wise segment analysis), with forecasts and estimates in "USD million" for the period 2025-2029, as well as historical data from 2019-2023 for the following segments.

  • Product
    • Instruments
    • Consumables
  • Type
    • Benchtop analyzers
    • Automated analyzers
    • Portable analyzers
  • Application
    • Blood chemistry analysis
    • Electrolyte and gas analysis
    • Urinalysis
  • Geography
    • North America
      • US
      • Canada
      • Mexico
    • Europe
      • Germany
      • UK
      • France
    • Asia
    • Rest of World (ROW)

By Product Insights

The instruments segment is estimated to witness significant growth during the forecast period.

The instruments segment represents the market's foundational capital investment, with physical analyzers defining a clinic's diagnostic capacity and operational efficiency. Continuous innovation in photometry analysis, ion-selective potentiometry, and microfluidics technology fuels regular upgrade cycles.

These systems provide critical clinical pathology data and are essential for veterinary immunoassay applications and comprehensive test result validation. Advanced hardware using rotor-based analysis is designed for high efficiency, with integrated systems reducing administrative errors by up to 25%.

This core hardware supports a wide range of applications, from veterinary hematology integration and specialized endocrinology testing panels to exotic animal diagnostics, ensuring its indispensable role.

The use of precise calibrator solutions for large animal veterinary services further underpins their market value.

Request Free Sample

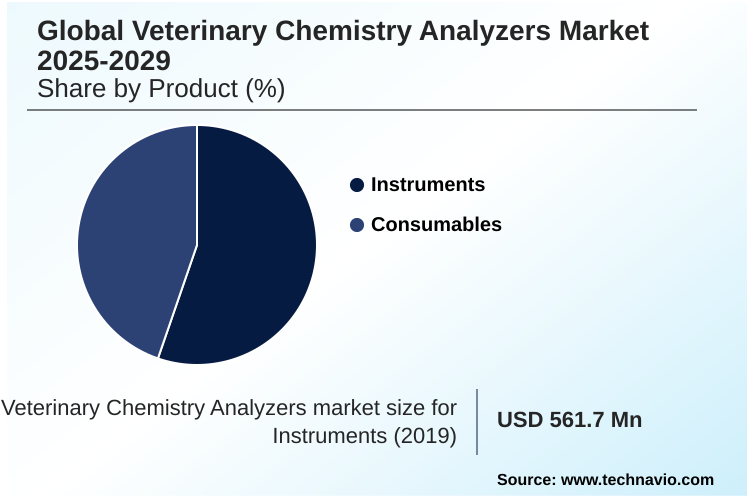
The Instruments segment was valued at USD 633.3 million in 2023 and showed a gradual increase during the forecast period.

Request Free Sample

Regional Analysis

North America is estimated to contribute 39.1% to the growth of the global market during the forecast period.Technavio’s analysts have elaborately explained the regional trends and drivers that shape the market during the forecast period.

See How Veterinary Chemistry Analyzers Market Demand is Rising in North America Request Free Sample

The geographic landscape is led by North America, which has a mature in-house laboratory setup focused on automated clinical chemistry to ensure high veterinary diagnostic accuracy.

This region's reliance on in-vitro diagnostic instruments for routine biochemical analysis makes it the largest market segment. In contrast, Asia is the fastest-growing region, with expanding livestock disease surveillance and herd health management programs driving demand.

The adoption of instruments utilizing dry-slide technology, which have lower sample volume requirements for animal serum testing, plasma sample analysis, and urine sample analysis, is increasing in emerging markets.

Across all regions, adherence to validated quality control (QC) materials and species-specific veterinary reference intervals is becoming standard, with modern systems reducing test processing times by over 40%.

Market Dynamics

Our researchers analyzed the data with 2024 as the base year, along with the key drivers, trends, and challenges. A holistic analysis of drivers will help companies refine their marketing strategies to gain a competitive advantage.

  • Strategic decisions within the veterinary chemistry analyzers market are increasingly complex, balancing technology, cost, and clinical utility. The debate over benchtop vs portable veterinary analyzers often centers on the specific needs of a practice, whether for in-clinic blood testing for dogs and cats or for mobile field diagnostics.
  • The total cost of ownership calculation is paramount, as veterinary chemistry analyzer reagent costs for high-throughput systems for reference labs can be substantial. Clinics must evaluate the long-term expense of proprietary consumables against the efficiency gains from urinalysis automation in veterinary medicine and the accuracy of point-of-care chemistry analyzers.
  • The integration of analyzers with veterinary software is now a critical purchasing criterion, as it is key to improving turnaround time with in-house diagnostics and streamlining workflows for managing chronic kidney disease in pets or performing routine liver function tests for companion animals. The choice between dry-slide vs wet chemistry analyzers also impacts operational costs and maintenance schedules.
  • For specialized applications, such as biochemical profiling for equine health or electrolyte analysis for critical care, the availability of specific test panels on a platform is non-negotiable.
  • Practices utilizing microfluidic analyzers for veterinary use often report higher client satisfaction due to faster results, with some showing client compliance rates for follow-up care that are 50% higher than clinics relying solely on external labs.

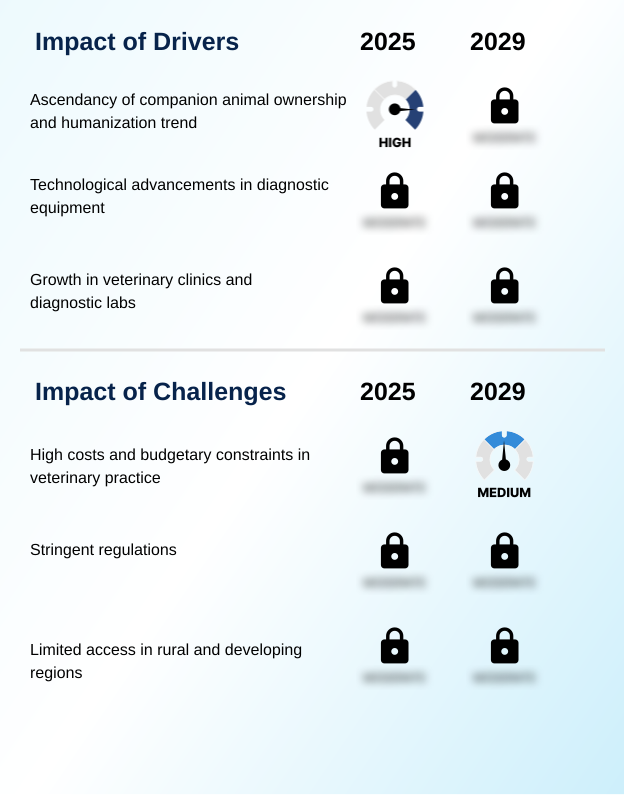
What are the key market drivers leading to the rise in the adoption of Veterinary Chemistry Analyzers Industry?

  • The sustained growth in companion animal ownership, coupled with the increasing humanization of pets, serves as the primary driver for demand in advanced veterinary diagnostics.

  • The primary market driver is the rise of companion animal diagnostics, fueled by an emphasis on preventive care screening and sophisticated chronic disease monitoring.
  • This creates demand for instruments with a broad diagnostic test menu, including species-specific assays and panels for pre-anesthetic screening. This trend justifies the capital equipment investment in systems capable of precise enzyme measurement, metabolite measurement, and hormone measurement.
  • For example, the availability of specific renal function markers and hepatic function tests improves clinical decision support, with practices using these panels reporting a 20% increase in early-stage disease detection.
  • The ability to perform multi-parameter testing in a single run enhances efficiency, making advanced diagnostics a standard component of modern veterinary care.

What are the market trends shaping the Veterinary Chemistry Analyzers Industry?

  • A defining market trend is the proliferation of point-of-care testing solutions for immediate in-clinic diagnostics, which coexists with the ongoing consolidation of high-volume, complex testing within large reference laboratories.

  • Market trends are defined by a dual movement toward decentralized point-of-care testing (POCT) and centralized high-throughput automation. The proliferation of in-clinic diagnostic solutions, including compact portable chemistry analyzer and benchtop chemistry analyzer models, is shortening test result turnaround time to under 15 minutes in many cases.
  • This shift optimizes the veterinary diagnostics workflow for small animal clinic diagnostics and large animal veterinary services alike, providing real-time test results through a user-friendly interface. Simultaneously, reference laboratory integration is becoming more seamless, with data flowing directly into practice management software (PIMS).
  • This hybrid model allows clinics to balance immediate diagnostic needs with the comprehensive testing capabilities of large, automated labs, which report over 99% consistency in results.

What challenges does the Veterinary Chemistry Analyzers Industry face during its growth?

  • High initial acquisition costs and ongoing operational expenses for diagnostic systems pose a significant financial challenge for many veterinary practices, limiting technology adoption.

  • Financial considerations represent a significant challenge, with the total cost of ownership (TCO) of a closed-system platform being a primary barrier. High diagnostic reagent pricing and instrument maintenance contracts strain budgets. The capital equipment investment in a semi-automated analyzer using proprietary reagent disk technology or liquid reagent systems is substantial.
  • To mitigate this, reagent rental models are emerging, improving clinic cash flow by over 30%. The need for quality control (QC) materials and calibrator solutions adds to expenses. Technology choices are complex, weighing the benefits of biosensor technology or reflectometer photometry against the costs of future molecular diagnostics integration or a full diagnostic workstation integration.

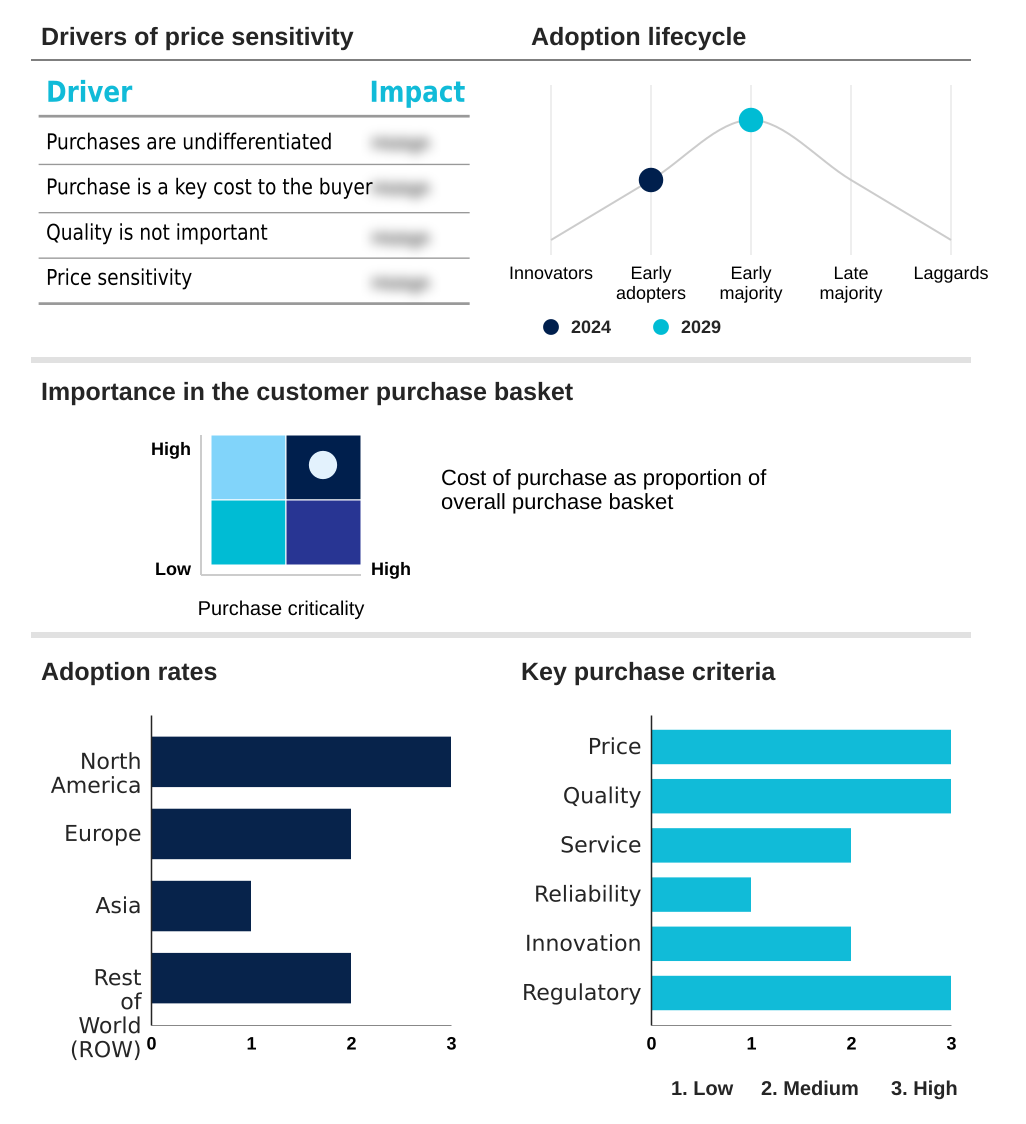
Exclusive Technavio Analysis on Customer Landscape

The veterinary chemistry analyzers market forecasting report includes the adoption lifecycle of the market, covering from the innovator’s stage to the laggard’s stage. It focuses on adoption rates in different regions based on penetration. Furthermore, the veterinary chemistry analyzers market report also includes key purchase criteria and drivers of price sensitivity to help companies evaluate and develop their market growth analysis strategies.

Customer Landscape of Veterinary Chemistry Analyzers Industry

Competitive Landscape

Companies are implementing various strategies, such as strategic alliances, veterinary chemistry analyzers market forecast, partnerships, mergers and acquisitions, geographical expansion, and product/service launches, to enhance their presence in the industry.

Abbott Laboratories - Key offerings include advanced handheld systems providing rapid, quantitative in-clinic diagnostics to enable immediate point-of-care clinical decisions.

The industry research and growth report includes detailed analyses of the competitive landscape of the market and information about key companies, including:

  • Abbott Laboratories
  • Antech Diagnostics, Inc.
  • Arkray USA Inc.
  • Chengdu Seamaty Technology
  • DiaSys Diagnostic Systems
  • Diconex SA
  • ELITechGroup SAS
  • Eurolyser Diagnostics GmbH
  • HORIBA Ltd.
  • IDEXX Laboratories Inc.
  • Labomed Inc.
  • Neogen Corp.
  • NeoMedica
  • Randox Laboratories Ltd.
  • Scil Animal Care Co. GmbH
  • Skyla Corp.
  • Tianjin LOCMEDT Technologies
  • Ushio Inc.
  • Zoetis Inc.

Qualitative and quantitative analysis of companies has been conducted to help clients understand the wider business environment as well as the strengths and weaknesses of key industry players. Data is qualitatively analyzed to categorize companies as pure play, category-focused, industry-focused, and diversified; it is quantitatively analyzed to categorize companies as dominant, leading, strong, tentative, and weak.

Recent Development and News in Veterinary chemistry analyzers market

  • In September 2024, Zoetis Inc. launched Vetscan OptiCell, a new platform designed to transform veterinary diagnostics with an integrated suite of products and services.
  • In November 2024, Abbott Laboratories announced a strategic partnership with a leading practice management software provider to embed its i-STAT handheld system data directly into veterinary clinic workflows.
  • In January 2025, IDEXX Laboratories Inc. acquired a specialized European diagnostics company, expanding its portfolio with novel immunoassay technologies and strengthening its market presence in the region.
  • In April 2025, Randox Laboratories Ltd. received regulatory clearance for a new biochip array focused on equine metabolic syndromes, offering a comprehensive diagnostic panel for horse-specific conditions.

Dive into Technavio’s robust research methodology, blending expert interviews, extensive data synthesis, and validated models for unparalleled Veterinary Chemistry Analyzers Market insights. See full methodology.

Market Scope
Page number 288
Base year 2024
Historic period 2019-2023
Forecast period 2025-2029
Growth momentum & CAGR Accelerate at a CAGR of 6.5%
Market growth 2025-2029 USD 442.7 million
Market structure Fragmented
YoY growth 2024-2025(%) 6.1%
Key countries US, Canada, Mexico, Germany, UK, France, Italy, Spain, The Netherlands, China, India, Japan, South Korea, Indonesia, Thailand, Brazil, Saudi Arabia, UAE, Turkey, Argentina, Colombia, South Africa and Israel
Competitive landscape Leading Companies, Market Positioning of Companies, Competitive Strategies, and Industry Risks

Request Free Sample

Research Analyst Overview

  • The market's evolution is driven by increasingly sophisticated in-vitro diagnostic instruments. Boardroom decisions now weigh capital investment in a benchtop chemistry analyzer with high-throughput automation against the flexibility of a portable chemistry analyzer for point-of-care testing (POCT). The core technology, from photometry analysis and ion-selective potentiometry to advanced biosensor technology and microfluidics technology, is advancing rapidly.
  • A key differentiator is the breadth of the diagnostic test menu, which must include species-specific assays and robust veterinary immunoassay capabilities for pre-anesthetic screening. Systems using dry-slide technology compete with those using liquid reagent systems or reagent disk technology. The goal is to deliver real-time test results for everything from enzyme measurement, electrolyte measurement, and metabolite measurement to hormone measurement.
  • This is achieved via rotor-based analysis and reflectometer photometry on both semi-automated analyzer and automated clinical chemistry platforms. The seamless diagnostic workstation integration of clinical pathology data from animal serum testing, plasma sample analysis, and urine sample analysis is critical.
  • Leading systems offer multi-parameter testing and aim for molecular diagnostics integration within a user-friendly interface, moving beyond the constraints of a simple closed-system platform to provide comprehensive biochemical analysis.

What are the Key Data Covered in this Veterinary Chemistry Analyzers Market Research and Growth Report?

  • What is the expected growth of the Veterinary Chemistry Analyzers Market between 2025 and 2029?

    • USD 442.7 million, at a CAGR of 6.5%

  • What segmentation does the market report cover?

    • The report is segmented by Product (Instruments, and Consumables), Type (Benchtop analyzers, Automated analyzers, and Portable analyzers), Application (Blood chemistry analysis, Electrolyte and gas analysis, and Urinalysis) and Geography (North America, Europe, Asia, Rest of World (ROW))

  • Which regions are analyzed in the report?

    • North America, Europe, Asia and Rest of World (ROW)

  • What are the key growth drivers and market challenges?

    • Ascendancy of companion animal ownership and humanization trend, High costs and budgetary constraints in veterinary practice

  • Who are the major players in the Veterinary Chemistry Analyzers Market?

    • Abbott Laboratories, Antech Diagnostics, Inc., Arkray USA Inc., Chengdu Seamaty Technology, DiaSys Diagnostic Systems, Diconex SA, ELITechGroup SAS, Eurolyser Diagnostics GmbH, HORIBA Ltd., IDEXX Laboratories Inc., Labomed Inc., Neogen Corp., NeoMedica, Randox Laboratories Ltd., Scil Animal Care Co. GmbH, Skyla Corp., Tianjin LOCMEDT Technologies, Ushio Inc. and Zoetis Inc.

Market Research Insights

  • Market dynamics are shaped by the dual pursuit of immediate clinical decision support and comprehensive, cost-effective analytics. This has led to high adoption rates for in-clinic diagnostic solutions, with many practices reporting a 25% faster test result turnaround time compared to external labs.
  • The emphasis on chronic disease monitoring and preventive care screening is driving investment in systems that enhance veterinary diagnostic accuracy. Strategic decisions are influenced by total cost of ownership (TCO) calculations, as recurring diagnostic reagent pricing can exceed initial capital equipment investment.
  • Consequently, flexible reagent rental models are gaining traction, improving cash flow for small animal clinic diagnostics by up to 30%. The integration with practice management software (PIMS) remains a critical factor, directly impacting veterinary diagnostics workflow and data management.

We can help! Our analysts can customize this veterinary chemistry analyzers market research report to meet your requirements.

Get in touch

1. Executive Summary

1.1 Market overview

Executive Summary - Chart on Market Overview
Executive Summary - Data Table on Market Overview
Executive Summary - Chart on Global Market Characteristics
Executive Summary - Chart on Market by Geography
Executive Summary - Chart on Market Segmentation by Product
Executive Summary - Chart on Market Segmentation by Type
Executive Summary - Chart on Market Segmentation by Application
Executive Summary - Chart on Incremental Growth
Executive Summary - Data Table on Incremental Growth
Executive Summary - Chart on Company Market Positioning

2. Technavio Analysis

2.1 Analysis of price sensitivity, lifecycle, customer purchase basket, adoption rates, and purchase criteria

2.2 Criticality of inputs and Factors of differentiation

Chart on Overview on criticality of inputs and factors of differentiation

2.3 Factors of disruption

Chart on Overview on factors of disruption

2.4 Impact of drivers and challenges

Chart on Impact of drivers and challenges in 2024 and 2029

3. Market Landscape

3.1 Market ecosystem

Chart on Parent Market
Data Table on - Parent Market

3.2 Market characteristics

Chart on Market characteristics analysis

3.3 Value chain analysis

Chart on Value chain analysis

4. Market Sizing

4.1 Market definition

Data Table on Offerings of companies included in the market definition

4.2 Market segment analysis

Market segments

4.3 Market size 2024

4.4 Market outlook: Forecast for 2024-2029

Chart on Global - Market size and forecast 2024-2029 ($ million)
Data Table on Global - Market size and forecast 2024-2029 ($ million)
Chart on Global Market: Year-over-year growth 2024-2029 (%)
Data Table on Global Market: Year-over-year growth 2024-2029 (%)

5. Historic Market Size

5.1 Global Veterinary Chemistry Analyzers Market 2019 - 2023

Historic Market Size - Data Table on Global Veterinary Chemistry Analyzers Market 2019 - 2023 ($ million)

5.2 Product segment analysis 2019 - 2023

Historic Market Size - Product Segment 2019 - 2023 ($ million)

5.3 Type segment analysis 2019 - 2023

Historic Market Size - Type Segment 2019 - 2023 ($ million)

5.4 Application segment analysis 2019 - 2023

Historic Market Size - Application Segment 2019 - 2023 ($ million)

5.5 Geography segment analysis 2019 - 2023

Historic Market Size - Geography Segment 2019 - 2023 ($ million)

5.6 Country segment analysis 2019 - 2023

Historic Market Size - Country Segment 2019 - 2023 ($ million)

6. Qualitative Analysis

6.1 The impact of AI in the Global Veterinary Chemistry Analyzers Market

7. Five Forces Analysis

7.1 Five forces summary

Five forces analysis - Comparison between 2024 and 2029

7.2 Bargaining power of buyers

Bargaining power of buyers - Impact of key factors 2024 and 2029

7.3 Bargaining power of suppliers

Bargaining power of suppliers - Impact of key factors in 2024 and 2029

7.4 Threat of new entrants

Threat of new entrants - Impact of key factors in 2024 and 2029

7.5 Threat of substitutes

Threat of substitutes - Impact of key factors in 2024 and 2029

7.6 Threat of rivalry

Threat of rivalry - Impact of key factors in 2024 and 2029

7.7 Market condition

Chart on Market condition - Five forces 2024 and 2029

8. Market Segmentation by Product

8.1 Market segments

Chart on Product - Market share 2024-2029 (%)
Data Table on Product - Market share 2024-2029 (%)

8.2 Comparison by Product

Chart on Comparison by Product
Data Table on Comparison by Product

8.3 Instruments - Market size and forecast 2024-2029

Chart on Instruments - Market size and forecast 2024-2029 ($ million)
Data Table on Instruments - Market size and forecast 2024-2029 ($ million)
Chart on Instruments - Year-over-year growth 2024-2029 (%)
Data Table on Instruments - Year-over-year growth 2024-2029 (%)

8.4 Consumables - Market size and forecast 2024-2029

Chart on Consumables - Market size and forecast 2024-2029 ($ million)
Data Table on Consumables - Market size and forecast 2024-2029 ($ million)
Chart on Consumables - Year-over-year growth 2024-2029 (%)
Data Table on Consumables - Year-over-year growth 2024-2029 (%)

8.5 Market opportunity by Product

Market opportunity by Product ($ million)
Data Table on Market opportunity by Product ($ million)

9. Market Segmentation by Type

9.1 Market segments

Chart on Type - Market share 2024-2029 (%)
Data Table on Type - Market share 2024-2029 (%)

9.2 Comparison by Type

Chart on Comparison by Type
Data Table on Comparison by Type

9.3 Benchtop analyzers - Market size and forecast 2024-2029

Chart on Benchtop analyzers - Market size and forecast 2024-2029 ($ million)
Data Table on Benchtop analyzers - Market size and forecast 2024-2029 ($ million)
Chart on Benchtop analyzers - Year-over-year growth 2024-2029 (%)
Data Table on Benchtop analyzers - Year-over-year growth 2024-2029 (%)

9.4 Automated analyzers - Market size and forecast 2024-2029

Chart on Automated analyzers - Market size and forecast 2024-2029 ($ million)
Data Table on Automated analyzers - Market size and forecast 2024-2029 ($ million)
Chart on Automated analyzers - Year-over-year growth 2024-2029 (%)
Data Table on Automated analyzers - Year-over-year growth 2024-2029 (%)

9.5 Portable analyzers - Market size and forecast 2024-2029

Chart on Portable analyzers - Market size and forecast 2024-2029 ($ million)
Data Table on Portable analyzers - Market size and forecast 2024-2029 ($ million)
Chart on Portable analyzers - Year-over-year growth 2024-2029 (%)
Data Table on Portable analyzers - Year-over-year growth 2024-2029 (%)

9.6 Market opportunity by Type

Market opportunity by Type ($ million)
Data Table on Market opportunity by Type ($ million)

10. Market Segmentation by Application

10.1 Market segments

Chart on Application - Market share 2024-2029 (%)
Data Table on Application - Market share 2024-2029 (%)

10.2 Comparison by Application

Chart on Comparison by Application
Data Table on Comparison by Application

10.3 Blood chemistry analysis - Market size and forecast 2024-2029

Chart on Blood chemistry analysis - Market size and forecast 2024-2029 ($ million)
Data Table on Blood chemistry analysis - Market size and forecast 2024-2029 ($ million)
Chart on Blood chemistry analysis - Year-over-year growth 2024-2029 (%)
Data Table on Blood chemistry analysis - Year-over-year growth 2024-2029 (%)

10.4 Electrolyte and gas analysis - Market size and forecast 2024-2029

Chart on Electrolyte and gas analysis - Market size and forecast 2024-2029 ($ million)
Data Table on Electrolyte and gas analysis - Market size and forecast 2024-2029 ($ million)
Chart on Electrolyte and gas analysis - Year-over-year growth 2024-2029 (%)
Data Table on Electrolyte and gas analysis - Year-over-year growth 2024-2029 (%)

10.5 Urinalysis - Market size and forecast 2024-2029

Chart on Urinalysis - Market size and forecast 2024-2029 ($ million)
Data Table on Urinalysis - Market size and forecast 2024-2029 ($ million)
Chart on Urinalysis - Year-over-year growth 2024-2029 (%)
Data Table on Urinalysis - Year-over-year growth 2024-2029 (%)

10.6 Market opportunity by Application

Market opportunity by Application ($ million)
Data Table on Market opportunity by Application ($ million)

11. Customer Landscape

11.1 Customer landscape overview

Analysis of price sensitivity, lifecycle, customer purchase basket, adoption rates, and purchase criteria

12. Geographic Landscape

12.1 Geographic segmentation

Chart on Market share by geography 2024-2029 (%)
Data Table on Market share by geography 2024-2029 (%)

12.2 Geographic comparison

Chart on Geographic comparison
Data Table on Geographic comparison

12.3 North America - Market size and forecast 2024-2029

Chart on North America - Market size and forecast 2024-2029 ($ million)
Data Table on North America - Market size and forecast 2024-2029 ($ million)
Chart on North America - Year-over-year growth 2024-2029 (%)
Data Table on North America - Year-over-year growth 2024-2029 (%)
Chart on Regional Comparison - North America
Data Table on Regional Comparison - North America

12.3.1 US - Market size and forecast 2024-2029

Chart on US - Market size and forecast 2024-2029 ($ million)
Data Table on US - Market size and forecast 2024-2029 ($ million)
Chart on US - Year-over-year growth 2024-2029 (%)
Data Table on US - Year-over-year growth 2024-2029 (%)

12.3.2 Canada - Market size and forecast 2024-2029

Chart on Canada - Market size and forecast 2024-2029 ($ million)
Data Table on Canada - Market size and forecast 2024-2029 ($ million)
Chart on Canada - Year-over-year growth 2024-2029 (%)
Data Table on Canada - Year-over-year growth 2024-2029 (%)

12.3.3 Mexico - Market size and forecast 2024-2029

Chart on Mexico - Market size and forecast 2024-2029 ($ million)
Data Table on Mexico - Market size and forecast 2024-2029 ($ million)
Chart on Mexico - Year-over-year growth 2024-2029 (%)
Data Table on Mexico - Year-over-year growth 2024-2029 (%)

12.4 Europe - Market size and forecast 2024-2029

Chart on Europe - Market size and forecast 2024-2029 ($ million)
Data Table on Europe - Market size and forecast 2024-2029 ($ million)
Chart on Europe - Year-over-year growth 2024-2029 (%)
Data Table on Europe - Year-over-year growth 2024-2029 (%)
Chart on Regional Comparison - Europe
Data Table on Regional Comparison - Europe

12.4.1 Germany - Market size and forecast 2024-2029

Chart on Germany - Market size and forecast 2024-2029 ($ million)
Data Table on Germany - Market size and forecast 2024-2029 ($ million)
Chart on Germany - Year-over-year growth 2024-2029 (%)
Data Table on Germany - Year-over-year growth 2024-2029 (%)

12.4.2 UK - Market size and forecast 2024-2029

Chart on UK - Market size and forecast 2024-2029 ($ million)
Data Table on UK - Market size and forecast 2024-2029 ($ million)
Chart on UK - Year-over-year growth 2024-2029 (%)
Data Table on UK - Year-over-year growth 2024-2029 (%)

12.4.3 France - Market size and forecast 2024-2029

Chart on France - Market size and forecast 2024-2029 ($ million)
Data Table on France - Market size and forecast 2024-2029 ($ million)
Chart on France - Year-over-year growth 2024-2029 (%)
Data Table on France - Year-over-year growth 2024-2029 (%)

12.4.4 Italy - Market size and forecast 2024-2029

Chart on Italy - Market size and forecast 2024-2029 ($ million)
Data Table on Italy - Market size and forecast 2024-2029 ($ million)
Chart on Italy - Year-over-year growth 2024-2029 (%)
Data Table on Italy - Year-over-year growth 2024-2029 (%)

12.4.5 Spain - Market size and forecast 2024-2029

Chart on Spain - Market size and forecast 2024-2029 ($ million)
Data Table on Spain - Market size and forecast 2024-2029 ($ million)
Chart on Spain - Year-over-year growth 2024-2029 (%)
Data Table on Spain - Year-over-year growth 2024-2029 (%)

12.4.6 The Netherlands - Market size and forecast 2024-2029

Chart on The Netherlands - Market size and forecast 2024-2029 ($ million)
Data Table on The Netherlands - Market size and forecast 2024-2029 ($ million)
Chart on The Netherlands - Year-over-year growth 2024-2029 (%)
Data Table on The Netherlands - Year-over-year growth 2024-2029 (%)

12.5 Asia - Market size and forecast 2024-2029

Chart on Asia - Market size and forecast 2024-2029 ($ million)
Data Table on Asia - Market size and forecast 2024-2029 ($ million)
Chart on Asia - Year-over-year growth 2024-2029 (%)
Data Table on Asia - Year-over-year growth 2024-2029 (%)
Chart on Regional Comparison - Asia
Data Table on Regional Comparison - Asia

12.5.1 China - Market size and forecast 2024-2029

Chart on China - Market size and forecast 2024-2029 ($ million)
Data Table on China - Market size and forecast 2024-2029 ($ million)
Chart on China - Year-over-year growth 2024-2029 (%)
Data Table on China - Year-over-year growth 2024-2029 (%)

12.5.2 India - Market size and forecast 2024-2029

Chart on India - Market size and forecast 2024-2029 ($ million)
Data Table on India - Market size and forecast 2024-2029 ($ million)
Chart on India - Year-over-year growth 2024-2029 (%)
Data Table on India - Year-over-year growth 2024-2029 (%)

12.5.3 Japan - Market size and forecast 2024-2029

Chart on Japan - Market size and forecast 2024-2029 ($ million)
Data Table on Japan - Market size and forecast 2024-2029 ($ million)
Chart on Japan - Year-over-year growth 2024-2029 (%)
Data Table on Japan - Year-over-year growth 2024-2029 (%)

12.5.4 South Korea - Market size and forecast 2024-2029

Chart on South Korea - Market size and forecast 2024-2029 ($ million)
Data Table on South Korea - Market size and forecast 2024-2029 ($ million)
Chart on South Korea - Year-over-year growth 2024-2029 (%)
Data Table on South Korea - Year-over-year growth 2024-2029 (%)

12.5.5 Indonesia - Market size and forecast 2024-2029

Chart on Indonesia - Market size and forecast 2024-2029 ($ million)
Data Table on Indonesia - Market size and forecast 2024-2029 ($ million)
Chart on Indonesia - Year-over-year growth 2024-2029 (%)
Data Table on Indonesia - Year-over-year growth 2024-2029 (%)

12.5.6 Thailand - Market size and forecast 2024-2029

Chart on Thailand - Market size and forecast 2024-2029 ($ million)
Data Table on Thailand - Market size and forecast 2024-2029 ($ million)
Chart on Thailand - Year-over-year growth 2024-2029 (%)
Data Table on Thailand - Year-over-year growth 2024-2029 (%)

12.6 Rest of World (ROW) - Market size and forecast 2024-2029

Chart on Rest of World (ROW) - Market size and forecast 2024-2029 ($ million)
Data Table on Rest of World (ROW) - Market size and forecast 2024-2029 ($ million)
Chart on Rest of World (ROW) - Year-over-year growth 2024-2029 (%)
Data Table on Rest of World (ROW) - Year-over-year growth 2024-2029 (%)
Chart on Regional Comparison - Rest of World (ROW)
Data Table on Regional Comparison - Rest of World (ROW)

12.6.1 Brazil - Market size and forecast 2024-2029

Chart on Brazil - Market size and forecast 2024-2029 ($ million)
Data Table on Brazil - Market size and forecast 2024-2029 ($ million)
Chart on Brazil - Year-over-year growth 2024-2029 (%)
Data Table on Brazil - Year-over-year growth 2024-2029 (%)

12.6.2 Saudi Arabia - Market size and forecast 2024-2029

Chart on Saudi Arabia - Market size and forecast 2024-2029 ($ million)
Data Table on Saudi Arabia - Market size and forecast 2024-2029 ($ million)
Chart on Saudi Arabia - Year-over-year growth 2024-2029 (%)
Data Table on Saudi Arabia - Year-over-year growth 2024-2029 (%)

12.6.3 UAE - Market size and forecast 2024-2029

Chart on UAE - Market size and forecast 2024-2029 ($ million)
Data Table on UAE - Market size and forecast 2024-2029 ($ million)
Chart on UAE - Year-over-year growth 2024-2029 (%)
Data Table on UAE - Year-over-year growth 2024-2029 (%)

12.6.4 Turkey - Market size and forecast 2024-2029

Chart on Turkey - Market size and forecast 2024-2029 ($ million)
Data Table on Turkey - Market size and forecast 2024-2029 ($ million)
Chart on Turkey - Year-over-year growth 2024-2029 (%)
Data Table on Turkey - Year-over-year growth 2024-2029 (%)

12.6.5 Argentina - Market size and forecast 2024-2029

Chart on Argentina - Market size and forecast 2024-2029 ($ million)
Data Table on Argentina - Market size and forecast 2024-2029 ($ million)
Chart on Argentina - Year-over-year growth 2024-2029 (%)
Data Table on Argentina - Year-over-year growth 2024-2029 (%)

12.6.6 Colombia - Market size and forecast 2024-2029

Chart on Colombia - Market size and forecast 2024-2029 ($ million)
Data Table on Colombia - Market size and forecast 2024-2029 ($ million)
Chart on Colombia - Year-over-year growth 2024-2029 (%)
Data Table on Colombia - Year-over-year growth 2024-2029 (%)

12.6.7 South Africa - Market size and forecast 2024-2029

Chart on South Africa - Market size and forecast 2024-2029 ($ million)
Data Table on South Africa - Market size and forecast 2024-2029 ($ million)
Chart on South Africa - Year-over-year growth 2024-2029 (%)
Data Table on South Africa - Year-over-year growth 2024-2029 (%)

12.6.8 Israel - Market size and forecast 2024-2029

Chart on Israel - Market size and forecast 2024-2029 ($ million)
Data Table on Israel - Market size and forecast 2024-2029 ($ million)
Chart on Israel - Year-over-year growth 2024-2029 (%)
Data Table on Israel - Year-over-year growth 2024-2029 (%)

12.7 Market opportunity by geography

Market opportunity by geography ($ million)
Data Tables on Market opportunity by geography ($ million)

13. Drivers, Challenges, and Opportunity

13.1 Market drivers

Ascendancy of companion animal ownership and humanization trend
Technological advancements in diagnostic equipment
Growth in veterinary clinics and diagnostic labs

13.2 Market challenges

High costs and budgetary constraints in veterinary practice
Stringent regulations
Limited access in rural and developing regions

13.3 Impact of drivers and challenges

Impact of drivers and challenges in 2024 and 2029

13.4 Market opportunities

Proliferation of POC testing and laboratory consolidation
Increase in animal population
Rapid growth in emerging countries

14. Competitive Landscape

14.1 Overview

14.2

Overview on criticality of inputs and factors of differentiation

14.3 Landscape disruption

Overview on factors of disruption

14.4 Industry risks

Impact of key risks on business

15. Competitive Analysis

15.1 Companies profiled

Companies covered

15.2 Company ranking index

15.3 Market positioning of companies

Matrix on companies position and classification

15.4 Abbott Laboratories

Abbott Laboratories - Overview
Abbott Laboratories - Business segments
Abbott Laboratories - Key news
Abbott Laboratories - Key offerings
Abbott Laboratories - Segment focus
SWOT

15.5 Antech Diagnostics, Inc.

Antech Diagnostics, Inc. - Overview
Antech Diagnostics, Inc. - Product / Service
Antech Diagnostics, Inc. - Key offerings
SWOT

15.6 Arkray USA Inc.

Arkray USA Inc. - Overview
Arkray USA Inc. - Product / Service
Arkray USA Inc. - Key offerings
SWOT

15.7 Chengdu Seamaty Technology

Chengdu Seamaty Technology - Overview
Chengdu Seamaty Technology - Product / Service
Chengdu Seamaty Technology - Key offerings
SWOT

15.8 DiaSys Diagnostic Systems

DiaSys Diagnostic Systems - Overview
DiaSys Diagnostic Systems - Product / Service
DiaSys Diagnostic Systems - Key offerings
SWOT

15.9 Diconex SA

Diconex SA - Overview
Diconex SA - Product / Service
Diconex SA - Key offerings
SWOT

15.10 ELITechGroup SAS

ELITechGroup SAS - Overview
ELITechGroup SAS - Product / Service
ELITechGroup SAS - Key offerings
SWOT

15.11 Eurolyser Diagnostics GmbH

Eurolyser Diagnostics GmbH - Overview
Eurolyser Diagnostics GmbH - Product / Service
Eurolyser Diagnostics GmbH - Key offerings
SWOT

15.12 HORIBA Ltd.

HORIBA Ltd. - Overview
HORIBA Ltd. - Business segments
HORIBA Ltd. - Key news
HORIBA Ltd. - Key offerings
HORIBA Ltd. - Segment focus
SWOT

15.13 IDEXX Laboratories Inc.

IDEXX Laboratories Inc. - Overview
IDEXX Laboratories Inc. - Business segments
IDEXX Laboratories Inc. - Key news
IDEXX Laboratories Inc. - Key offerings
IDEXX Laboratories Inc. - Segment focus
SWOT

15.14 Labomed Inc.

Labomed Inc. - Overview
Labomed Inc. - Product / Service
Labomed Inc. - Key offerings
SWOT

15.15 Neogen Corp.

Neogen Corp. - Overview
Neogen Corp. - Business segments
Neogen Corp. - Key offerings
Neogen Corp. - Segment focus
SWOT

15.16 NeoMedica

NeoMedica - Overview
NeoMedica - Product / Service
NeoMedica - Key offerings
SWOT

15.17 Randox Laboratories Ltd.

Randox Laboratories Ltd. - Overview
Randox Laboratories Ltd. - Product / Service
Randox Laboratories Ltd. - Key news
Randox Laboratories Ltd. - Key offerings
SWOT

15.18 Scil Animal Care Co. GmbH

Scil Animal Care Co. GmbH - Overview
Scil Animal Care Co. GmbH - Product / Service
Scil Animal Care Co. GmbH - Key offerings
SWOT

16. Appendix

16.1 Scope of the report

Market definition
Objectives
Notes and caveats

16.2 Inclusions and exclusions checklist

Inclusions checklist
Exclusions checklist

16.3 Currency conversion rates for US$

16.4 Research methodology

16.5 Data procurement

Information sources

16.6 Data validation

16.7 Validation techniques employed for market sizing

16.8 Data synthesis

16.9 360 degree market analysis

16.10 List of abbreviations

Research Methodology

Technavio presents a detailed picture of the market by way of study, synthesis, and summation of data from multiple sources. The analysts have presented the various facets of the market with a particular focus on identifying the key industry influencers. The data thus presented is comprehensive, reliable, and the result of extensive research, both primary and secondary.

INFORMATION SOURCES

Primary sources

  • Manufacturers and suppliers
  • Channel partners
  • Industry experts
  • Strategic decision makers

Secondary sources

  • Industry journals and periodicals
  • Government data
  • Financial reports of key industry players
  • Historical data
  • Press releases

DATA ANALYSIS

Data Synthesis

  • Collation of data
  • Estimation of key figures
  • Analysis of derived insights

Data Validation

  • Triangulation with data models
  • Reference against proprietary databases
  • Corroboration with industry experts

REPORT WRITING

Qualitative

  • Market drivers
  • Market challenges
  • Market trends
  • Five forces analysis

Quantitative

  • Market size and forecast
  • Market segmentation
  • Geographical insights
  • Competitive landscape

Interested in this report?

Get your sample now to see our research methodology and insights!

Download Now

Frequently Asked Questions

Veterinary Chemistry Analyzers market growth will increase by USD 442.7 million during 2025-2029.

The Veterinary Chemistry Analyzers market is expected to grow at a CAGR of 6.5% during 2025-2029.

Veterinary Chemistry Analyzers market is segmented by Product (Instruments, Consumables) Type (Benchtop analyzers, Automated analyzers, Portable analyzers) Application (Blood chemistry analysis, Electrolyte and gas analysis, Urinalysis)

Abbott Laboratories, Antech Diagnostics, Inc., Arkray USA Inc., Chengdu Seamaty Technology, DiaSys Diagnostic Systems, Diconex SA, ELITechGroup SAS, Eurolyser Diagnostics GmbH, HORIBA Ltd., IDEXX Laboratories Inc., Labomed Inc., Neogen Corp., NeoMedica, Randox Laboratories Ltd., Scil Animal Care Co. GmbH, Skyla Corp., Tianjin LOCMEDT Technologies, Ushio Inc., Zoetis Inc. are a few of the key vendors in the Veterinary Chemistry Analyzers market.

North America will register the highest growth rate of 39.1% among the other regions. Therefore, the Veterinary Chemistry Analyzers market in North America is expected to garner significant business opportunities for the vendors during the forecast period.

US, Canada, Mexico, Germany, UK, France, Italy, Spain, The Netherlands, China, India, Japan, South Korea, Indonesia, Thailand, Brazil, Saudi Arabia, UAE, Turkey, Argentina, Colombia, South Africa, Israel

  • Ascendancy of companion animal ownership and humanization trend is the driving factor this market.

The Veterinary Chemistry Analyzers market vendors should focus on grabbing business opportunities from the Product segment as it accounted for the largest market share in the base year.