Laboratory Analytical Instruments And Consumables Market Analysis, Size, and Forecast 2026-2030: North America (US, Canada, and Mexico), Europe (Germany, France, and UK), APAC (China, Japan, and India), South America (Brazil, Argentina, and Colombia), Middle East and Africa (Saudi Arabia, UAE, and Turkey), Asia, Rest of World (ROW)

Laboratory Analytical Instruments And Consumables Market Analysis, Size, and Forecast 2026-2030:
North America (US, Canada, and Mexico), Europe (Germany, France, and UK), APAC (China, Japan, and India), South America (Brazil, Argentina, and Colombia), Middle East and Africa (Saudi Arabia, UAE, and Turkey), Asia, Rest of World (ROW)

Published: Mar 2026 301 Pages SKU: IRTNTR40460

Market Overview at a Glance

$25.04 B
Market Opportunity
10.1%
CAGR 2025 - 2030
36.3%
North America Growth
$29.45 B
Instruments segment 2024

Laboratory Analytical Instruments And Consumables Market Size 2026-2030

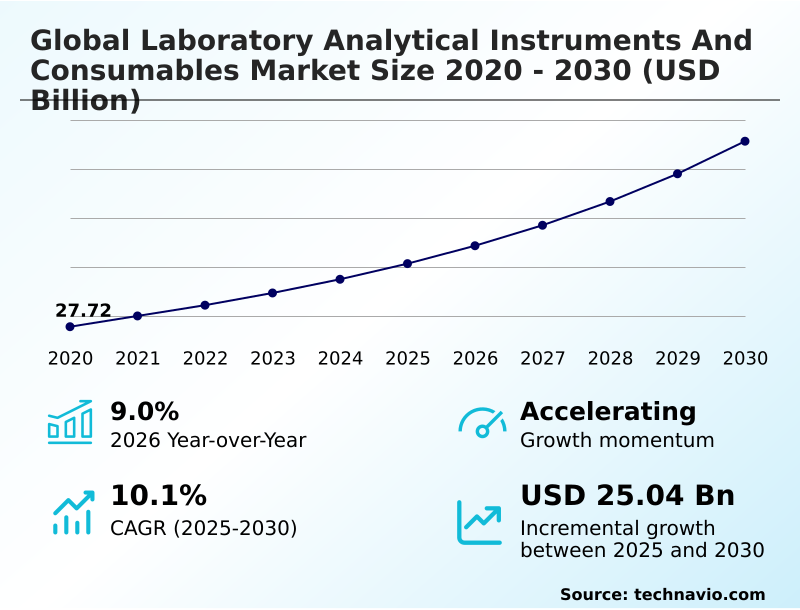
The laboratory analytical instruments and consumables market size is valued to increase by USD 25.04 billion, at a CAGR of 10.1% from 2025 to 2030. Rising demand for personalized therapies in preventive healthcare will drive the laboratory analytical instruments and consumables market.

Major Market Trends & Insights

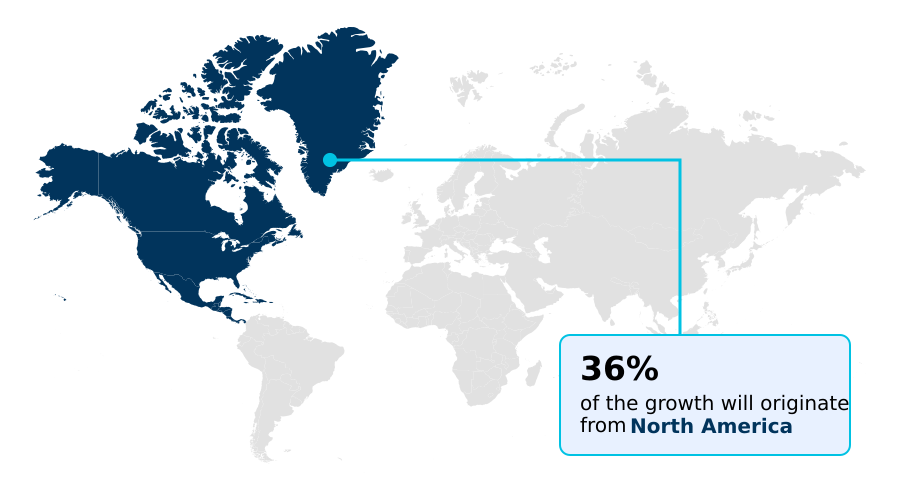
  • North America dominated the market and accounted for a 36.3% growth during the forecast period.
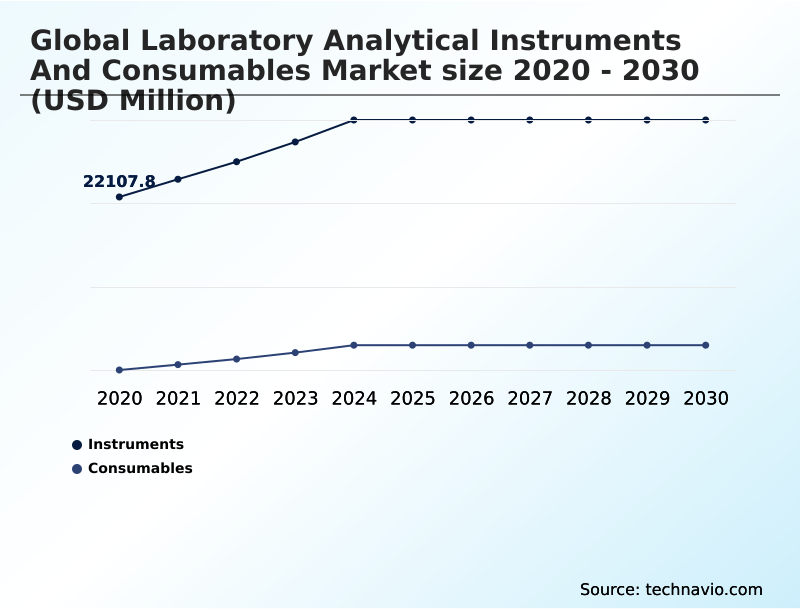
  • By Type - Instruments segment was valued at USD 29.45 billion in 2024
  • By Application - Element analysis segment accounted for the largest market revenue share in 2024

Market Size & Forecast

  • Market Opportunities: USD 37.95 billion
  • Market Future Opportunities: USD 25.04 billion
  • CAGR from 2025 to 2030 : 10.1%

Market Summary

  • The laboratory analytical instruments and consumables market is defined by continuous innovation, driven by the increasing complexity of research and stringent regulatory demands across multiple sectors. Key drivers include rising investments in drug discovery, the expansion of personalized medicine requiring precise molecular diagnostics, and the growing global need for robust environmental testing.
  • This creates sustained demand for sophisticated technologies such as mass spectrometry and next-generation sequencing that offer higher precision and throughput. A primary trend is the integration of automation and artificial intelligence, enabling laboratories to streamline workflows, reduce human error, and enhance data analysis.
  • For instance, a pharmaceutical firm can implement fully automated quality control systems, leveraging high-throughput screening and advanced chromatography, to analyze batch consistency in real-time, which significantly reduces manual errors and accelerates product release timelines.
  • However, the market faces significant challenges from the high capital cost of advanced instrumentation and a persistent shortage of skilled professionals capable of operating and maintaining these complex systems.
  • The industry's trajectory is toward more integrated, intelligent, and accessible analytical solutions that address the evolving needs of scientific and industrial applications while navigating economic pressures and workforce constraints, ensuring data integrity and compliance.

What will be the Size of the Laboratory Analytical Instruments And Consumables Market during the forecast period?

Get Key Insights on Market Forecast (PDF) Request Free Sample

How is the Laboratory Analytical Instruments And Consumables Market Segmented?

The laboratory analytical instruments and consumables industry research report provides comprehensive data (region-wise segment analysis), with forecasts and estimates in "USD million" for the period 2026-2030, as well as historical data from 2020-2024 for the following segments.

  • Type
    • Instruments
    • Consumables
  • Application
    • Element analysis
    • Separation analysis
    • Molecular analysis
  • End-user
    • Hospitals and diagnostic laboratories
    • Academic and research institutes
    • Pharmaceutical and biotechnology companies
    • Environmental testing labs
    • Contract research organizations (CROs)
  • Geography
    • North America
      • US
      • Canada
      • Mexico
    • Europe
      • Germany
      • France
      • UK
    • Asia
    • Rest of World (ROW)

By Type Insights

The instruments segment is estimated to witness significant growth during the forecast period.

The instruments segment is foundational to laboratory operations, encompassing capital equipment essential for analysis. Market dynamics are driven by R&D spending in biotechnology and academia, alongside stringent regulatory mandates in clinical diagnostics.

A significant trend is the integration of automation and AI, enhancing data analysis for applications like biomarker identification and genetic profiling.

Laboratories seek solutions offering higher throughput and reduced human error, with instruments like clinical chemistry analyzers, immunoassay systems, and hematology analyzers seeing increased adoption. This move towards efficiency is critical for drug discovery and protein target identification.

Advanced platforms, including spectrophotometers and microplate readers, integrated with AI, are reducing analysis times by up to 25%, enabling faster molecular diagnostics and high-throughput screening workflows.

Request Free Sample

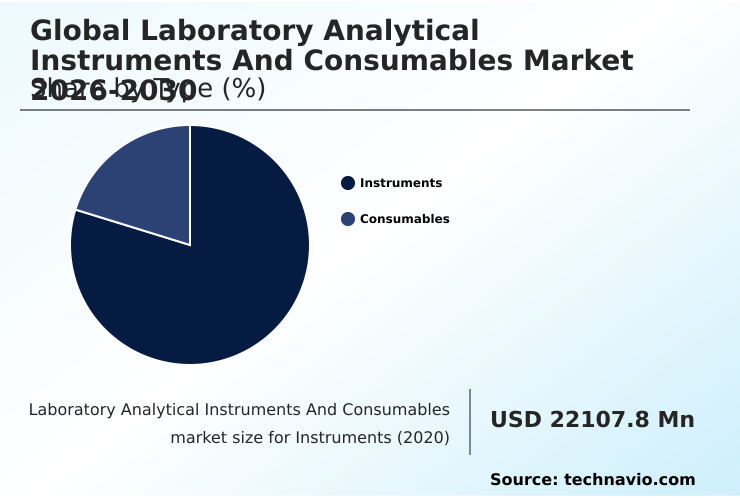
The Instruments segment was valued at USD 29.45 billion in 2024 and showed a gradual increase during the forecast period.

Request Free Sample

Regional Analysis

North America is estimated to contribute 36.3% to the growth of the global market during the forecast period.Technavio’s analysts have elaborately explained the regional trends and drivers that shape the market during the forecast period.

See How Laboratory Analytical Instruments And Consumables Market Demand is Rising in North America Request Free Sample

The geographic landscape is dominated by North America, which accounts for over 36% of market opportunities, driven by substantial investments in life science research and a robust pharmaceutical sector.

Europe follows, with strong demand for advanced spectroscopy and mass spectrometry tools. Meanwhile, Asia is the fastest-growing region, fueled by expanding healthcare infrastructure and a burgeoning biotech industry.

Laboratories in this region are rapidly adopting automation, leading to a 20% improvement in sample throughput for pharmaceutical analysis and preclinical services.

The adoption of next-generation sequencing and digital pathology platforms is accelerating globally for applications in bioanalysis and materials characterization. Demand for chromatography and polymerase chain reaction systems remains high across all regions for routine testing and quality control.

Market Dynamics

Our researchers analyzed the data with 2025 as the base year, along with the key drivers, trends, and challenges. A holistic analysis of drivers will help companies refine their marketing strategies to gain a competitive advantage.

  • The laboratory analytical instruments and consumables market is advancing through specialized applications and technological integration. Laboratory instruments for drug discovery are becoming more automated, with automation in high-throughput screening enabling pharmaceutical companies to screen thousands of compounds daily. This reliance on sophisticated systems underscores the importance of analytical consumables for quality control to ensure data accuracy and reproducibility.
  • In clinical settings, mass spectrometry in personalized medicine is enabling tailored treatment strategies, while advanced diagnostics for infectious diseases are becoming critical for public health. The development of chromatography systems for pharmaceutical analysis continues to refine purity and compound identification processes. Concurrently, nanotechnology in analytical instrument design is a key innovation, leading to more sensitive and portable laboratory analytical instruments.
  • The rise of digital pathology for clinical trials is transforming how research data is collected and analyzed. This is complemented by the growth of ai-driven diagnostics in laboratory workflows, which improves efficiency and reduces human error. Effective sample preparation for mass spectrometry remains a crucial step for achieving reliable results.
  • As regulatory compliance analytical testing becomes stricter, the demand for precise instruments for environmental pollutant detection is increasing. Precision proteomics analytical instruments and techniques for separation analysis in biotechnology are also gaining prominence. The development of point-of-care analytical devices is bringing diagnostics closer to the patient.
  • However, the high cost of ownership analytical instruments and the significant laboratory professional skill gap impact continue to be major considerations for organizations. Firms utilizing high-purity reagents for spectroscopy report data accuracy rates that are more than 30% higher than those using standard-grade materials, directly impacting research outcomes and compliance.

What are the key market drivers leading to the rise in the adoption of Laboratory Analytical Instruments And Consumables Industry?

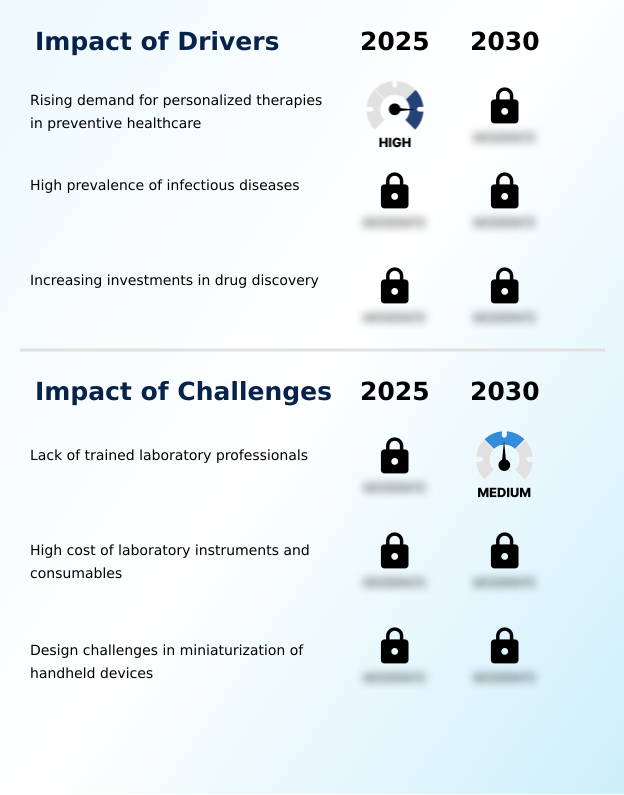
  • The rising demand for personalized therapies within preventive healthcare is a key driver propelling market growth and innovation.

  • The rising demand for personalized therapies and increasing investments in drug discovery are key drivers for the market. The high prevalence of infectious and chronic diseases globally fuels the need for advanced clinical diagnostics and environmental testing.
  • Pharmaceutical companies are intensifying R&D, relying on instruments like gas chromatography and nuclear magnetic resonance spectroscopy to identify drug targets and ensure regulatory compliance.
  • Innovations such as high-throughput screening, enabled by automated liquid handlers and cell imagers, accelerate the drug discovery process. Investments in this area have increased the demand for analytical tools by over 20%.
  • The adoption of biophysical characterization tools and dissolution testing apparatus is critical for adhering to good manufacturing practices, ensuring the quality control of new therapies within the growing bio-health industry.

What are the market trends shaping the Laboratory Analytical Instruments And Consumables Industry?

  • Technological evolution, particularly the growth of nanotechnology, is a significant upcoming trend. It promises to enhance the precision, sensitivity, and functionality of analytical platforms.

  • Technological evolution and the growth of nanotechnology are reshaping the market, driving demand for instruments with higher precision and automation. The adoption of digital pathology systems leverages AI to enhance diagnostic accuracy, reducing pathologist review times by 30%. This trend is fostering the development of miniaturized and portable instruments, making point-of-care testing more accessible and efficient.
  • The integration of laboratory information management systems with platforms for liquid chromatography and UV-Vis spectroscopy is streamlining data workflows in continuous manufacturing environments. Nanotechnology is enhancing the performance of tools for elemental analysis and separation analysis, such as atomic absorption spectroscopy and inductively coupled plasma mass spectrometry.
  • These advancements improve detection sensitivity by over 40%, enabling more accurate molecular analysis and protein crystallization studies.

What challenges does the Laboratory Analytical Instruments And Consumables Industry face during its growth?

  • A lack of trained laboratory professionals presents a key challenge, potentially affecting the operational efficiency and growth of the industry.

  • The high cost of advanced instruments and a shortage of trained laboratory professionals are significant market challenges. The complexity of systems for molecular spectroscopy and high-content screening systems requires specialized expertise, and the current skills gap increases lab operational costs by an average of 10%. This shortage affects various applications, from pharmaceutical analysis to food safety analysis.
  • The initial investment for technologies like electrophoresis and surface analysis instruments can be prohibitive for smaller labs, delaying adoption. This challenge is compounded by ongoing maintenance expenses, which can account for up to 20% of the instrument's initial cost annually. These factors create hurdles for labs engaged in high-throughput screening and personalized medicine, impacting workflow efficiency and research timelines.

Exclusive Technavio Analysis on Customer Landscape

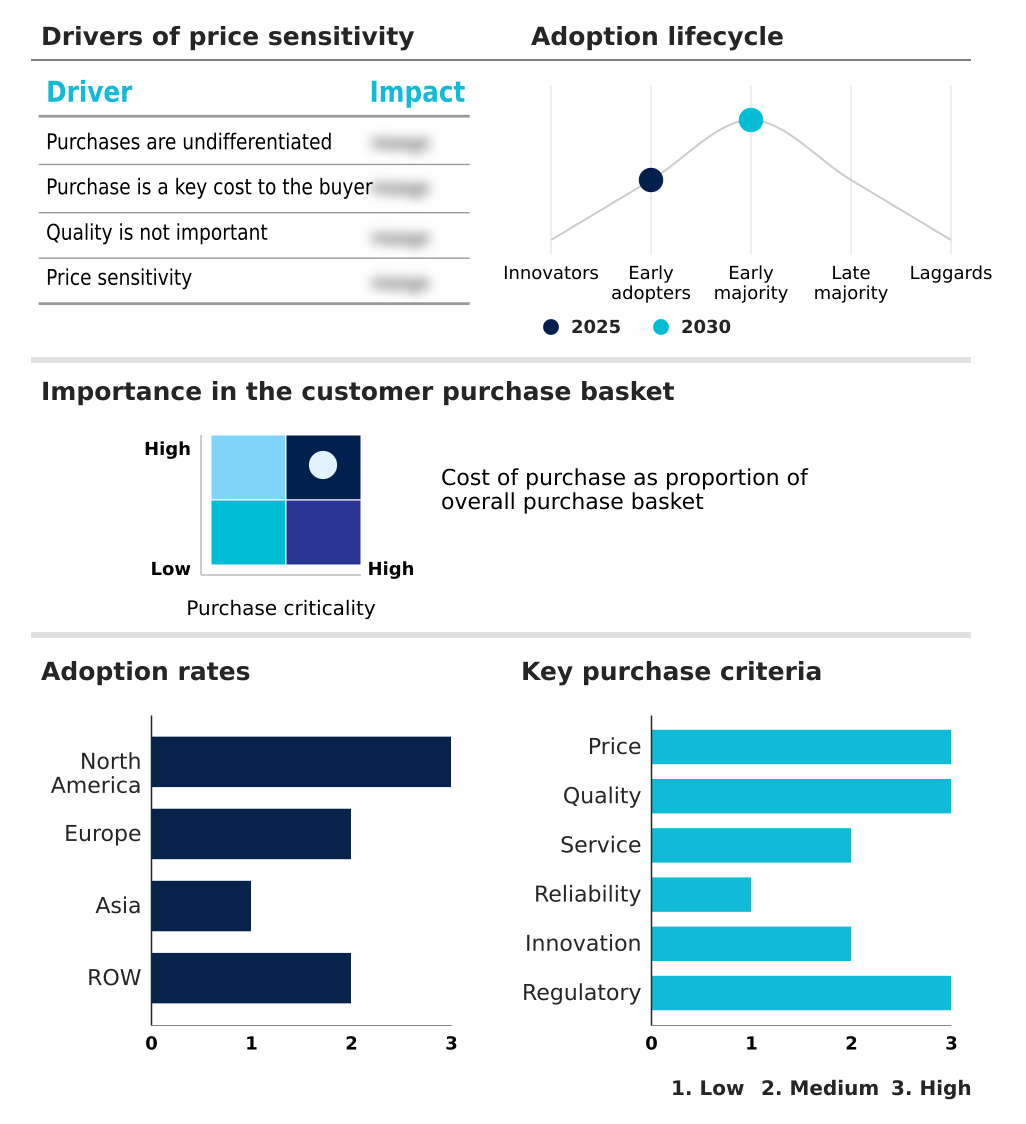
The laboratory analytical instruments and consumables market forecasting report includes the adoption lifecycle of the market, covering from the innovator’s stage to the laggard’s stage. It focuses on adoption rates in different regions based on penetration. Furthermore, the laboratory analytical instruments and consumables market report also includes key purchase criteria and drivers of price sensitivity to help companies evaluate and develop their market growth analysis strategies.

Customer Landscape of Laboratory Analytical Instruments And Consumables Industry

Competitive Landscape

Companies are implementing various strategies, such as strategic alliances, laboratory analytical instruments and consumables market forecast, partnerships, mergers and acquisitions, geographical expansion, and product/service launches, to enhance their presence in the industry.

ABB Ltd. - Core offerings include advanced laboratory analytical instruments and consumables, pivotal for research, diagnostics, and quality control applications across various high-tech industries.

The industry research and growth report includes detailed analyses of the competitive landscape of the market and information about key companies, including:

  • ABB Ltd.
  • Agilent Technologies Inc.
  • AMETEK Inc.
  • Bio Rad Laboratories Inc.
  • Bruker Corp.
  • Chemglass Inc.
  • Cole Parmer
  • Danaher Corp.
  • Endress Hauser Grp Services
  • Eurofins Scientific SE
  • Harvard Bioscience Inc.
  • Helena Laboratories Corp.
  • Hitachi Ltd.
  • PerkinElmer US LLC
  • Process Insights Inc.
  • Shimadzu Corp.
  • Thermo Fisher Scientific Inc.
  • Waters Corp.

Qualitative and quantitative analysis of companies has been conducted to help clients understand the wider business environment as well as the strengths and weaknesses of key industry players. Data is qualitatively analyzed to categorize companies as pure play, category-focused, industry-focused, and diversified; it is quantitatively analyzed to categorize companies as dominant, leading, strong, tentative, and weak.

Recent Development and News in Laboratory analytical instruments and consumables market

  • In September 2024, Lilly announced the completion of its new state-of-the-art biologics development facility in Ireland, featuring a fully automated quality control laboratory to accelerate batch release testing.
  • In November 2024, Thermo Fisher Scientific Inc. launched a new line of sustainable laboratory consumables, crafted from recycled materials to reduce plastic waste in research environments.
  • In February 2025, Danaher Corp. completed the acquisition of a specialized AI software firm, integrating predictive analytics into its mass spectrometry platforms to enhance diagnostic accuracy.
  • In April 2025, Agilent Technologies Inc. received regulatory approval for a new point-of-care diagnostic instrument designed for rapid infectious disease screening in decentralized healthcare settings.

Dive into Technavio’s robust research methodology, blending expert interviews, extensive data synthesis, and validated models for unparalleled Laboratory Analytical Instruments And Consumables Market insights. See full methodology.

Market Scope
Page number 301
Base year 2025
Historic period 2020-2024
Forecast period 2026-2030
Growth momentum & CAGR Accelerate at a CAGR of 10.1%
Market growth 2026-2030 USD 25040.7 million
Market structure Fragmented
YoY growth 2025-2026(%) 9.0%
Key countries US, Canada, Mexico, Germany, France, UK, Italy, Spain, The Netherlands, China, Japan, India, South Korea, Indonesia, Thailand, Brazil, Saudi Arabia, UAE, Turkey, Argentina, Colombia, South Africa and Israel
Competitive landscape Leading Companies, Market Positioning of Companies, Competitive Strategies, and Industry Risks

Request Free Sample

Research Analyst Overview

  • The laboratory analytical instruments and consumables market is characterized by rapid technological evolution and expanding applications. The continuous drive for innovation is evident in the development of sophisticated platforms like mass spectrometry, next-generation sequencing, and advanced spectroscopy. These tools, including chromatography systems, electron microscopy, and spectrophotometers, are indispensable across pharmaceuticals, clinical diagnostics, and environmental science.
  • In the boardroom, the decision to invest in high-end equipment such as nuclear magnetic resonance spectroscopy or automated liquid handlers is now a strategic imperative, directly impacting R&D timelines and competitive positioning. For instance, the adoption of high-content screening systems has been shown to reduce preclinical validation cycles by up to 25%.
  • Instruments like flow cytometry, cell imagers, and microplate readers are critical for cell-based assays, while biophysical characterization tools support the development of biologics. Core diagnostic functions rely on clinical chemistry analyzers, immunoassay systems, hematology analyzers, and coagulation analyzers.
  • Specialized techniques like polymerase chain reaction, nanoparticle tracking analysis, and digital pathology are enabling more precise and rapid analysis, with UV-vis spectroscopy, atomic absorption spectroscopy, x-ray fluorescence, and inductively coupled plasma mass spectrometry serving elemental analysis needs. Even foundational tools like dissolution testing apparatus and surface analysis instruments are seeing upgrades for enhanced performance and data integrity.

What are the Key Data Covered in this Laboratory Analytical Instruments And Consumables Market Research and Growth Report?

  • What is the expected growth of the Laboratory Analytical Instruments And Consumables Market between 2026 and 2030?

    • USD 25.04 billion, at a CAGR of 10.1%

  • What segmentation does the market report cover?

    • The report is segmented by Type (Instruments, and Consumables), Application (Element analysis, Separation analysis, and Molecular analysis), End-user (Hospitals and diagnostic laboratories, Academic and research institutes, Pharmaceutical and biotechnology companies, Environmental testing labs, and Contract research organizations (CROs)) and Geography (North America, Europe, Asia, Rest of World (ROW))

  • Which regions are analyzed in the report?

    • North America, Europe, Asia and Rest of World (ROW)

  • What are the key growth drivers and market challenges?

    • Rising demand for personalized therapies in preventive healthcare, Lack of trained laboratory professionals

  • Who are the major players in the Laboratory Analytical Instruments And Consumables Market?

    • ABB Ltd., Agilent Technologies Inc., AMETEK Inc., Bio Rad Laboratories Inc., Bruker Corp., Chemglass Inc., Cole Parmer, Danaher Corp., Endress Hauser Grp Services, Eurofins Scientific SE, Harvard Bioscience Inc., Helena Laboratories Corp., Hitachi Ltd., PerkinElmer US LLC, Process Insights Inc., Shimadzu Corp., Thermo Fisher Scientific Inc. and Waters Corp.

Market Research Insights

  • The market's dynamics are shaped by the convergence of advanced diagnostics and stringent industrial requirements. The shift toward personalized medicine fuels demand for precise bioanalysis and genetic profiling, while process analytical technology is transforming continuous manufacturing in pharmaceuticals. Organizations adopting laboratory information management systems report a 30% reduction in data transcription errors.
  • Concurrently, the expansion of high-throughput screening in drug discovery has improved candidate identification efficiency by over 40%. The need for robust environmental testing and food safety analysis drives innovation in portable and automated instruments. Applications in materials characterization and petrochemical testing also contribute to market growth, demanding durable and highly accurate systems for quality control and regulatory compliance.

We can help! Our analysts can customize this laboratory analytical instruments and consumables market research report to meet your requirements.

Get in touch

1. Executive Summary

1.1 Market overview

Executive Summary - Chart on Market Overview
Executive Summary - Data Table on Market Overview
Executive Summary - Chart on Global Market Characteristics
Executive Summary - Chart on Market by Geography
Executive Summary - Chart on Market Segmentation by Type
Executive Summary - Chart on Market Segmentation by Application
Executive Summary - Chart on Market Segmentation by End-user
Executive Summary - Chart on Incremental Growth
Executive Summary - Data Table on Incremental Growth
Executive Summary - Chart on Company Market Positioning

2. Technavio Analysis

2.1 Analysis of price sensitivity, lifecycle, customer purchase basket, adoption rates, and purchase criteria

2.2 Criticality of inputs and Factors of differentiation

Chart on Overview on criticality of inputs and factors of differentiation

2.3 Factors of disruption

Chart on Overview on factors of disruption

2.4 Impact of drivers and challenges

Chart on Impact of drivers and challenges in 2025 and 2030

3. Market Landscape

3.1 Market ecosystem

Chart on Parent Market
Data Table on - Parent Market

3.2 Market characteristics

Chart on Market characteristics analysis

3.3 Value chain analysis

Chart on Value chain analysis

4. Market Sizing

4.1 Market definition

Data Table on Offerings of companies included in the market definition

4.2 Market segment analysis

Market segments

4.3 Market size 2025

4.4 Market outlook: Forecast for 2025-2030

Chart on Global - Market size and forecast 2025-2030 ($ million)
Data Table on Global - Market size and forecast 2025-2030 ($ million)
Chart on Global Market: Year-over-year growth 2025-2030 (%)
Data Table on Global Market: Year-over-year growth 2025-2030 (%)

5. Historic Market Size

5.1 Global Laboratory Analytical Instruments And Consumables Market 2020 - 2024

Historic Market Size - Data Table on Global Laboratory Analytical Instruments And Consumables Market 2020 - 2024 ($ million)

5.2 Type segment analysis 2020 - 2024

Historic Market Size - Type Segment 2020 - 2024 ($ million)

5.3 Application segment analysis 2020 - 2024

Historic Market Size - Application Segment 2020 - 2024 ($ million)

5.4 End-user segment analysis 2020 - 2024

Historic Market Size - End-user Segment 2020 - 2024 ($ million)

5.5 Geography segment analysis 2020 - 2024

Historic Market Size - Geography Segment 2020 - 2024 ($ million)

5.6 Country segment analysis 2020 - 2024

Historic Market Size - Country Segment 2020 - 2024 ($ million)

6. Qualitative Analysis

6.1 The AI impact on Global Laboratory Analytical Instruments and Consumables Market

7. Five Forces Analysis

7.1 Five forces summary

Five forces analysis - Comparison between 2025 and 2030

7.2 Bargaining power of buyers

Bargaining power of buyers - Impact of key factors 2025 and 2030

7.3 Bargaining power of suppliers

Bargaining power of suppliers - Impact of key factors in 2025 and 2030

7.4 Threat of new entrants

Threat of new entrants - Impact of key factors in 2025 and 2030

7.5 Threat of substitutes

Threat of substitutes - Impact of key factors in 2025 and 2030

7.6 Threat of rivalry

Threat of rivalry - Impact of key factors in 2025 and 2030

7.7 Market condition

Chart on Market condition - Five forces 2025 and 2030

8. Market Segmentation by Type

8.1 Market segments

Chart on Type - Market share 2025-2030 (%)
Data Table on Type - Market share 2025-2030 (%)

8.2 Comparison by Type

Chart on Comparison by Type
Data Table on Comparison by Type

8.3 Instruments - Market size and forecast 2025-2030

Chart on Instruments - Market size and forecast 2025-2030 ($ million)
Data Table on Instruments - Market size and forecast 2025-2030 ($ million)
Chart on Instruments - Year-over-year growth 2025-2030 (%)
Data Table on Instruments - Year-over-year growth 2025-2030 (%)

8.4 Consumables - Market size and forecast 2025-2030

Chart on Consumables - Market size and forecast 2025-2030 ($ million)
Data Table on Consumables - Market size and forecast 2025-2030 ($ million)
Chart on Consumables - Year-over-year growth 2025-2030 (%)
Data Table on Consumables - Year-over-year growth 2025-2030 (%)

8.5 Market opportunity by Type

Market opportunity by Type ($ million)
Data Table on Market opportunity by Type ($ million)

9. Market Segmentation by Application

9.1 Market segments

Chart on Application - Market share 2025-2030 (%)
Data Table on Application - Market share 2025-2030 (%)

9.2 Comparison by Application

Chart on Comparison by Application
Data Table on Comparison by Application

9.3 Element analysis - Market size and forecast 2025-2030

Chart on Element analysis - Market size and forecast 2025-2030 ($ million)
Data Table on Element analysis - Market size and forecast 2025-2030 ($ million)
Chart on Element analysis - Year-over-year growth 2025-2030 (%)
Data Table on Element analysis - Year-over-year growth 2025-2030 (%)

9.4 Separation analysis - Market size and forecast 2025-2030

Chart on Separation analysis - Market size and forecast 2025-2030 ($ million)
Data Table on Separation analysis - Market size and forecast 2025-2030 ($ million)
Chart on Separation analysis - Year-over-year growth 2025-2030 (%)
Data Table on Separation analysis - Year-over-year growth 2025-2030 (%)

9.5 Molecular analysis - Market size and forecast 2025-2030

Chart on Molecular analysis - Market size and forecast 2025-2030 ($ million)
Data Table on Molecular analysis - Market size and forecast 2025-2030 ($ million)
Chart on Molecular analysis - Year-over-year growth 2025-2030 (%)
Data Table on Molecular analysis - Year-over-year growth 2025-2030 (%)

9.6 Market opportunity by Application

Market opportunity by Application ($ million)
Data Table on Market opportunity by Application ($ million)

10. Market Segmentation by End-user

10.1 Market segments

Chart on End-user - Market share 2025-2030 (%)
Data Table on End-user - Market share 2025-2030 (%)

10.2 Comparison by End-user

Chart on Comparison by End-user
Data Table on Comparison by End-user

10.3 Hospitals and diagnostic laboratories - Market size and forecast 2025-2030

Chart on Hospitals and diagnostic laboratories - Market size and forecast 2025-2030 ($ million)
Data Table on Hospitals and diagnostic laboratories - Market size and forecast 2025-2030 ($ million)
Chart on Hospitals and diagnostic laboratories - Year-over-year growth 2025-2030 (%)
Data Table on Hospitals and diagnostic laboratories - Year-over-year growth 2025-2030 (%)

10.4 Academic and research institutes - Market size and forecast 2025-2030

Chart on Academic and research institutes - Market size and forecast 2025-2030 ($ million)
Data Table on Academic and research institutes - Market size and forecast 2025-2030 ($ million)
Chart on Academic and research institutes - Year-over-year growth 2025-2030 (%)
Data Table on Academic and research institutes - Year-over-year growth 2025-2030 (%)

10.5 Pharmaceutical and biotechnology companies - Market size and forecast 2025-2030

Chart on Pharmaceutical and biotechnology companies - Market size and forecast 2025-2030 ($ million)
Data Table on Pharmaceutical and biotechnology companies - Market size and forecast 2025-2030 ($ million)
Chart on Pharmaceutical and biotechnology companies - Year-over-year growth 2025-2030 (%)
Data Table on Pharmaceutical and biotechnology companies - Year-over-year growth 2025-2030 (%)

10.6 Environmental testing labs - Market size and forecast 2025-2030

Chart on Environmental testing labs - Market size and forecast 2025-2030 ($ million)
Data Table on Environmental testing labs - Market size and forecast 2025-2030 ($ million)
Chart on Environmental testing labs - Year-over-year growth 2025-2030 (%)
Data Table on Environmental testing labs - Year-over-year growth 2025-2030 (%)

10.7 Contract research organizations (CROs) - Market size and forecast 2025-2030

Chart on Contract research organizations (CROs) - Market size and forecast 2025-2030 ($ million)
Data Table on Contract research organizations (CROs) - Market size and forecast 2025-2030 ($ million)
Chart on Contract research organizations (CROs) - Year-over-year growth 2025-2030 (%)
Data Table on Contract research organizations (CROs) - Year-over-year growth 2025-2030 (%)

10.8 Market opportunity by End-user

Market opportunity by End-user ($ million)
Data Table on Market opportunity by End-user ($ million)

11. Customer Landscape

11.1 Customer landscape overview

Analysis of price sensitivity, lifecycle, customer purchase basket, adoption rates, and purchase criteria

12. Geographic Landscape

12.1 Geographic segmentation

Chart on Market share by geography 2025-2030 (%)
Data Table on Market share by geography 2025-2030 (%)

12.2 Geographic comparison

Chart on Geographic comparison
Data Table on Geographic comparison

12.3 North America - Market size and forecast 2025-2030

Chart on North America - Market size and forecast 2025-2030 ($ million)
Data Table on North America - Market size and forecast 2025-2030 ($ million)
Chart on North America - Year-over-year growth 2025-2030 (%)
Data Table on North America - Year-over-year growth 2025-2030 (%)
Chart on Regional Comparison - North America
Data Table on Regional Comparison - North America

12.3.1 US - Market size and forecast 2025-2030

Chart on US - Market size and forecast 2025-2030 ($ million)
Data Table on US - Market size and forecast 2025-2030 ($ million)
Chart on US - Year-over-year growth 2025-2030 (%)
Data Table on US - Year-over-year growth 2025-2030 (%)

12.3.2 Canada - Market size and forecast 2025-2030

Chart on Canada - Market size and forecast 2025-2030 ($ million)
Data Table on Canada - Market size and forecast 2025-2030 ($ million)
Chart on Canada - Year-over-year growth 2025-2030 (%)
Data Table on Canada - Year-over-year growth 2025-2030 (%)

12.3.3 Mexico - Market size and forecast 2025-2030

Chart on Mexico - Market size and forecast 2025-2030 ($ million)
Data Table on Mexico - Market size and forecast 2025-2030 ($ million)
Chart on Mexico - Year-over-year growth 2025-2030 (%)
Data Table on Mexico - Year-over-year growth 2025-2030 (%)

12.4 Europe - Market size and forecast 2025-2030

Chart on Europe - Market size and forecast 2025-2030 ($ million)
Data Table on Europe - Market size and forecast 2025-2030 ($ million)
Chart on Europe - Year-over-year growth 2025-2030 (%)
Data Table on Europe - Year-over-year growth 2025-2030 (%)
Chart on Regional Comparison - Europe
Data Table on Regional Comparison - Europe

12.4.1 Germany - Market size and forecast 2025-2030

Chart on Germany - Market size and forecast 2025-2030 ($ million)
Data Table on Germany - Market size and forecast 2025-2030 ($ million)
Chart on Germany - Year-over-year growth 2025-2030 (%)
Data Table on Germany - Year-over-year growth 2025-2030 (%)

12.4.2 France - Market size and forecast 2025-2030

Chart on France - Market size and forecast 2025-2030 ($ million)
Data Table on France - Market size and forecast 2025-2030 ($ million)
Chart on France - Year-over-year growth 2025-2030 (%)
Data Table on France - Year-over-year growth 2025-2030 (%)

12.4.3 UK - Market size and forecast 2025-2030

Chart on UK - Market size and forecast 2025-2030 ($ million)
Data Table on UK - Market size and forecast 2025-2030 ($ million)
Chart on UK - Year-over-year growth 2025-2030 (%)
Data Table on UK - Year-over-year growth 2025-2030 (%)

12.4.4 Italy - Market size and forecast 2025-2030

Chart on Italy - Market size and forecast 2025-2030 ($ million)
Data Table on Italy - Market size and forecast 2025-2030 ($ million)
Chart on Italy - Year-over-year growth 2025-2030 (%)
Data Table on Italy - Year-over-year growth 2025-2030 (%)

12.4.5 Spain - Market size and forecast 2025-2030

Chart on Spain - Market size and forecast 2025-2030 ($ million)
Data Table on Spain - Market size and forecast 2025-2030 ($ million)
Chart on Spain - Year-over-year growth 2025-2030 (%)
Data Table on Spain - Year-over-year growth 2025-2030 (%)

12.4.6 The Netherlands - Market size and forecast 2025-2030

Chart on The Netherlands - Market size and forecast 2025-2030 ($ million)
Data Table on The Netherlands - Market size and forecast 2025-2030 ($ million)
Chart on The Netherlands - Year-over-year growth 2025-2030 (%)
Data Table on The Netherlands - Year-over-year growth 2025-2030 (%)

12.5 Asia - Market size and forecast 2025-2030

Chart on Asia - Market size and forecast 2025-2030 ($ million)
Data Table on Asia - Market size and forecast 2025-2030 ($ million)
Chart on Asia - Year-over-year growth 2025-2030 (%)
Data Table on Asia - Year-over-year growth 2025-2030 (%)
Chart on Regional Comparison - Asia
Data Table on Regional Comparison - Asia

12.5.1 China - Market size and forecast 2025-2030

Chart on China - Market size and forecast 2025-2030 ($ million)
Data Table on China - Market size and forecast 2025-2030 ($ million)
Chart on China - Year-over-year growth 2025-2030 (%)
Data Table on China - Year-over-year growth 2025-2030 (%)

12.5.2 Japan - Market size and forecast 2025-2030

Chart on Japan - Market size and forecast 2025-2030 ($ million)
Data Table on Japan - Market size and forecast 2025-2030 ($ million)
Chart on Japan - Year-over-year growth 2025-2030 (%)
Data Table on Japan - Year-over-year growth 2025-2030 (%)

12.5.3 India - Market size and forecast 2025-2030

Chart on India - Market size and forecast 2025-2030 ($ million)
Data Table on India - Market size and forecast 2025-2030 ($ million)
Chart on India - Year-over-year growth 2025-2030 (%)
Data Table on India - Year-over-year growth 2025-2030 (%)

12.5.4 South Korea - Market size and forecast 2025-2030

Chart on South Korea - Market size and forecast 2025-2030 ($ million)
Data Table on South Korea - Market size and forecast 2025-2030 ($ million)
Chart on South Korea - Year-over-year growth 2025-2030 (%)
Data Table on South Korea - Year-over-year growth 2025-2030 (%)

12.5.5 Indonesia - Market size and forecast 2025-2030

Chart on Indonesia - Market size and forecast 2025-2030 ($ million)
Data Table on Indonesia - Market size and forecast 2025-2030 ($ million)
Chart on Indonesia - Year-over-year growth 2025-2030 (%)
Data Table on Indonesia - Year-over-year growth 2025-2030 (%)

12.5.6 Thailand - Market size and forecast 2025-2030

Chart on Thailand - Market size and forecast 2025-2030 ($ million)
Data Table on Thailand - Market size and forecast 2025-2030 ($ million)
Chart on Thailand - Year-over-year growth 2025-2030 (%)
Data Table on Thailand - Year-over-year growth 2025-2030 (%)

12.6 Rest of World (ROW) - Market size and forecast 2025-2030

Chart on Rest of World (ROW) - Market size and forecast 2025-2030 ($ million)
Data Table on Rest of World (ROW) - Market size and forecast 2025-2030 ($ million)
Chart on Rest of World (ROW) - Year-over-year growth 2025-2030 (%)
Data Table on Rest of World (ROW) - Year-over-year growth 2025-2030 (%)
Chart on Regional Comparison - Rest of World (ROW)
Data Table on Regional Comparison - Rest of World (ROW)

12.6.1 Brazil - Market size and forecast 2025-2030

Chart on Brazil - Market size and forecast 2025-2030 ($ million)
Data Table on Brazil - Market size and forecast 2025-2030 ($ million)
Chart on Brazil - Year-over-year growth 2025-2030 (%)
Data Table on Brazil - Year-over-year growth 2025-2030 (%)

12.6.2 Saudi Arabia - Market size and forecast 2025-2030

Chart on Saudi Arabia - Market size and forecast 2025-2030 ($ million)
Data Table on Saudi Arabia - Market size and forecast 2025-2030 ($ million)
Chart on Saudi Arabia - Year-over-year growth 2025-2030 (%)
Data Table on Saudi Arabia - Year-over-year growth 2025-2030 (%)

12.6.3 UAE - Market size and forecast 2025-2030

Chart on UAE - Market size and forecast 2025-2030 ($ million)
Data Table on UAE - Market size and forecast 2025-2030 ($ million)
Chart on UAE - Year-over-year growth 2025-2030 (%)
Data Table on UAE - Year-over-year growth 2025-2030 (%)

12.6.4 Turkey - Market size and forecast 2025-2030

Chart on Turkey - Market size and forecast 2025-2030 ($ million)
Data Table on Turkey - Market size and forecast 2025-2030 ($ million)
Chart on Turkey - Year-over-year growth 2025-2030 (%)
Data Table on Turkey - Year-over-year growth 2025-2030 (%)

12.6.5 Argentina - Market size and forecast 2025-2030

Chart on Argentina - Market size and forecast 2025-2030 ($ million)
Data Table on Argentina - Market size and forecast 2025-2030 ($ million)
Chart on Argentina - Year-over-year growth 2025-2030 (%)
Data Table on Argentina - Year-over-year growth 2025-2030 (%)

12.6.6 Colombia - Market size and forecast 2025-2030

Chart on Colombia - Market size and forecast 2025-2030 ($ million)
Data Table on Colombia - Market size and forecast 2025-2030 ($ million)
Chart on Colombia - Year-over-year growth 2025-2030 (%)
Data Table on Colombia - Year-over-year growth 2025-2030 (%)

12.6.7 South Africa - Market size and forecast 2025-2030

Chart on South Africa - Market size and forecast 2025-2030 ($ million)
Data Table on South Africa - Market size and forecast 2025-2030 ($ million)
Chart on South Africa - Year-over-year growth 2025-2030 (%)
Data Table on South Africa - Year-over-year growth 2025-2030 (%)

12.6.8 Israel - Market size and forecast 2025-2030

Chart on Israel - Market size and forecast 2025-2030 ($ million)
Data Table on Israel - Market size and forecast 2025-2030 ($ million)
Chart on Israel - Year-over-year growth 2025-2030 (%)
Data Table on Israel - Year-over-year growth 2025-2030 (%)

12.7 Market opportunity by geography

Market opportunity by geography ($ million)
Data Tables on Market opportunity by geography ($ million)

13. Drivers, Challenges, and Opportunity

13.1 Market drivers

Rising demand for personalized therapies in preventive healthcare
High prevalence of infectious diseases
Increasing investments in drug discovery

13.2 Market challenges

Lack of trained laboratory professionals
High cost of laboratory instruments and consumables
Design challenges in miniaturization of handheld devices

13.3 Impact of drivers and challenges

Impact of drivers and challenges in 2025 and 2030

13.4 Market opportunities

Evolution in technology and growth of nanotechnology
Rising number of applications for analytical instruments
Adoption of digital pathology system in drug discovery and clinical trials

14. Competitive Landscape

14.1 Overview

14.2

Overview on criticality of inputs and factors of differentiation

14.3 Landscape disruption

Overview on factors of disruption

14.4 Industry risks

Impact of key risks on business

15. Competitive Analysis

15.1 Companies profiled

Companies covered

15.2 Company ranking index

15.3 Market positioning of companies

Matrix on companies position and classification

15.4 ABB Ltd.

ABB Ltd. - Overview
ABB Ltd. - Business segments
ABB Ltd. - Key news
ABB Ltd. - Key offerings
ABB Ltd. - Segment focus
SWOT

15.5 Agilent Technologies Inc.

Agilent Technologies Inc. - Overview
Agilent Technologies Inc. - Business segments
Agilent Technologies Inc. - Key news
Agilent Technologies Inc. - Key offerings
Agilent Technologies Inc. - Segment focus
SWOT

15.6 Bio Rad Laboratories Inc.

Bio Rad Laboratories Inc. - Overview
Bio Rad Laboratories Inc. - Business segments
Bio Rad Laboratories Inc. - Key news
Bio Rad Laboratories Inc. - Key offerings
Bio Rad Laboratories Inc. - Segment focus
SWOT

15.7 Bruker Corp.

Bruker Corp. - Overview
Bruker Corp. - Business segments
Bruker Corp. - Key news
Bruker Corp. - Key offerings
Bruker Corp. - Segment focus
SWOT

15.8 Chemglass Inc.

Chemglass Inc. - Overview
Chemglass Inc. - Product / Service
Chemglass Inc. - Key offerings
SWOT

15.9 Cole Parmer

Cole Parmer - Overview
Cole Parmer - Product / Service
Cole Parmer - Key offerings
SWOT

15.10 Danaher Corp.

Danaher Corp. - Overview
Danaher Corp. - Business segments
Danaher Corp. - Key news
Danaher Corp. - Key offerings
Danaher Corp. - Segment focus
SWOT

15.11 Endress Hauser Grp Services

Endress Hauser Grp Services - Overview
Endress Hauser Grp Services - Product / Service
Endress Hauser Grp Services - Key news
Endress Hauser Grp Services - Key offerings
SWOT

15.12 Eurofins Scientific SE

Eurofins Scientific SE - Overview
Eurofins Scientific SE - Business segments
Eurofins Scientific SE - Key offerings
Eurofins Scientific SE - Segment focus
SWOT

15.13 Harvard Bioscience Inc.

Harvard Bioscience Inc. - Overview
Harvard Bioscience Inc. - Product / Service
Harvard Bioscience Inc. - Key offerings
SWOT

15.14 Helena Laboratories Corp.

Helena Laboratories Corp. - Overview
Helena Laboratories Corp. - Product / Service
Helena Laboratories Corp. - Key offerings
SWOT

15.15 PerkinElmer US LLC

PerkinElmer US LLC - Overview
PerkinElmer US LLC - Business segments
PerkinElmer US LLC - Key offerings
PerkinElmer US LLC - Segment focus
SWOT

15.16 Process Insights Inc.

Process Insights Inc. - Overview
Process Insights Inc. - Product / Service
Process Insights Inc. - Key offerings
SWOT

15.17 Thermo Fisher Scientific Inc.

Thermo Fisher Scientific Inc. - Overview
Thermo Fisher Scientific Inc. - Business segments
Thermo Fisher Scientific Inc. - Key news
Thermo Fisher Scientific Inc. - Key offerings
Thermo Fisher Scientific Inc. - Segment focus
SWOT

15.18 Waters Corp.

Waters Corp. - Overview
Waters Corp. - Business segments
Waters Corp. - Key offerings
Waters Corp. - Segment focus
SWOT

16. Appendix

16.1 Scope of the report

Market definition
Objectives
Notes and caveats

16.2 Inclusions and exclusions checklist

Inclusions checklist
Exclusions checklist

16.3 Currency conversion rates for US$

16.4 Research methodology

16.5 Data procurement

Information sources

16.6 Data validation

16.7 Validation techniques employed for market sizing

16.8 Data synthesis

16.9 360 degree market analysis

16.10 List of abbreviations

Research Methodology

Technavio presents a detailed picture of the market by way of study, synthesis, and summation of data from multiple sources. The analysts have presented the various facets of the market with a particular focus on identifying the key industry influencers. The data thus presented is comprehensive, reliable, and the result of extensive research, both primary and secondary.

INFORMATION SOURCES

Primary sources

  • Manufacturers and suppliers
  • Channel partners
  • Industry experts
  • Strategic decision makers

Secondary sources

  • Industry journals and periodicals
  • Government data
  • Financial reports of key industry players
  • Historical data
  • Press releases

DATA ANALYSIS

Data Synthesis

  • Collation of data
  • Estimation of key figures
  • Analysis of derived insights

Data Validation

  • Triangulation with data models
  • Reference against proprietary databases
  • Corroboration with industry experts

REPORT WRITING

Qualitative

  • Market drivers
  • Market challenges
  • Market trends
  • Five forces analysis

Quantitative

  • Market size and forecast
  • Market segmentation
  • Geographical insights
  • Competitive landscape

Interested in this report?

Get your sample now to see our research methodology and insights!

Download Now

Frequently Asked Questions

Laboratory Analytical Instruments And Consumables market growth will increase by USD 25040.7 million during 2026-2030.

The Laboratory Analytical Instruments And Consumables market is expected to grow at a CAGR of 10.1% during 2026-2030.

Laboratory Analytical Instruments And Consumables market is segmented by Type (Instruments, Consumables) Application (Element analysis, Separation analysis, Molecular analysis) End-user (Hospitals and diagnostic laboratories, Academic and research institutes, Pharmaceutical and biotechnology companies, Environmental testing labs, Contract research organizations (CROs))

ABB Ltd., Agilent Technologies Inc., AMETEK Inc., Bio Rad Laboratories Inc., Bruker Corp., Chemglass Inc., Cole Parmer, Danaher Corp., Endress Hauser Grp Services, Eurofins Scientific SE, Harvard Bioscience Inc., Helena Laboratories Corp., Hitachi Ltd., PerkinElmer US LLC, Process Insights Inc., Shimadzu Corp., Thermo Fisher Scientific Inc., Waters Corp. are a few of the key vendors in the Laboratory Analytical Instruments And Consumables market.

North America will register the highest growth rate of 36.3% among the other regions. Therefore, the Laboratory Analytical Instruments And Consumables market in North America is expected to garner significant business opportunities for the vendors during the forecast period.

US, Canada, Mexico, Germany, France, UK, Italy, Spain, The Netherlands, China, Japan, India, South Korea, Indonesia, Thailand, Brazil, Saudi Arabia, UAE, Turkey, Argentina, Colombia, South Africa, Israel

  • Rising demand for personalized therapies in preventive healthcare is the driving factor this market.

The Laboratory Analytical Instruments And Consumables market vendors should focus on grabbing business opportunities from the Type segment as it accounted for the largest market share in the base year.