
Companion Animal Specialty Drugs Market Size 2025-2029
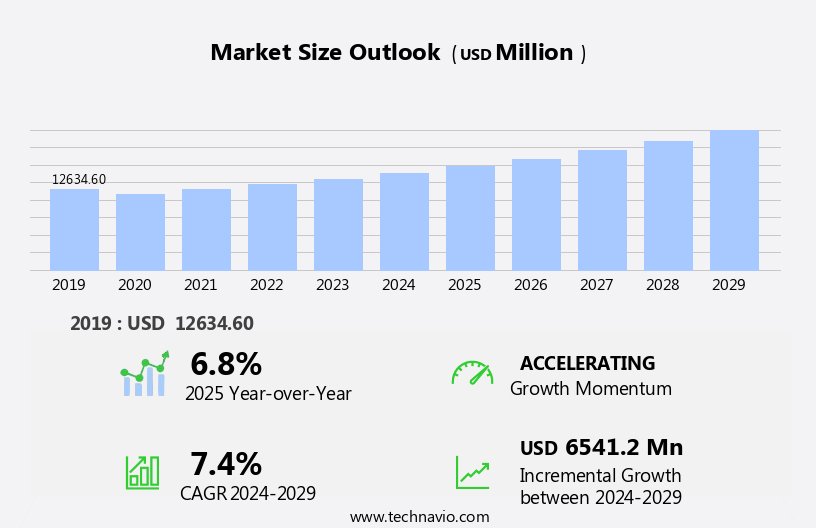
The companion animal specialty drugs market size is forecast to increase by USD 6.54 billion at a CAGR of 7.4% between 2024 and 2029.
- The market is experiencing significant growth due to the increasing trend of pet humanization, which has led to an increased demand for specialized veterinary medications. Pet owners are treating their animals as family members and are willing to invest in their health and wellbeing, driving the market's expansion. Furthermore, the development of innovative companion animal specialty drug offerings is catering to the unique needs of pets, providing effective solutions for various health conditions. However, the market faces challenges as well. The patent expiry of several companion animal specialty drugs poses a threat to market players, as generic alternatives enter the market and price competition intensifies.
- This could impact the profitability of companies and necessitate a focus on research and development to maintain a competitive edge. Additionally, regulatory requirements and stringent approval processes can prolong the time-to-market for new specialty drugs, increasing the risk and cost of bringing new products to market. Companies must navigate these challenges effectively by investing in research and development, building strategic partnerships, and adhering to regulatory guidelines to capitalize on the market's growth opportunities.
What will be the Size of the Companion Animal Specialty Drugs Market during the forecast period?
How is this Companion Animal Specialty Drugs Industry segmented?
The companion animal specialty drugs industry research report provides comprehensive data (region-wise segment analysis), with forecasts and estimates in "USD million" for the period 2025-2029, as well as historical data from 2019-2023 for the following segments.
- Distribution Channel
- Veterinary hospitals
- Pet care clinics
- Pharmacy stores
- Product
- Vaccines
- Antibiotics
- Parasiticides
- Feed additives
- Others
- Route Of Administration
- Oral
- Injectable
- Animal Type
- Cats
- Dogs
- Horses
- Others
- Drug Type
- Anti-Infectives
- Anti-Inflammatories
- Vaccines
- Geography
- North America
- US
- Canada
- Europe
- France
- Germany
- Italy
- UK
- Middle East and Africa
- Egypt
- KSA
- Oman
- UAE
- APAC
- China
- India
- Japan
- South America
- Argentina
- Brazil
- Rest of World (ROW)
- North America
By Distribution Channel Insights
The veterinary hospitals segment is estimated to witness significant growth during the forecast period.
In the realm of veterinary care, the companion animal sector encompasses a significant market segment. Veterinary pharmaceuticals play a pivotal role in this industry, supplying essential medications for pets. Veterinary technicians, an integral part of the animal healthcare team, ensure the effective administration of these drugs. Pet owners prioritize their beloved companions' health and safety, driving the demand for high-quality veterinary services. Data analytics and electronic medical records facilitate personalized treatments, enabling veterinary professionals to provide precise care. Wearable devices and mobile apps offer real-time monitoring, enhancing preventive care. Supply chain management ensures the timely distribution of veterinary drugs, maintaining the continuity of care.
Advancements in veterinary science include gene therapy, artificial intelligence, and Diagnostic Imaging, revolutionizing the treatment of chronic diseases. Research institutions and veterinary specialists collaborate on clinical trials to develop new drugs and therapies, addressing the needs of aging pets and various animal health concerns. Regulatory compliance is crucial in the veterinary pharmaceutical industry, ensuring the safety and efficacy of prescription drugs. Over-the-counter medications cater to common ailments, while veterinary education and continuing professional development keep animal care professionals updated on the latest treatments and technologies. Animal shelters and animal hospitals rely on veterinary software and cloud computing for efficient record-keeping and data management.
Affordable care initiatives and pet insurance help ensure access to essential treatments for pets. Drug interactions and adverse effects necessitate careful consideration, with regulatory approvals and quality control measures in place to safeguard animal welfare. Neurological, cardiovascular, and Oncology Drugs, among others, offer innovative solutions for pets with complex health issues. Veterinary informatics and data privacy are essential aspects of modern veterinary practice, enabling predictive analytics and precision medicine. The veterinary community's ongoing research and development drive advancements in veterinary care, ultimately benefiting our cherished companion animals.
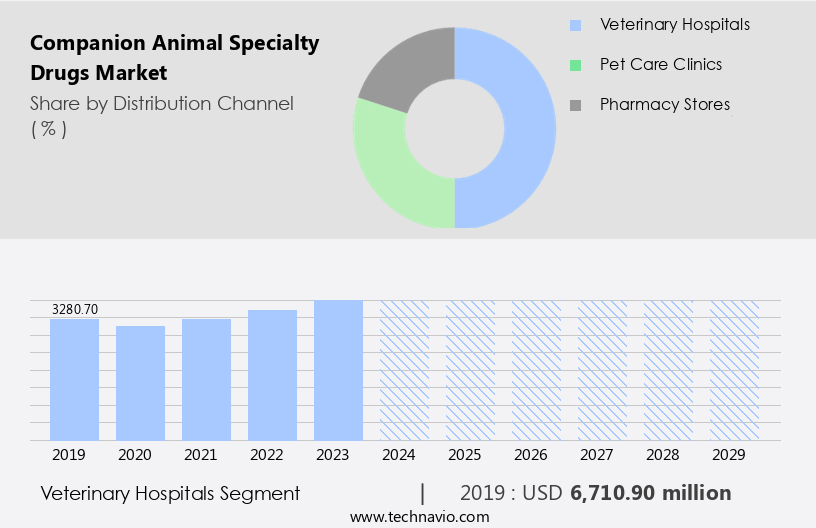
The Veterinary hospitals segment was valued at USD 6.71 billion in 2019 and showed a gradual increase during the forecast period.
Regional Analysis
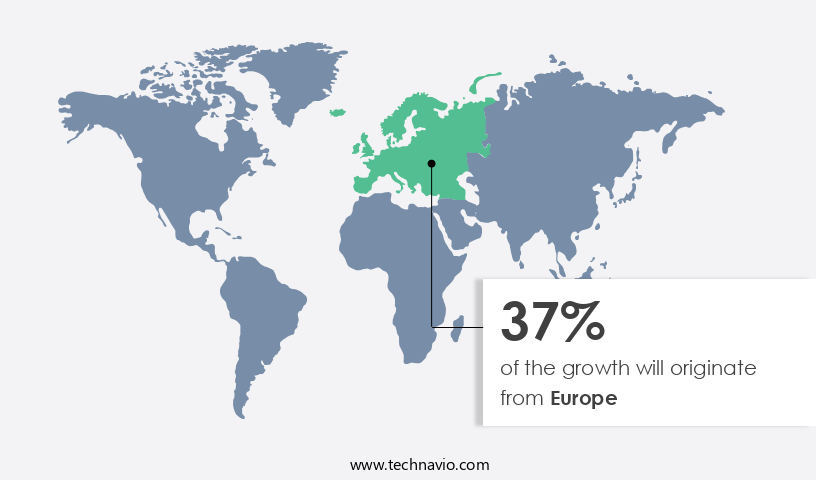
Europe is estimated to contribute 37% to the growth of the global market during the forecast period.Technavio's analysts have elaborately explained the regional trends and drivers that shape the market during the forecast period.
In North America, home to the largest pet population globally, the veterinary pharmaceuticals market is experiencing significant growth. The American Pet Products Association's 2023-2024 National Pet Owners Survey reported that 66% of US households own pets, a notable increase from 62% in 2023 and 56% in 1988. This trend is fueled by the high demand for pet companionship, particularly among the aging population. The humanization of pets, with owners regarding them as family members, is a major market driver. Veterinary technicians play a crucial role in this sector, ensuring drug safety and administering treatments. Pet health is a top priority for owners, leading to increased spending on veterinary care, including personalized treatments and wearable devices.
Electronic medical records facilitate efficient data analytics and improve diagnostic accuracy. Advancements in drug development, such as gene therapy and artificial intelligence, offer innovative solutions for chronic diseases. Research institutions and veterinary specialists collaborate on clinical trials to develop new treatments and improve quality control. Over-the-counter medications and affordable care initiatives cater to the needs of pet owners seeking accessible and cost-effective options. The veterinary profession emphasizes professional development, with continuing education and veterinary informatics being essential components. Drug distribution and regulatory compliance are critical aspects of the market, ensuring the availability of prescription drugs and adherence to safety standards.
Animal welfare remains a top priority, with preventive care, diagnostic imaging, and critical care services being integral parts of veterinary medicine. Animal hospitals and clinics leverage technology, such as mobile apps, veterinary software, and big data, to enhance patient care and streamline operations. Pet insurance and pain management are essential services for pet owners, addressing health care costs and ensuring their companions receive the best possible care. In conclusion, the veterinary pharmaceuticals market in North America is thriving, driven by the growing pet population, increasing pet ownership, and the humanization trend. The market is characterized by advancements in veterinary science, technology adoption, and a focus on animal health and welfare.
Market Dynamics
The Companion Animal Specialty Drugs Market is revolutionizing pet healthcare with innovations like personalized veterinary medications, AI-powered drug diagnostics, and precision medicine for companion animals. Advanced solutions such as targeted cancer therapies for pets, low-dose chemotherapy for dogs, and veterinary oncology drugs for small practices address critical needs. Long-acting injectables, palatable oral medications, and non-invasive drug delivery enhance pet comfort, while novel antiparasitic formulations and immunotherapy for allergies improve outcomes. Digital prescription platforms, subscription-based drug delivery, and smart drug dispensing devices streamline care. Veterinary biosimilars, probiotic-based therapies, and regenerative medicine for pets drive sustainability alongside eco-friendly drug packaging. Affordable veterinary compounding pharmacies ensure accessibility, supporting chronic disease management for pets and pet-friendly oral medications for arthritis.
The market continues to evolve, driven by advancements in veterinary medicine and the growing demand for improved pet health. Veterinary clinics and animal care professionals increasingly rely on neurological drugs, pain management solutions, and ophthalmic treatments to address complex conditions. Technology plays a significant role, with the adoption of electronic medical records, wearable devices, and mobile apps enabling personalized treatments and better access to care. Supply chain management and regulatory compliance are critical concerns for pharmaceutical manufacturing, with a focus on ensuring drug safety and quality control. Research institutions and veterinary specialists collaborate on drug development, including gene therapy and artificial intelligence, to address chronic diseases and adverse effects.
Data analytics and predictive analytics are transforming veterinary informatics, enabling precision medicine and affordable care. pet insurance and veterinary education also contribute to the market's dynamism, offering financial support and professional development opportunities. The market's continuous unfolding is influenced by various sectors, including animal hospitals, critical care, and veterinary diagnostics. The integration of big data, cloud computing, and veterinary software streamlines operations and enhances diagnostic capabilities. Despite the ongoing advancements, challenges persist, such as drug pricing, regulatory approvals, and data privacy concerns. Animal welfare and preventive care remain essential priorities, with a growing focus on lifestyle diseases and animal care professionals' ongoing education. The market's evolving patterns reflect the interconnectedness of various sectors and the commitment to improving pet health and welfare.
Our researchers analyzed the data with 2024 as the base year, along with the key drivers, trends, and challenges. A holistic analysis of drivers will help companies refine their marketing strategies to gain a competitive advantage.
What are the key market drivers leading to the rise in the adoption of Companion Animal Specialty Drugs Industry?
- The rising trend of pet humanization serves as the primary catalyst for market growth.
- The companion animal market is witnessing notable growth due to the increasing number of pet owners who consider their animals as family members. This trend is observed in both developed and emerging markets. According to the Centers for Disease Control and Prevention (CDC), approximately 40 million households in the US own a cat as a companion animal. To ensure the well-being of these pets, their owners are seeking high-quality healthcare products. This demand extends beyond basic care to specialized treatments, such as oncology and endocrine drugs, which are increasingly being used to manage age-related health issues.
- Veterinary science is continually advancing, leading to the development of specialty drugs and diagnostic imaging techniques that enable early detection and treatment of various conditions. However, the rising costs of veterinary care and potential adverse effects of certain medications are concerns for pet owners. Insurance coverage for Companion animal healthcare is becoming more common, but it may not always fully cover the costs of specialty drugs or diagnostic procedures. Drug distribution channels for companion animal specialty drugs are evolving, with veterinary specialists and animal shelters playing a significant role. Regulatory compliance is crucial to ensure the safety and efficacy of these drugs, as they are subject to the same regulatory standards as human pharmaceuticals.
- The use of specialty drugs in animal healthcare is increasing, with cardiovascular and endocrine drugs being among the most commonly prescribed. Drug interactions between companion animal medications and human medications are a potential concern, and pet owners must be informed of any potential risks. In conclusion, the companion animal market is experiencing significant growth due to the increasing number of pets being treated as family members. The demand for high-quality healthcare products and specialized treatments is driving the development of new drugs and diagnostic techniques. However, concerns regarding costs, adverse effects, and regulatory compliance must be addressed to ensure the best possible care for companion animals.
What are the market trends shaping the Companion Animal Specialty Drugs Industry?
- The trend in the market is leaning towards expanded specialty drug offerings for companion animals.
- The market is experiencing notable growth due to the increasing focus on animal welfare and preventive care. Regulatory approvals for innovative pet medications continue, driven by clinical trials and quality control measures. Veterinary education and research and development are key factors fueling this market. Advanced technologies such as imaging studies, veterinary databases, and veterinary informatics are enabling personalized medicine and predictive analytics, enhancing the effectiveness of treatments. Companions animal healthcare companies are investing in research to develop solutions for behavioral issues, such as Ceva's FELIWAY, which reduces conflict and tension in multi-cat households.
- Another innovation, GALASTOP, treats lactation in dogs during false pregnancies. The market's offerings have expanded, providing affordable care options for pet owners while maintaining the highest standards of data privacy and prescription drug safety.
What challenges does the Companion Animal Specialty Drugs Industry face during its growth?
- The expiry of patents on companion animal specialty drugs poses a significant challenge to the industry's growth trajectory.
- The market faces challenges due to the expiry of patents on various formulations. This trend is expected to negatively impact the market as prices decrease and the rigorous approval process for veterinary drugs results in fewer new approvals. For instance, the patent expiry of Convenia's formulation in 2024 has already occurred. The stringent drug approval process for animals, compared to humans, further intensifies concerns regarding high patent expiry rates. This situation is anticipated to hinder the growth of the market during the forecast period. Professional veterinary clinics rely on advanced technologies such as neurological drugs, pain management solutions, ophthalmic drugs, and dermatological drugs to provide optimal care for their patients.
- Mobile apps, pet insurance, big data, veterinary software, and digital health solutions have become integral parts of animal care, enhancing the efficiency and effectiveness of veterinary medicine. Animal care professionals, including veterinary nurses and critical care specialists, leverage cloud computing and pharmaceutical manufacturing to ensure the timely availability of essential drugs. Veterinary diagnostics and pharmaceutical manufacturing companies invest in research and development to introduce innovative solutions for various lifestyle diseases in companion animals. Despite these advancements, the patent expiry issue remains a significant concern for the market.
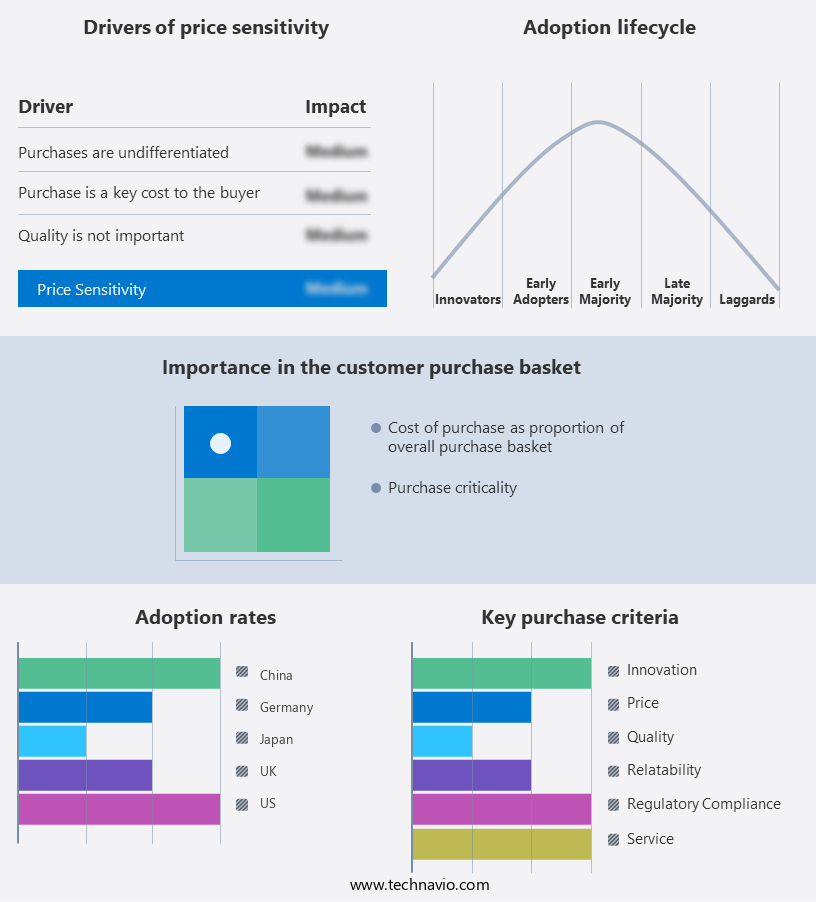
Exclusive Customer Landscape
The companion animal specialty drugs market forecasting report includes the adoption lifecycle of the market, covering from the innovator's stage to the laggard's stage. It focuses on adoption rates in different regions based on penetration. Furthermore, the companion animal specialty drugs market report also includes key purchase criteria and drivers of price sensitivity to help companies evaluate and develop their market growth analysis strategies.
Customer Landscape
Key Companies & Market Insights
Companies are implementing various strategies, such as strategic alliances, companion animal specialty drugs market forecast, partnerships, mergers and acquisitions, geographical expansion, and product/service launches, to enhance their presence in the industry.
Aratana Therapeutics Inc. - The company specializes in the development and production of companion animal therapeutics derived from proteins found in milk, eggs, and meat.
The industry research and growth report includes detailed analyses of the competitive landscape of the market and information about key companies, including:
- Aratana Therapeutics Inc.
- Bayer AG
- Boehringer Ingelheim International GmbH
- Ceva Santé Animale
- Dechra Pharmaceuticals Plc
- Elanco Animal Health Inc.
- Heska Corp.
- IDEXX Laboratories Inc.
- Jaguar Health Inc.
- Kindred Biosciences Inc.
- Merck & Co. Inc.
- MSD Animal Health
- Neogen Corp.
- Norbrook Laboratories Ltd.
- Patterson Companies Inc.
- Vetoquinol SA
- Virbac SA
- Zoetis Inc.
- Zomedica Corp.
- Zuprevo
Qualitative and quantitative analysis of companies has been conducted to help clients understand the wider business environment as well as the strengths and weaknesses of key industry players. Data is qualitatively analyzed to categorize companies as pure play, category-focused, industry-focused, and diversified; it is quantitatively analyzed to categorize companies as dominant, leading, strong, tentative, and weak.
Recent Development and News in Companion Animal Specialty Drugs Market
- In February 2024, Boehringer Ingelheim Animal Health launched a new specialty drug, Intercept XL, for the treatment of canine liver disease. This innovative product, which received FDA approval in late 2023, significantly expands the company's offerings in the companion animal health sector (Boehringer Ingelheim press release, 2024).
- In May 2025, Elanco Animal Health and Zoetis, two major players in the market, announced a strategic partnership to co-develop and commercialize a novel class of parasiticides. This collaboration aims to address the growing concern of antiparasitic resistance and improve the overall health and well-being of companion animals (Elanco Animal Health press release, 2025).
- In August 2024, Merck Animal Health completed the acquisition of Antelliq, a leading provider of digital identification and traceability solutions for livestock and companion animals. This acquisition strengthens Merck Animal Health's position in the market by adding advanced technology and data analytics capabilities (Merck Animal Health press release, 2024).
- In December 2024, the European Medicines Agency granted marketing authorization for Zoetis' new specialty drug, Cytopoint, for the treatment of atopic dermatitis in dogs. This approval marks a significant milestone for Zoetis and further solidifies its position as a leading player in the market (Zoetis press release, 2025).
Research Analyst Overview
The market is experiencing significant activity and trends in various areas of the veterinary industry. Veterinary epidemiology plays a crucial role in understanding the prevalence and spread of diseases among companion animals, driving the need for innovative treatments and therapies. Market analysis reveals a growing focus on antimicrobial resistance and the development of alternative treatments, such as Regenerative Medicine and targeted therapy. Professional societies and veterinary associations are at the forefront of veterinary research and drug discovery, collaborating with industry players to design clinical trials and implement post-marketing surveillance. Policy changes and regulatory landscape adjustments impact sales and distribution channels, necessitating effective business development strategies and customer relationship management.
Digital marketing, social media, and industry conferences serve as essential tools for industry players to showcase their competitive advantage and stay updated on the latest veterinary industry trends. The pandemic preparedness and food safety concerns have further accentuated the importance of veterinary public health and disease surveillance. Biosimilar drugs and therapeutic Monoclonal Antibodies are gaining traction in the market, offering cost-effective alternatives to traditional treatments. The veterinary industry is also embracing content marketing, public relations, and animal ethics to build trust and foster transparency with customers. Zoonotic diseases and veterinary drug residues remain key concerns, necessitating ongoing research and collaboration between industry stakeholders and regulatory bodies.
The integration of Stem Cell Therapy and animal production practices further underscores the market's commitment to advancing companion animal welfare.
Dive into Technavio's robust research methodology, blending expert interviews, extensive data synthesis, and validated models for unparalleled Companion Animal Specialty Drugs Market insights. See full methodology.
|
Market Scope |
|
|
Report Coverage |
Details |
|
Page number |
237 |
|
Base year |
2024 |
|
Historic period |
2019-2023 |
|
Forecast period |
2025-2029 |
|
Growth momentum & CAGR |
Accelerate at a CAGR of 7.4% |
|
Market growth 2025-2029 |
USD 6541.2 million |
|
Market structure |
Fragmented |
|
YoY growth 2024-2025(%) |
6.8 |
|
Key countries |
US, Canada, Germany, UK, Italy, France, China, India, Japan, Brazil, Egypt, UAE, Oman, Argentina, KSA, UAE, Brazil, and Rest of World (ROW) |
|
Competitive landscape |
Leading Companies, Market Positioning of Companies, Competitive Strategies, and Industry Risks |
What are the Key Data Covered in this Companion Animal Specialty Drugs Market Research and Growth Report?
- CAGR of the Companion Animal Specialty Drugs industry during the forecast period
- Detailed information on factors that will drive the growth and forecasting between 2025 and 2029
- Precise estimation of the size of the market and its contribution of the industry in focus to the parent market
- Accurate predictions about upcoming growth and trends and changes in consumer behaviour
- Growth of the market across North America, Europe, Asia, and Rest of World (ROW)
- Thorough analysis of the market's competitive landscape and detailed information about companies
- Comprehensive analysis of factors that will challenge the companion animal specialty drugs market growth of industry companies
We can help! Our analysts can customize this companion animal specialty drugs market research report to meet your requirements.
 RIA -
RIA - 
