Virtual Power Plant Market Analysis Europe, North America, APAC, Middle East and Africa, South America - US, Australia, Germany, UK, France - Size and Forecast 2024-2028

Virtual Power Plant Market Analysis Europe, North America, APAC, Middle East and Africa, South America - US, Australia, Germany, UK, France - Size and Forecast 2024-2028

Published: Feb 2024 185 Pages SKU: IRTNTR77277

Market Overview at a Glance

$11.13 B
Market Opportunity
25.66%
CAGR
25.46
YoY growth 2023-2024(%)

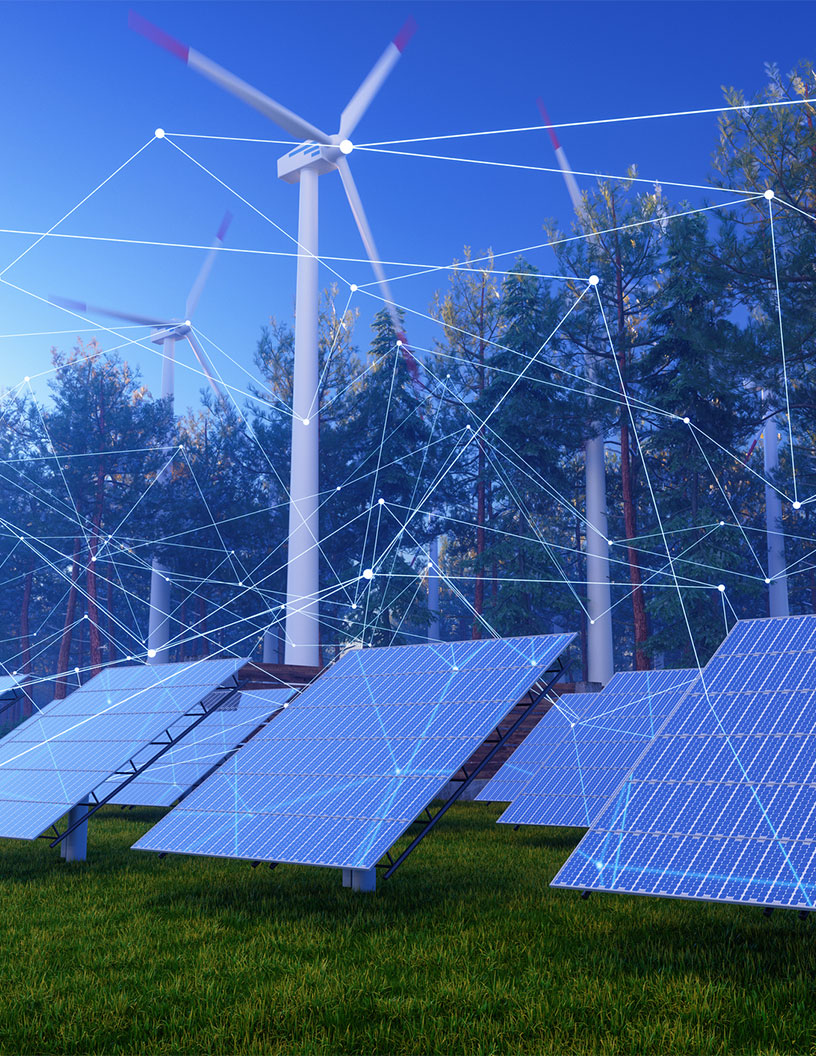
Virtual Power Plant Market Size 2024-2028

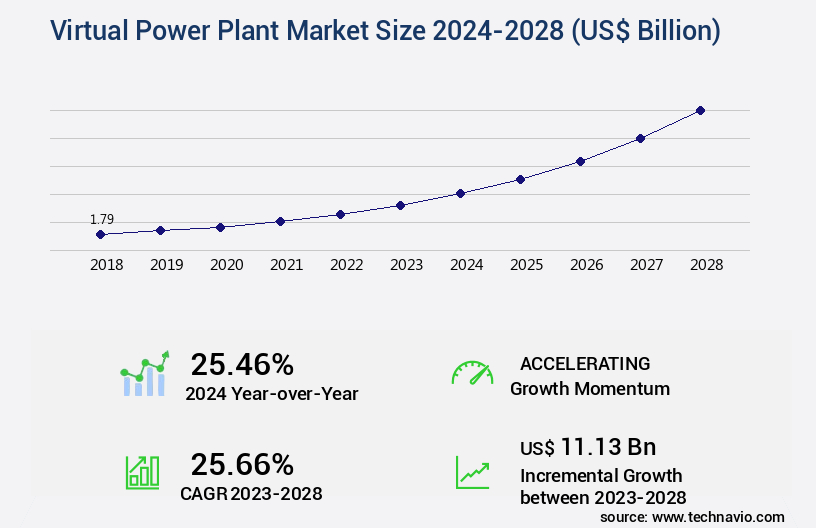
The virtual power plant market size is valued to increase USD 11.13 billion, at a CAGR of 25.66% from 2023 to 2028. Rising integration of renewable energy sources with electric power systems will drive the virtual power plant market.

Major Market Trends & Insights

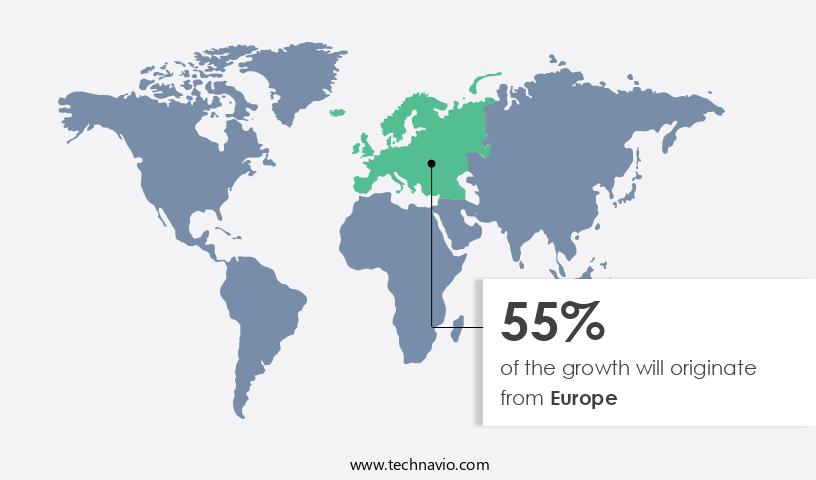
  • Europe dominated the market and accounted for a 55% growth during the forecast period.
  • By Technology - Mixed asset segment was valued at USD 1.18 billion in 2022
  • By End-user - Industrial segment accounted for the largest market revenue share in 2022

Market Size & Forecast

  • Market Opportunities: USD 814.58 billion
  • Market Future Opportunities: USD 11.13 billion
  • CAGR : 25.66%
  • Europe: Largest market in 2022

Market Summary

  • The market represents a dynamic and evolving sector, driven by the growing integration of renewable energy sources with electric power systems. With the increasing adoption of advanced technologies such as artificial intelligence (AI), machine learning, and data analytics, virtual power plants are becoming a crucial component of modern energy infrastructure. However, the market faces challenges, including the lack of expertise and inadequate infrastructure for virtual power plant implementation. According to a recent study, the renewable energy sector is expected to account for over 30% of the global power generation mix by 2025, driving the demand for virtual power plants to manage the intermittency of renewable energy sources.
  • This market is poised for significant growth, offering opportunities for technology providers, system integrators, and energy companies.

What will be the Size of the Virtual Power Plant Market during the forecast period?

Virtual Power Plant Market Size

Get Key Insights on Market Forecast (PDF) Request Free Sample

How is the Virtual Power Plant Market Segmented and what are the key trends of market segmentation?

The virtual power plant industry research report provides comprehensive data (region-wise segment analysis), with forecasts and estimates in "USD billion" for the period 2024-2028, as well as historical data from 2018-2022 for the following segments.

  • Technology
    • Mixed asset
    • Demand response
    • Distributed generation
  • End-user
    • Industrial
    • Commercial
    • Residential
  • Geography
    • North America
      • US
    • Europe
      • France
      • Germany
      • UK
    • APAC
      • Australia
    • Rest of World (ROW)

    By Technology Insights

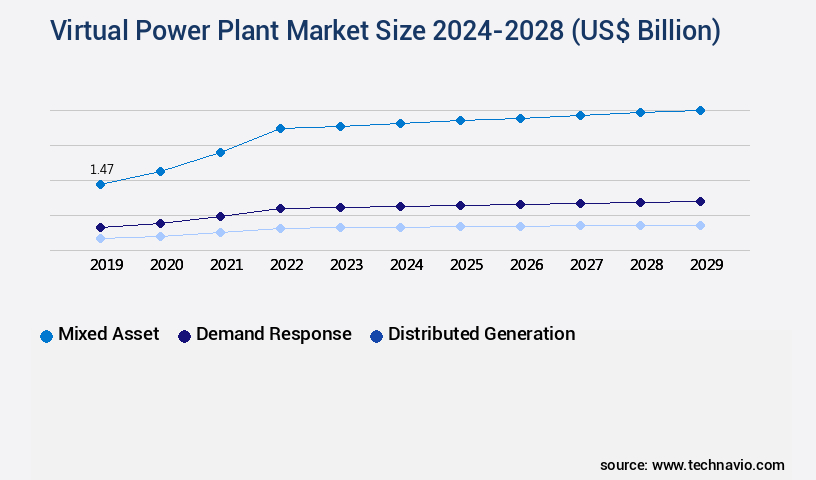
    The mixed asset segment is estimated to witness significant growth during the forecast period.

    In the dynamic the market, advanced metering infrastructure (AMI) plays a pivotal role in managing energy usage during peak demand or grid instability. AMI facilitates real-time monitoring of consumption patterns, enabling precise data collection for effective demand response management. Smart grid technologies, including power electronics converters and communication systems, facilitate seamless interaction between the central virtual power plant control system and distributed energy resources. These resources include smart appliances, batteries, renewable energy sources, and grid-scale energy storage. Automated controls and predictive analytics are essential components of virtual power plants, forecasting demand fluctuations and adjusting energy output accordingly.

    IoT devices enable remote access and control, optimizing energy usage based on predefined parameters or real-time pricing signals. Energy management systems coordinate diverse energy assets within the virtual power plant, ensuring efficient utilization and response to grid signals or market conditions. Key market trends include frequency regulation through cybersecurity protocols, real-time pricing, and ancillary service provision. Capacity market participation and energy arbitrage strategies are also driving growth. Power quality monitoring, distribution network optimization, and peak demand shaving are essential for maintaining power system stability. Blockchain technology and AI-driven energy management are emerging trends, offering improved security, transparency, and predictive capabilities.

    Renewable energy integration, fuel cell integration, power flow optimization, and distributed generation are crucial aspects of the evolving virtual power plant landscape. According to recent studies, approximately 25% of global electricity generation comes from renewable sources. Furthermore, industry experts anticipate that renewable energy integration will increase by 15% within the next five years. Energy storage optimization is projected to grow by 20% as grid modernization initiatives continue to unfold. Additionally, demand-side management is expected to expand by 18% as businesses and consumers seek to optimize energy usage and reduce costs.

    Virtual Power Plant Market Size

    Request Free Sample

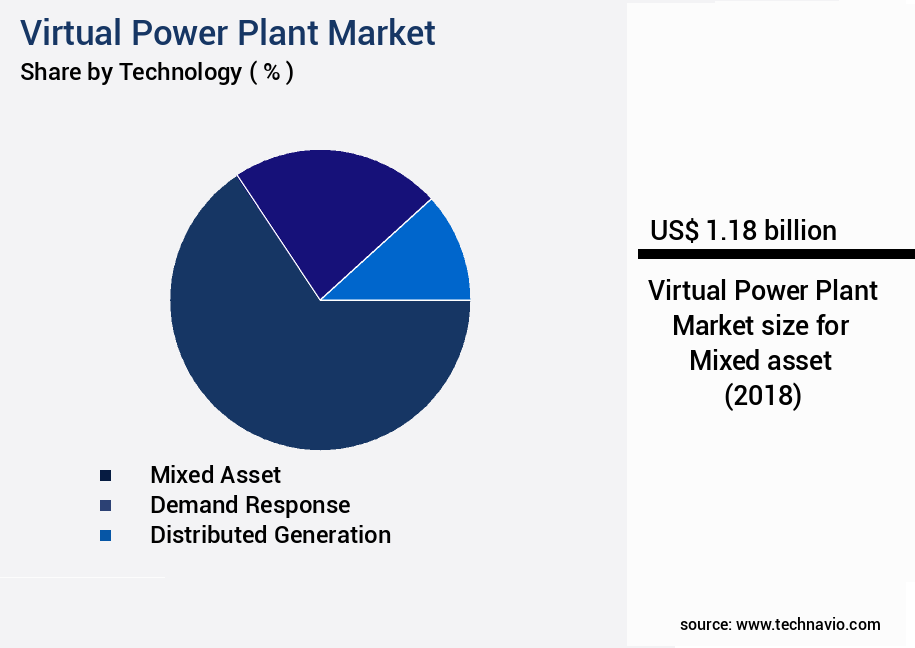
    The Mixed asset segment was valued at USD 1.18 billion in 2018 and showed a gradual increase during the forecast period.

    Virtual Power Plant Market Size

    Request Free Sample

    Regional Analysis

    Europe is estimated to contribute 55% to the growth of the global market during the forecast period.Technavio’s analysts have elaborately explained the regional trends and drivers that shape the market during the forecast period.

    Virtual Power Plant Market Share by Geography

    See How Virtual Power Plant Market Demand is Rising in Europe Request Free Sample

    The European energy landscape is witnessing a significant shift towards cleaner and more sustainable energy solutions, with Virtual Power Plants (VPPs) emerging as a key component. Governments, particularly in Germany and the UK, are actively promoting the growth of VPPs through various initiatives. In Germany, the Energiewende initiative, an energy transition policy, aims to adopt renewable energy sources and ensure sustainable development. VPPs, which enable the integration and coordination of distributed renewable energy sources, align perfectly with this objective. According to recent reports, the number of VPPs in operation in Germany has grown by over 30% in the last two years.

    Similarly, the UK government's Smart Export Guarantee scheme encourages the deployment of small-scale renewable energy systems and VPPs. These initiatives underscore the potential of VPPs in facilitating a more decentralized and flexible energy system, thereby contributing to a more sustainable energy future.

    Market Dynamics

    Our researchers analyzed the data with 2023 as the base year, along with the key drivers, trends, and challenges. A holistic analysis of drivers will help companies refine their marketing strategies to gain a competitive advantage.

    The market is a dynamic and evolving sector that focuses on the aggregation of distributed energy resources to optimize battery energy storage, integration of renewable energy sources, and implementation of demand response strategies. This market is witnessing significant growth due to the prediction of power system events, management of distributed generation assets, and control of microgrid stability. Virtual power plants play a crucial role in enhancing grid stability by enabling the operation of distributed generation assets and the optimization of renewable energy usage. The deployment of advanced metering infrastructure and utilization of energy storage systems are key drivers in the market.

    Real-time power system monitoring and design of smart inverter technologies are essential components of virtual power plants, enabling participation in wholesale electricity markets and optimization of renewable energy usage. The implementation of real-time pricing and analysis of power system dynamics further improves the efficiency of virtual power plants. Compared to traditional power plants, virtual power plants offer greater flexibility and resilience. More than 40% of new power generation capacity additions are expected to come from renewable energy sources by 2025, making virtual power plants an essential solution for integrating these intermittent sources into the power grid. The improvement of grid resilience is a significant concern for utilities and grid operators, and virtual power plants provide a cost-effective and efficient solution to address this challenge.

    In conclusion, the market is a rapidly growing sector that offers numerous benefits for the power industry. Its ability to optimize renewable energy usage, improve grid stability, and enhance grid resilience makes it an essential component of the future power grid. The market is expected to witness significant growth in the coming years, with a focus on the development of smart grid technologies and the implementation of real-time pricing and demand response strategies.

    Virtual Power Plant Market Size

    What are the key market drivers leading to the rise in the adoption of Virtual Power Plant Industry?

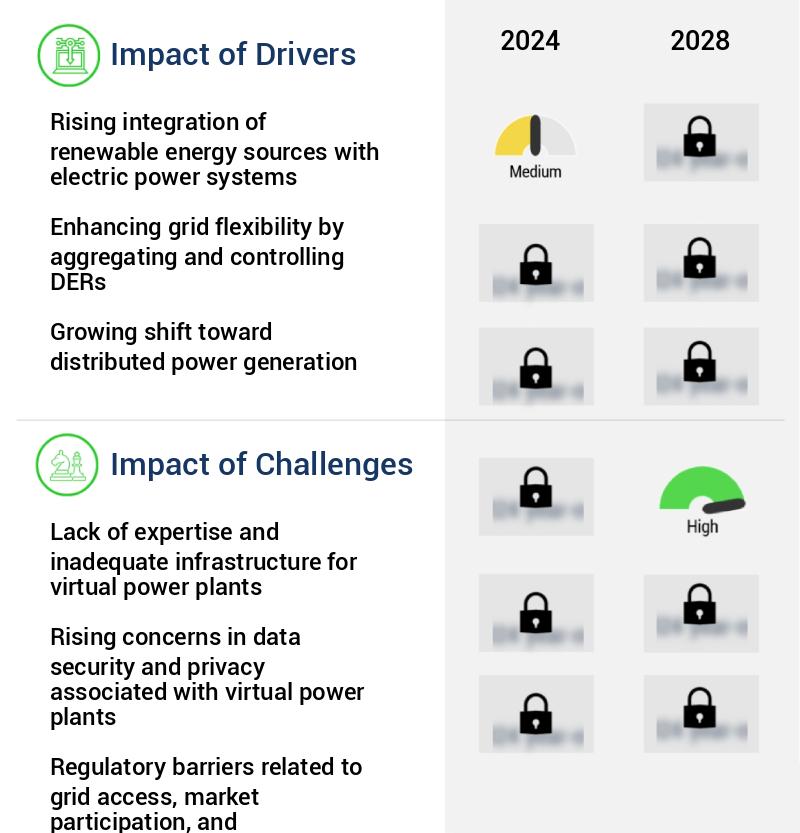
    • The integration of renewable energy sources into electric power systems is a mandatory and significant trend, driving market growth through the increased adoption and seamless fusion of sustainable energy technologies. 

    • Renewable energy integration with electric power systems is propelling the expansion and utilization of virtual power plants worldwide. Virtual power plants play a crucial role in addressing the intermittency and variability of renewable energy sources, such as solar and wind power, by consolidating and coordinating these distributed resources. Through sophisticated technology and predictive analytics, virtual power plants enable the smooth integration of renewables into the grid, effectively managing generation patterns to ensure a stable and dependable energy supply.
    • By pooling together various renewable sources, virtual power plants enhance the overall efficiency and reliability of the energy ecosystem.

    What are the market trends shaping the Virtual Power Plant Industry?

    • Artificial intelligence (AI), machine learning, and advanced data analytics are experiencing increased adoption in the market. This trend signifies the upcoming importance of these technologies.

    • The market is witnessing a significant shift towards the integration of artificial intelligence (AI), machine learning, and advanced data analytics. This trend is fueled by the increasing demand for intelligent and efficient energy management solutions. AI and machine learning algorithms are being employed to enhance the performance of virtual power plants by predicting energy demand, dynamically managing power generation sources, and boosting overall system efficiency. Advanced data analytics plays a pivotal role in processing the massive volume of data produced by virtual power plants.
    • Real-time monitoring of energy consumption trends, predictive maintenance of equipment, and identification of potential issues are some of the key applications of data analytics in this domain. The integration of these technologies is revolutionizing the energy sector by enabling more effective and responsive energy management, thereby ensuring a reliable and sustainable power supply.

    What challenges does the Virtual Power Plant Industry face during its growth?

    • The virtual power industry's growth is hindered by the combined challenges of insufficient expertise and inadequate infrastructure for implementing virtual power plants. 

    • Virtual power plants (VPPs) represent a promising solution for integrating distributed energy resources (DERs) into the power grid, enhancing energy efficiency and promoting renewable energy adoption. However, the deployment of VPPs faces significant challenges, primarily due to the expertise gap and insufficient infrastructure. The intricacy of VPP technologies necessitates a multidisciplinary skill set, including energy management, data analytics, software development, and grid integration. The scarcity of professionals competent in these domains restricts the design, execution, and maintenance of efficient VPP systems.
    • Moreover, existing infrastructure poses challenges, as many regions lack the necessary grid infrastructure to accommodate the integration of numerous DERs within VPPs. Upgrading infrastructure to enable bidirectional energy flow, data communication, and real-time control demands substantial investments and time. Despite these hurdles, the continuous evolution of technology and growing market adoption signal a promising future for virtual power plants.

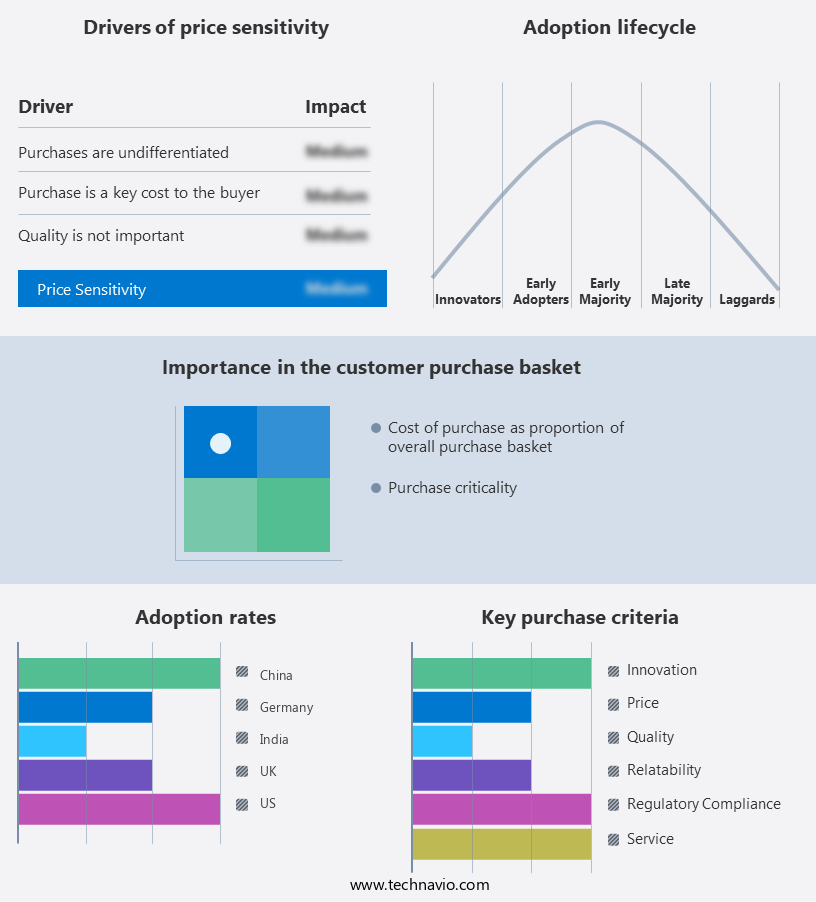
    Exclusive Technavio Analysis on Customer Landscape

    The virtual power plant market forecasting report includes the adoption lifecycle of the market, covering from the innovator’s stage to the laggard’s stage. It focuses on adoption rates in different regions based on penetration. Furthermore, the virtual power plant market report also includes key purchase criteria and drivers of price sensitivity to help companies evaluate and develop their market growth analysis strategies.

    Virtual Power Plant Market Share by Geography

     Customer Landscape of Virtual Power Plant Industry

    Competitive Landscape

    Companies are implementing various strategies, such as strategic alliances, virtual power plant market forecast, partnerships, mergers and acquisitions, geographical expansion, and product/service launches, to enhance their presence in the industry.

    ABB Ltd. - The company's virtual power plant, OPTIMAX PowerFit, is a software solution that optimizes the power output of distributed energy resources, including solar panels, wind turbines, and battery storage systems, by aggregating their capacity in real-time. This system enhances grid stability and efficiency, making it an essential component of the modern energy landscape.

    The industry research and growth report includes detailed analyses of the competitive landscape of the market and information about key companies, including:

    • ABB Ltd.
    • AGL Energy Ltd.
    • Duke Energy Corp.
    • Electricite de France SA
    • Enel Spa
    • ENGIE SA
    • Generac Holdings Inc.
    • Hitachi Ltd.
    • Honeywell International Inc.
    • Kyocera Corp.
    • Mitsubishi Electric Corp.
    • Next Kraftwerke GmbH
    • OhmConnect Inc.
    • Robert Bosch GmbH
    • RWE AG
    • Schneider Electric SE
    • Siemens AG
    • SolarHub
    • sonnen GmbH
    • Sunrun Inc.
    • Sunverge Energy Inc.
    • Tesla Inc.

    Qualitative and quantitative analysis of companies has been conducted to help clients understand the wider business environment as well as the strengths and weaknesses of key industry players. Data is qualitatively analyzed to categorize companies as pure play, category-focused, industry-focused, and diversified; it is quantitatively analyzed to categorize companies as dominant, leading, strong, tentative, and weak.

    Recent Development and News in Virtual Power Plant Market

    • In January 2024, Enel X, a leading energy services provider, announced the expansion of its Virtual Power Plant (VPP) network in the United States, integrating an additional 120 MW of distributed energy resources (DERs) into the grid (Enel X Press Release, 2024). This expansion increased the total capacity of Enel X's U.S. VPP to over 400 MW.
    • In March 2024, Siemens Energy and Shell New Energies entered into a strategic partnership to jointly develop and operate large-scale VPPs, aiming to integrate renewable energy sources and improve grid stability (Shell Newsroom, 2024). The collaboration combined Siemens Energy's VPP technology with Shell's renewable energy portfolio and market expertise.
    • In May 2024, Sonnen, a leading residential energy storage solutions provider, raised USD110 million in a Series D funding round, with plans to invest in expanding its VPP offerings and accelerating its global growth (Sonnen Press Release, 2024). This funding round brought Sonnen's total investment to over USD300 million.
    • In February 2025, the European Commission approved the Horizon Europe research and innovation program, which includes a €1 billion budget for the development and deployment of VPPs and other smart grid technologies (European Commission Press Release, 2025). This significant investment aims to support the European Union's transition to a carbon-neutral energy system by 2050.

    Dive into Technavio’s robust research methodology, blending expert interviews, extensive data synthesis, and validated models for unparalleled Virtual Power Plant Market insights. See full methodology.

    Market Scope

    Report Coverage

    Details

    Page number

    185

    Base year

    2023

    Historic period

    2018-2022

    Forecast period

    2024-2028

    Growth momentum & CAGR

    Accelerate at a CAGR of 25.66%

    Market growth 2024-2028

    USD 11.13 billion

    Market structure

    Fragmented

    YoY growth 2023-2024(%)

    25.46

    Key countries

    US, Australia, Germany, UK, and France

    Competitive landscape

    Leading Companies, Market Positioning of Companies, Competitive Strategies, and Industry Risks

    Request Free Sample

    Research Analyst Overview

    • In the dynamic and evolving landscape of the energy sector, the virtual power plant (VPP) market has emerged as a significant player. VPPs represent a network of distributed energy resources (DERs) connected and aggregated to function as a single controllable entity. This integration of advanced metering infrastructure, demand response aggregation, microgrid control, and renewable energy sources enables efficient energy management and grid stability. The integration of power electronics converters and energy storage optimization plays a crucial role in VPPs, allowing for real-time pricing and frequency regulation. Grid-scale energy storage and cybersecurity protocols ensure reliable and secure energy transactions in wholesale electricity markets.
    • The adoption of smart inverter technology, AI-driven energy management, and predictive maintenance further enhances the efficiency and performance of VPPs. The VPP market is characterized by the ongoing modernization of power systems, with initiatives focusing on capacity market participation, energy arbitrage strategies, distribution network optimization, peak demand shaving, and ancillary service provision. These efforts contribute to power system stability, improving overall grid performance and resilience. The integration of blockchain technology and data analytics platforms facilitates secure and transparent energy transactions. The implementation of voltage control systems, load forecasting algorithms, energy trading algorithms, and transmission network management further optimizes power flow and enhances the overall efficiency of the grid.
    • The VPP market is witnessing the integration of various DERs, including renewable energy sources, fuel cells, and distributed generation. This integration enables the provision of ancillary services, such as frequency regulation and power quality monitoring, ensuring grid reliability and stability. In summary, the market represents a dynamic and evolving sector, with ongoing initiatives focused on grid modernization, energy efficiency, and the integration of various distributed energy resources. The adoption of advanced technologies, such as AI, blockchain, and smart grid technologies, further enhances the performance and reliability of the grid.

    What are the Key Data Covered in this Virtual Power Plant Market Research and Growth Report?

    • What is the expected growth of the Virtual Power Plant Market between 2024 and 2028?

      • USD 11.13 billion, at a CAGR of 25.66%

    • What segmentation does the market report cover?

      • The report segmented by Technology (Mixed asset, Demand response, and Distributed generation), End-user (Industrial, Commercial, and Residential), and Geography (Europe, North America, APAC, Middle East and Africa, and South America)

    • Which regions are analyzed in the report?

      • Europe, North America, APAC, Middle East and Africa, and South America

    • What are the key growth drivers and market challenges?

      • Rising integration of renewable energy sources with electric power systems, Lack of expertise and inadequate infrastructure for virtual power plants

    • Who are the major players in the Virtual Power Plant Market?

      • Key Companies ABB Ltd., AGL Energy Ltd., Duke Energy Corp., Electricite de France SA, Enel Spa, ENGIE SA, Generac Holdings Inc., Hitachi Ltd., Honeywell International Inc., Kyocera Corp., Mitsubishi Electric Corp., Next Kraftwerke GmbH, OhmConnect Inc., Robert Bosch GmbH, RWE AG, Schneider Electric SE, Siemens AG, SolarHub, sonnen GmbH, Sunrun Inc., Sunverge Energy Inc., and Tesla Inc.

    Market Research Insights

    • The virtual power plant (VPP) market encompasses a range of technologies and services, including energy storage control, power flow studies, power system planning, grid congestion management, demand response programs, power system protection, state estimation algorithms, grid services market, load balancing algorithms, energy trading platform, grid resilience enhancement, data acquisition systems, renewable energy forecasting, power quality issues, microgrid operation, renewable portfolio standards, energy management system, grid stability analysis, real-time control, electric vehicle charging, capacity market, energy market regulations, smart meter deployment, transmission constraints, optimal power flow, distributed energy resources, power system simulation, and energy efficiency measures.
    • According to recent estimates, the global VPP market is projected to reach USD15 billion by 2025, growing at a compound annual growth rate (CAGR) of 12%. In contrast, the grid services market, a significant component of the VPP market, is anticipated to reach USD30 billion by 2027, expanding at a CAGR of 15%. These figures underscore the market's potential for significant growth and innovation.

    We can help! Our analysts can customize this virtual power plant market research report to meet your requirements.

    Get in touch

    1 Executive Summary

    • 1.1 Market overview
      • Exhibit 01: Executive Summary – Chart on Market Overview
      • Exhibit 02: Executive Summary – Data Table on Market Overview
      • Exhibit 03: Executive Summary – Chart on Global Market Characteristics
      • Exhibit 04: Executive Summary – Chart on Market by Geography
      • Exhibit 05: Executive Summary – Chart on Market Segmentation by Technology
      • Exhibit 06: Executive Summary – Chart on Market Segmentation by End-user
      • Exhibit 07: Executive Summary – Chart on Incremental Growth
      • Exhibit 08: Executive Summary – Data Table on Incremental Growth
      • Exhibit 09: Executive Summary – Chart on Vendor Market Positioning

    2 Market Landscape

    • 2.1 Market ecosystem
      • Exhibit 10: Parent market
      • Exhibit 11: Market Characteristics

    3 Market Sizing

    • 3.1 Market definition
      • Exhibit 12: Offerings of vendors included in the market definition
    • 3.2 Market segment analysis
      • Exhibit 13: Market segments
    • 3.3 Market size 2023
      • 3.4 Market outlook: Forecast for 2023-2028
        • Exhibit 14: Chart on Global - Market size and forecast 2023-2028 ($ billion)
        • Exhibit 15: Data Table on Global - Market size and forecast 2023-2028 ($ billion)
        • Exhibit 16: Chart on Global Market: Year-over-year growth 2023-2028 (%)
        • Exhibit 17: Data Table on Global Market: Year-over-year growth 2023-2028 (%)

      4 Historic Market Size

      • 4.1 Global virtual power plant market 2018 - 2022
        • Exhibit 18: Historic Market Size – Data Table on global virtual power plant market 2018 - 2022 ($ billion)
      • 4.2 Technology Segment Analysis 2018 - 2022
        • Exhibit 19: Historic Market Size – Technology Segment 2018 - 2022 ($ billion)
      • 4.3 End-user Segment Analysis 2018 - 2022
        • Exhibit 20: Historic Market Size – End-user Segment 2018 - 2022 ($ billion)
      • 4.4 Geography Segment Analysis 2018 - 2022
        • Exhibit 21: Historic Market Size – Geography Segment 2018 - 2022 ($ billion)
      • 4.5 Country Segment Analysis 2018 - 2022
        • Exhibit 22: Historic Market Size – Country Segment 2018 - 2022 ($ billion)

      5 Five Forces Analysis

      • 5.1 Five forces summary
        • Exhibit 23: Five forces analysis - Comparison between 2023 and 2028
      • 5.2 Bargaining power of buyers
        • Exhibit 24: Chart on Bargaining power of buyers – Impact of key factors 2023 and 2028
      • 5.3 Bargaining power of suppliers
        • Exhibit 25: Bargaining power of suppliers – Impact of key factors in 2023 and 2028
      • 5.4 Threat of new entrants
        • Exhibit 26: Threat of new entrants – Impact of key factors in 2023 and 2028
      • 5.5 Threat of substitutes
        • Exhibit 27: Threat of substitutes – Impact of key factors in 2023 and 2028
      • 5.6 Threat of rivalry
        • Exhibit 28: Threat of rivalry – Impact of key factors in 2023 and 2028
      • 5.7 Market condition
        • Exhibit 29: Chart on Market condition - Five forces 2023 and 2028

      6 Market Segmentation by Technology

      • 6.1 Market segments
        • Exhibit 30: Chart on Technology - Market share 2023-2028 (%)
        • Exhibit 31: Data Table on Technology - Market share 2023-2028 (%)
      • 6.2 Comparison by Technology
        • Exhibit 32: Chart on Comparison by Technology
        • Exhibit 33: Data Table on Comparison by Technology
      • 6.3 Mixed asset - Market size and forecast 2023-2028
        • Exhibit 34: Chart on Mixed asset - Market size and forecast 2023-2028 ($ billion)
        • Exhibit 35: Data Table on Mixed asset - Market size and forecast 2023-2028 ($ billion)
        • Exhibit 36: Chart on Mixed asset - Year-over-year growth 2023-2028 (%)
        • Exhibit 37: Data Table on Mixed asset - Year-over-year growth 2023-2028 (%)
      • 6.4 Demand response - Market size and forecast 2023-2028
        • Exhibit 38: Chart on Demand response - Market size and forecast 2023-2028 ($ billion)
        • Exhibit 39: Data Table on Demand response - Market size and forecast 2023-2028 ($ billion)
        • Exhibit 40: Chart on Demand response - Year-over-year growth 2023-2028 (%)
        • Exhibit 41: Data Table on Demand response - Year-over-year growth 2023-2028 (%)
      • 6.5 Distributed generation - Market size and forecast 2023-2028
        • Exhibit 42: Chart on Distributed generation - Market size and forecast 2023-2028 ($ billion)
        • Exhibit 43: Data Table on Distributed generation - Market size and forecast 2023-2028 ($ billion)
        • Exhibit 44: Chart on Distributed generation - Year-over-year growth 2023-2028 (%)
        • Exhibit 45: Data Table on Distributed generation - Year-over-year growth 2023-2028 (%)
      • 6.6 Market opportunity by Technology
        • Exhibit 46: Market opportunity by Technology ($ billion)
        • Exhibit 47: Data Table on Market opportunity by Technology ($ billion)

      7 Market Segmentation by End-user

      • 7.1 Market segments
        • Exhibit 48: Chart on End-user - Market share 2023-2028 (%)
        • Exhibit 49: Data Table on End-user - Market share 2023-2028 (%)
      • 7.2 Comparison by End-user
        • Exhibit 50: Chart on Comparison by End-user
        • Exhibit 51: Data Table on Comparison by End-user
      • 7.3 Industrial - Market size and forecast 2023-2028
        • Exhibit 52: Chart on Industrial - Market size and forecast 2023-2028 ($ billion)
        • Exhibit 53: Data Table on Industrial - Market size and forecast 2023-2028 ($ billion)
        • Exhibit 54: Chart on Industrial - Year-over-year growth 2023-2028 (%)
        • Exhibit 55: Data Table on Industrial - Year-over-year growth 2023-2028 (%)
      • 7.4 Commercial - Market size and forecast 2023-2028
        • Exhibit 56: Chart on Commercial - Market size and forecast 2023-2028 ($ billion)
        • Exhibit 57: Data Table on Commercial - Market size and forecast 2023-2028 ($ billion)
        • Exhibit 58: Chart on Commercial - Year-over-year growth 2023-2028 (%)
        • Exhibit 59: Data Table on Commercial - Year-over-year growth 2023-2028 (%)
      • 7.5 Residential - Market size and forecast 2023-2028
        • Exhibit 60: Chart on Residential - Market size and forecast 2023-2028 ($ billion)
        • Exhibit 61: Data Table on Residential - Market size and forecast 2023-2028 ($ billion)
        • Exhibit 62: Chart on Residential - Year-over-year growth 2023-2028 (%)
        • Exhibit 63: Data Table on Residential - Year-over-year growth 2023-2028 (%)
      • 7.6 Market opportunity by End-user
        • Exhibit 64: Market opportunity by End-user ($ billion)
        • Exhibit 65: Data Table on Market opportunity by End-user ($ billion)

      8 Customer Landscape

      • 8.1 Customer landscape overview
        • Exhibit 66: Analysis of price sensitivity, lifecycle, customer purchase basket, adoption rates, and purchase criteria

      9 Geographic Landscape

      • 9.1 Geographic segmentation
        • Exhibit 67: Chart on Market share by geography 2023-2028 (%)
        • Exhibit 68: Data Table on Market share by geography 2023-2028 (%)
      • 9.2 Geographic comparison
        • Exhibit 69: Chart on Geographic comparison
        • Exhibit 70: Data Table on Geographic comparison
      • 9.3 Europe - Market size and forecast 2023-2028
        • Exhibit 71: Chart on Europe - Market size and forecast 2023-2028 ($ billion)
        • Exhibit 72: Data Table on Europe - Market size and forecast 2023-2028 ($ billion)
        • Exhibit 73: Chart on Europe - Year-over-year growth 2023-2028 (%)
        • Exhibit 74: Data Table on Europe - Year-over-year growth 2023-2028 (%)
      • 9.4 North America - Market size and forecast 2023-2028
        • Exhibit 75: Chart on North America - Market size and forecast 2023-2028 ($ billion)
        • Exhibit 76: Data Table on North America - Market size and forecast 2023-2028 ($ billion)
        • Exhibit 77: Chart on North America - Year-over-year growth 2023-2028 (%)
        • Exhibit 78: Data Table on North America - Year-over-year growth 2023-2028 (%)
      • 9.5 APAC - Market size and forecast 2023-2028
        • Exhibit 79: Chart on APAC - Market size and forecast 2023-2028 ($ billion)
        • Exhibit 80: Data Table on APAC - Market size and forecast 2023-2028 ($ billion)
        • Exhibit 81: Chart on APAC - Year-over-year growth 2023-2028 (%)
        • Exhibit 82: Data Table on APAC - Year-over-year growth 2023-2028 (%)
      • 9.6 Middle East and Africa - Market size and forecast 2023-2028
        • Exhibit 83: Chart on Middle East and Africa - Market size and forecast 2023-2028 ($ billion)
        • Exhibit 84: Data Table on Middle East and Africa - Market size and forecast 2023-2028 ($ billion)
        • Exhibit 85: Chart on Middle East and Africa - Year-over-year growth 2023-2028 (%)
        • Exhibit 86: Data Table on Middle East and Africa - Year-over-year growth 2023-2028 (%)
      • 9.7 South America - Market size and forecast 2023-2028
        • Exhibit 87: Chart on South America - Market size and forecast 2023-2028 ($ billion)
        • Exhibit 88: Data Table on South America - Market size and forecast 2023-2028 ($ billion)
        • Exhibit 89: Chart on South America - Year-over-year growth 2023-2028 (%)
        • Exhibit 90: Data Table on South America - Year-over-year growth 2023-2028 (%)
      • 9.8 US - Market size and forecast 2023-2028
        • Exhibit 91: Chart on US - Market size and forecast 2023-2028 ($ billion)
        • Exhibit 92: Data Table on US - Market size and forecast 2023-2028 ($ billion)
        • Exhibit 93: Chart on US - Year-over-year growth 2023-2028 (%)
        • Exhibit 94: Data Table on US - Year-over-year growth 2023-2028 (%)
      • 9.9 Germany - Market size and forecast 2023-2028
        • Exhibit 95: Chart on Germany - Market size and forecast 2023-2028 ($ billion)
        • Exhibit 96: Data Table on Germany - Market size and forecast 2023-2028 ($ billion)
        • Exhibit 97: Chart on Germany - Year-over-year growth 2023-2028 (%)
        • Exhibit 98: Data Table on Germany - Year-over-year growth 2023-2028 (%)
      • 9.10 UK - Market size and forecast 2023-2028
        • Exhibit 99: Chart on UK - Market size and forecast 2023-2028 ($ billion)
        • Exhibit 100: Data Table on UK - Market size and forecast 2023-2028 ($ billion)
        • Exhibit 101: Chart on UK - Year-over-year growth 2023-2028 (%)
        • Exhibit 102: Data Table on UK - Year-over-year growth 2023-2028 (%)
      • 9.11 France - Market size and forecast 2023-2028
        • Exhibit 103: Chart on France - Market size and forecast 2023-2028 ($ billion)
        • Exhibit 104: Data Table on France - Market size and forecast 2023-2028 ($ billion)
        • Exhibit 105: Chart on France - Year-over-year growth 2023-2028 (%)
        • Exhibit 106: Data Table on France - Year-over-year growth 2023-2028 (%)
      • 9.12 Australia - Market size and forecast 2023-2028
        • Exhibit 107: Chart on Australia - Market size and forecast 2023-2028 ($ billion)
        • Exhibit 108: Data Table on Australia - Market size and forecast 2023-2028 ($ billion)
        • Exhibit 109: Chart on Australia - Year-over-year growth 2023-2028 (%)
        • Exhibit 110: Data Table on Australia - Year-over-year growth 2023-2028 (%)
      • 9.13 Market opportunity by geography
        • Exhibit 111: Market opportunity by geography ($ billion)
        • Exhibit 112: Data Tables on Market opportunity by geography ($ billion)

      10 Drivers, Challenges, and Trends

      • 10.1 Market drivers
        • 10.2 Market challenges
          • 10.3 Impact of drivers and challenges
            • Exhibit 113: Impact of drivers and challenges in 2023 and 2028
          • 10.4 Market trends

            11 Vendor Landscape

            • 11.1 Overview
              • 11.2 Vendor landscape
                • Exhibit 114: Overview on Criticality of inputs and Factors of differentiation
              • 11.3 Landscape disruption
                • Exhibit 115: Overview on factors of disruption
              • 11.4 Industry risks
                • Exhibit 116: Impact of key risks on business

              12 Vendor Analysis

              • 12.1 Vendors covered
                • Exhibit 117: Vendors covered
              • 12.2 Market positioning of vendors
                • Exhibit 118: Matrix on vendor position and classification
              • 12.3 ABB Ltd.
                • Exhibit 119: ABB Ltd. - Overview
                • Exhibit 120: ABB Ltd. - Business segments
                • Exhibit 121: ABB Ltd. - Key news
                • Exhibit 122: ABB Ltd. - Key offerings
                • Exhibit 123: ABB Ltd. - Segment focus
              • 12.4 Electricite de France SA
                • Exhibit 124: Electricite de France SA - Overview
                • Exhibit 125: Electricite de France SA - Business segments
                • Exhibit 126: Electricite de France SA - Key news
                • Exhibit 127: Electricite de France SA - Key offerings
                • Exhibit 128: Electricite de France SA - Segment focus
              • 12.5 Enel Spa
                • Exhibit 129: Enel Spa - Overview
                • Exhibit 130: Enel Spa - Product / Service
                • Exhibit 131: Enel Spa - Key offerings
              • 12.6 ENGIE SA
                • Exhibit 132: ENGIE SA - Overview
                • Exhibit 133: ENGIE SA - Business segments
                • Exhibit 134: ENGIE SA - Key offerings
                • Exhibit 135: ENGIE SA - Segment focus
              • 12.7 Generac Holdings Inc.
                • Exhibit 136: Generac Holdings Inc. - Overview
                • Exhibit 137: Generac Holdings Inc. - Business segments
                • Exhibit 138: Generac Holdings Inc. - Key offerings
                • Exhibit 139: Generac Holdings Inc. - Segment focus
              • 12.8 Hitachi Ltd.
                • Exhibit 140: Hitachi Ltd. - Overview
                • Exhibit 141: Hitachi Ltd. - Business segments
                • Exhibit 142: Hitachi Ltd. - Key news
                • Exhibit 143: Hitachi Ltd. - Key offerings
                • Exhibit 144: Hitachi Ltd. - Segment focus
              • 12.9 Honeywell International Inc.
                • Exhibit 145: Honeywell International Inc. - Overview
                • Exhibit 146: Honeywell International Inc. - Business segments
                • Exhibit 147: Honeywell International Inc. - Key news
                • Exhibit 148: Honeywell International Inc. - Key offerings
                • Exhibit 149: Honeywell International Inc. - Segment focus
              • 12.10 Kyocera Corp.
                • Exhibit 150: Kyocera Corp. - Overview
                • Exhibit 151: Kyocera Corp. - Business segments
                • Exhibit 152: Kyocera Corp. - Key news
                • Exhibit 153: Kyocera Corp. - Key offerings
                • Exhibit 154: Kyocera Corp. - Segment focus
              • 12.11 Mitsubishi Electric Corp.
                • Exhibit 155: Mitsubishi Electric Corp. - Overview
                • Exhibit 156: Mitsubishi Electric Corp. - Business segments
                • Exhibit 157: Mitsubishi Electric Corp. - Key news
                • Exhibit 158: Mitsubishi Electric Corp. - Key offerings
                • Exhibit 159: Mitsubishi Electric Corp. - Segment focus
              • 12.12 Next Kraftwerke GmbH
                • Exhibit 160: Next Kraftwerke GmbH - Overview
                • Exhibit 161: Next Kraftwerke GmbH - Product / Service
                • Exhibit 162: Next Kraftwerke GmbH - Key offerings
              • 12.13 RWE AG
                • Exhibit 163: RWE AG - Overview
                • Exhibit 164: RWE AG - Business segments
                • Exhibit 165: RWE AG - Key news
                • Exhibit 166: RWE AG - Key offerings
                • Exhibit 167: RWE AG - Segment focus
              • 12.14 Schneider Electric SE
                • Exhibit 168: Schneider Electric SE - Overview
                • Exhibit 169: Schneider Electric SE - Business segments
                • Exhibit 170: Schneider Electric SE - Key news
                • Exhibit 171: Schneider Electric SE - Key offerings
                • Exhibit 172: Schneider Electric SE - Segment focus
              • 12.15 Siemens AG
                • Exhibit 173: Siemens AG - Overview
                • Exhibit 174: Siemens AG - Business segments
                • Exhibit 175: Siemens AG - Key news
                • Exhibit 176: Siemens AG - Key offerings
                • Exhibit 177: Siemens AG - Segment focus
              • 12.16 Sunverge Energy Inc.
                • Exhibit 178: Sunverge Energy Inc. - Overview
                • Exhibit 179: Sunverge Energy Inc. - Product / Service
                • Exhibit 180: Sunverge Energy Inc. - Key offerings
              • 12.17 Tesla Inc.
                • Exhibit 181: Tesla Inc. - Overview
                • Exhibit 182: Tesla Inc. - Business segments
                • Exhibit 183: Tesla Inc. - Key news
                • Exhibit 184: Tesla Inc. - Key offerings
                • Exhibit 185: Tesla Inc. - Segment focus

              13 Appendix

              • 13.1 Scope of the report
                • 13.2 Inclusions and exclusions checklist
                  • Exhibit 186: Inclusions checklist
                  • Exhibit 187: Exclusions checklist
                • 13.3 Currency conversion rates for US$
                  • Exhibit 188: Currency conversion rates for US$
                • 13.4 Research methodology
                  • Exhibit 189: Research methodology
                  • Exhibit 190: Validation techniques employed for market sizing
                  • Exhibit 191: Information sources
                • 13.5 List of abbreviations
                  • Exhibit 192: List of abbreviations

                Research Methodology

                Technavio presents a detailed picture of the market by way of study, synthesis, and summation of data from multiple sources. The analysts have presented the various facets of the market with a particular focus on identifying the key industry influencers. The data thus presented is comprehensive, reliable, and the result of extensive research, both primary and secondary.

                INFORMATION SOURCES

                Primary sources

                • Manufacturers and suppliers
                • Channel partners
                • Industry experts
                • Strategic decision makers

                Secondary sources

                • Industry journals and periodicals
                • Government data
                • Financial reports of key industry players
                • Historical data
                • Press releases

                DATA ANALYSIS

                Data Synthesis

                • Collation of data
                • Estimation of key figures
                • Analysis of derived insights

                Data Validation

                • Triangulation with data models
                • Reference against proprietary databases
                • Corroboration with industry experts

                REPORT WRITING

                Qualitative

                • Market drivers
                • Market challenges
                • Market trends
                • Five forces analysis

                Quantitative

                • Market size and forecast
                • Market segmentation
                • Geographical insights
                • Competitive landscape

                Interested in this report?

                Get your sample now to see our research methodology and insights!

                Download Now

                Frequently Asked Questions

                Virtual Power Plant market growth will increase by $ 11.13 bn during 2024-2028 .

                The Virtual Power Plant market is expected to grow at a CAGR of 25.66% during 2024-2028 .

                Virtual Power Plant market is segmented by Technology( Mixed asset, Demand response, Distributed generation) End-user( Industrial, Commercial, Residential)

                ABB Ltd., AGL Energy Ltd., Duke Energy Corp., Electricite de France SA, Enel Spa, ENGIE SA, Generac Holdings Inc., Hitachi Ltd., Honeywell International Inc., Kyocera Corp., Mitsubishi Electric Corp., Next Kraftwerke GmbH, OhmConnect Inc., Robert Bosch GmbH, RWE AG, Schneider Electric SE, Siemens AG, SolarHub, sonnen GmbH, Sunrun Inc., Sunverge Energy Inc., Tesla Inc. are a few of the key vendors in the Virtual Power Plant market.

                Europe will register the highest growth rate of 55% among the other regions. Therefore, the Virtual Power Plant market in Europe is expected to garner significant business opportunities for the vendors during the forecast period.

                US, Australia, Germany, UK, France

                • Rising integration of renewable energy sources with electric power systemsRenewable energy integration with electric power systems serves as a significant driver in the development and adoption of global virtual power plants. Virtual power plants play a pivotal role in overcoming the intermittent and variability of renewable energy sources such as solar and wind power is the driving factor this market.
                • by aggregating and orchestrating these distributed resources. Virtual power plants facilitate the seamless integration of renewables into the grid by efficiently managing their generation patterns. They leverage advanced technologies and predictive analytics to forecast renewable energy availability and match it with demand fluctuations. By aggregating diverse renewable sources is the driving factor this market.
                • virtual power plants create a more stable and reliable energy supply. One of its example is the Hornsdale Power Reserve in South Australia is the driving factor this market.
                • operated by Tesla. This facility incorporates a large-scale battery system connected to wind farms. Through its virtual power plant capabilities is the driving factor this market.
                • the battery system provides grid stability by instantly injecting stored energy when needed is the driving factor this market.
                • smoothing out fluctuations in wind power output and supporting the grid during peak demand periods or unforeseen disruptions. Renewable energy integration via virtual power plants not only supports grid stability but also contributes to the global transition towards cleaner and more sustainable energy systems is the driving factor this market.
                • reducing reliance on fossil fuels and mitigating environmental impacts. As renewable energy penetration increases is the driving factor this market.
                • virtual power plants will continue to play a vital role in optimizing their utilization and ensuring grid reliability. Thus is the driving factor this market.
                • an increase in the integration of renewable energy sources boosts the growth of the global virtual power plant market during the forecast period. is the driving factor this market.

                The Virtual Power Plant market vendors should focus on grabbing business opportunities from the Mixed asset segment as it accounted for the largest market share in the base year.