Virtual Queuing System Market Analysis North America, Europe, APAC, Middle East and Africa, South America - US, UK, Canada, Germany, China, Japan, France, India, Brazil, South Korea - Size and Forecast 2025-2029

Virtual Queuing System Market Analysis North America, Europe, APAC, Middle East and Africa, South America - US, UK, Canada, Germany, China, Japan, France, India, Brazil, South Korea - Size and Forecast 2025-2029

Published: Dec 2024 198 Pages SKU: IRTNTR80491

Market Overview at a Glance

$106.4 Mn
Market Opportunity
6.3%
CAGR
6.2
YoY growth 2024-2025(%)

What is the Virtual Queuing System Market Size?

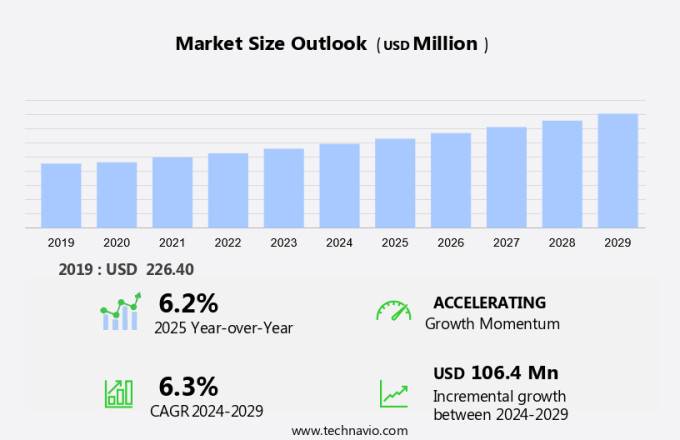
The virtual queuing system market size is forecast to increase by USD 106.4 million,  at a CAGR of 6.3% between 2024 and 2029. The market is experiencing significant growth due to several key factors. One major driver is the increasing investment in technology integration, particularly with artificial intelligence (AI), to enhance customer experience and streamline operations. However, high subscription costs can be a challenge for smaller businesses and organizations. Another trend in the market is the growing preference for contactless solutions in the wake of the COVID-19 pandemic. Virtual queuing systems offer a touchless alternative to traditional queuing methods, making them an attractive option for businesses looking to prioritize health and safety while maintaining efficiency. Overall, the market is expected to continue growing as businesses seek to improve customer experience, increase operational efficiency, and adapt to changing consumer preferences.

What will be the size of the Market during the forecast period?

Virtual Queuing System Market Size

Request Free Virtual Queuing System Market Sample

Market Segmentation

The market research report provides comprehensive data (region-wise segment analysis), with forecasts and estimates in "USD million" for the period 2025-2029, as well as historical data from 2019 - 2023 for the following segments.
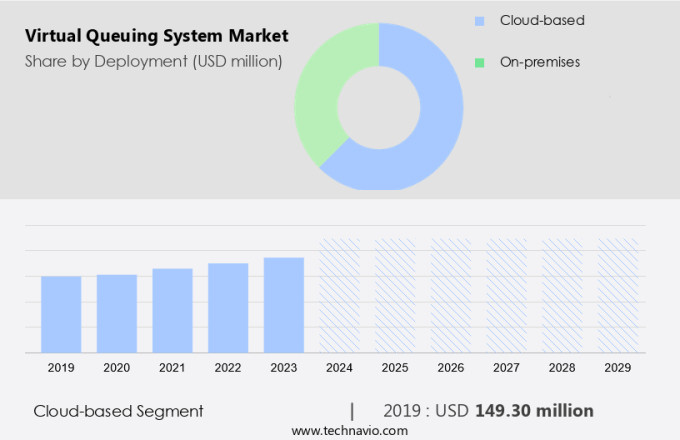
  • Deployment
    • Cloud-based
    • On-premises
  • End-user
    • Retail
    • Healthcare
    • BFSI
    • Telecommunication
    • Others
  • Geography
    • North America
      • Canada
      • US
    • Europe
      • Germany
      • UK
      • France
    • APAC
      • China
      • India
      • Japan
      • South Korea
    • Middle East and Africa
    • South America
      • Brazil

Which is the largest segment driving market growth?

The cloud-based segment is estimated to witness significant growth during the forecast period. The market is witnessing substantial growth due to its cost-effective and flexible deployment model. Cloud-based queue systems eliminate the need for expensive on-premises hardware, providing a streamlined and scalable solution for managing customer queues.

Virtual Queuing System Market Size

Get a glance at the market share of various regions. Download the PDF Sample

The cloud-based segment was valued at USD 149.30 million in 2019.  An illustrative example is the SEDCO cloud-based queue system, which offers businesses a cost-efficient alternative by hosting the queue management software on the cloud. This approach simplifies IT infrastructure requirements, enabling businesses to implement the system as a purely software-based solution. Optional hardware components, such as ticketing kiosks or digital screens, can be integrated based on specific business needs, providing additional functionality. Cloud-based virtual queuing systems improve operational efficiency by reducing wait times and enhancing customer response, resulting in positive interactions and increased customer satisfaction. Point-of-sale systems can also be integrated with virtual queuing systems for seamless transactions, further increasing efficiency and staff productivity.

Which region is leading the market?

Virtual Queuing System Market Share by Geography

For more insights on the market share of various regions, Request Free Sample

North America is estimated to contribute 37% to the growth of the global market during the forecast period. Technavio's analysts have elaborately explained the regional trends and drivers that shape the market during the forecast period.  The market in North America is experiencing growth due to the integration of advanced technologies to improve customer experiences across various sectors. For instance, Universal Studios Florida introduced a virtual queuing system for its Mardi Gras celebrations in 2024, allowing guests to join a virtual queue via the Official Universal Orlando App for a fair opportunity to participate in the parade and manage crowd flow efficiently. This initiative is part of a larger trend towards automation in the public sector, including transportation and post-service industries, to enhance employee satisfaction and efficiency. Cloud computing technology is also playing a significant role in the adoption of virtual queuing systems, enabling real-time data processing and seamless integration with mobile applications. Emerging technologies, such as artificial intelligence and machine learning, are expected to further propel the market forward.

How do company ranking index and market positioning come to your aid?

Companies are implementing various strategies, such as strategic alliances, partnerships, mergers and acquisitions, geographical expansion, and product/service launches, to enhance their presence in the market.

ezTurns - The company offers virtual queuing systems that allow customers and visitors to enter a wait by using a manual dispenser or a self-service ticketing kiosk.

Technavio provides the ranking index for the top 12 companies along with insights on the market positioning of:

  • JRNI
  • Lucep Pte Ltd
  • Netsol IT Solutions Pvt. Ltd.
  • QLESS Inc.
  • Q-MATIC Group AB
  • Qminder Ltd.
  • Q-nomy Inc.
  • Queue it
  • Qwaiting
  • Waitwhile Inc.
  • Wavetec

Explore our company rankings and market positioning. Request Free Sample

How can Technavio assist you in making critical decisions?

Virtual Queuing System Market Size

What is the market structure and year-over-year growth of the Market?

Market structure

Concentrated

YoY growth 2024-2025

6.2

Market Dynamics

Virtual queuing systems have gained significant traction in various industries, particularly in healthcare, as they offer numerous benefits in terms of visitor security, customer interaction, and operational efficiency. These systems enable real-time queue monitoring and management, allowing businesses to analyze customer flow and optimize wait times, ultimately improving customer experience. In healthcare settings, virtual queuing systems are essential for managing patient traffic and ensuring social distancing. They facilitate customer request handling and hospital queue management, reducing wait times and enhancing patient satisfaction. The use of queue analytics dashboards provides valuable insights into patient flow, enabling healthcare providers to make data-driven decisions and improve service efficiency. The implementation of virtual queuing systems extends beyond hospitals to public transportation and clinic management. These solutions enable smart queue management, automating customer service processes and optimizing customer traffic flow.

In addition, telemedicine applications also benefit from virtual queuing systems, streamlining patient engagement and improving healthcare marketing efforts. Healthcare IT professionals recognize the importance of queue management software in enhancing operational efficiency and ROI. The integration of digital signage and patient portals further enhances the patient experience, providing real-time updates and reducing the need for in-person interactions. Healthcare technology continues to evolve, with queue management software offering advanced features such as appointment scheduling, hospital management, and clinic management solutions. The focus on healthcare security ensures that these systems adhere to the highest standards, safeguarding sensitive patient information and maintaining brand reputation. Our researchers analyzed the data with 2024 as the base year, along with the key drivers, trends, and challenges. A holistic analysis of drivers will help companies refine their marketing strategies to gain a competitive advantage.

What are the primary factors driving the market growth?

High levels of investment are notably driving market growth. The market is experiencing significant growth, driven by investments in advanced technologies such as artificial intelligence (AI) and cloud computing. Moreover, the integration of AI and machine learning in virtual queuing systems enables continuous improvement and real-time data analytics. This results in increased employee efficiency, productivity, and customer engagement. In the public sector, virtual queuing systems are increasingly being adopted for post-service applications, such as appointment scheduling and patient flow optimization. Connected devices, sensor data, and digital displays are also essential components of virtual queuing systems. These technologies enable real-time information sharing, resource utilization, and customer mobility. Furthermore, backend software and data governance platforms ensure data accuracy and security, while self-service kiosks and social distancing measures enhance the customer experience. Infrastructure providers and component manufacturers are key players in the market. Their solutions cater to various industries, including healthcare, hospitality, and public transportation.

The adoption of virtual queuing systems in public transportation networks has been particularly noteworthy, as it addresses the challenges of managing customer queues and response times in a complex environment. The initial set-up cost of a virtual queuing system can be a barrier to entry for some organizations. However, the long-term benefits, including improved operational efficiency, staff productivity, and customer satisfaction, often outweigh the investment. Furthermore, the integration of AI and machine learning enables continuous improvement and adaptability, making virtual queuing systems a valuable investment for organizations seeking to enhance their customer experience and streamline their operations. Thus, such factors are driving the growth of the market during the forecast period.

What are the significant trends being witnessed in the market?

Integration with AI is an emerging trend shaping the market growth. The market is experiencing substantial growth due to the integration of advanced technologies such as artificial intelligence (AI), machine learning, and cloud computing. In the transportation sector, AI is being utilized to enhance passenger flow management, with major international airports like JFK International Air Terminal in the US partnering with tech firms to implement AI-driven strategies. These systems utilize real-time data to monitor passenger flow, security checkpoint wait times, and gate locations, enabling the forecasting of peak periods and optimizing staffing levels and queue management strategies. In healthcare, virtual queuing systems are streamlining patient journeys, improving patient experience, and increasing operational efficiency. These systems offer appointment scheduling, patient flow optimization, and resource allocation, while also ensuring social distancing and reducing inaccuracies in customers' requests.

In the retail sector, virtual queuing systems are boosting customer engagement and productivity by reducing wait times and improving customer traffic management. Additionally, the integration of sensor data from connected devices and data analytics is enabling continuous improvement and data governance platforms to ensure data security and accuracy. Overall, virtual queuing systems are transforming various industries by increasing employee satisfaction, employee efficiency, and resource utilization, while also enhancing the customer experience. The initial set-up cost may be a consideration, but the return on investment is significant due to the operational efficiency and productivity gains. Thus, such market trends will shape the growth of the market during the forecast period.

What are the major market challenges?

High subscription costs are a significant challenge hindering market growth. The market is experiencing significant growth due to the increasing demand for automation and efficiency in various sectors, including public transportation, healthcare, hospitality, and retail. Service providers offer a range of modules, such as appointment scheduling, customer traffic management, and on-screen information display, to optimize queue management and improve the customer experience. Cloud computing technology enables real-time data access and analysis, allowing for continuous improvement and resource utilization. However, the high subscription costs associated with these solutions can be a barrier for small businesses and organizations. Emerging technologies like artificial intelligence, machine learning, blockchain, and data governance platforms are being integrated into virtual queuing systems to enhance customer engagement and streamline operations. These technologies enable personalized interactions, real-time data analysis, and improved resource allocation. Moreover, the use of connected devices, sensor data, and digital displays enables real-time queue management and customer response, ensuring operational efficiency and staff productivity. In the healthcare sector, virtual queuing systems are improving patient journeys, optimizing patient flow, and enhancing patient experience. In the public sector, these systems are streamlining service delivery and improving customer mobility.

Infrastructure providers and component manufacturers are investing in the development of innovative virtual queuing solutions, focusing on appointment scheduling complexity, customer traffic management, and self-service kiosks. The adoption of these systems is expected to increase as organizations seek to improve operational efficiency, reduce inaccuracies, and enhance customer satisfaction. Despite the initial set-up cost, the return on investment for virtual queuing systems is significant, with improvements in patient outcomes, resource allocation, and staff productivity. Organizations can also leverage data analytics to gain insights into customer behavior and preferences, enabling targeted marketing and improved customer engagement. Hence, the above factors will impede the growth of the market during the forecast period.

Exclusive Customer Landscape

The market forecasting report includes the adoption lifecycle of the market research and growth, covering from the innovator's stage to the laggard's stage. It focuses on adoption rates in different regions based on penetration. Furthermore, the report also includes key purchase criteria and drivers of price sensitivity to help companies evaluate and develop their market growth analysis strategies.
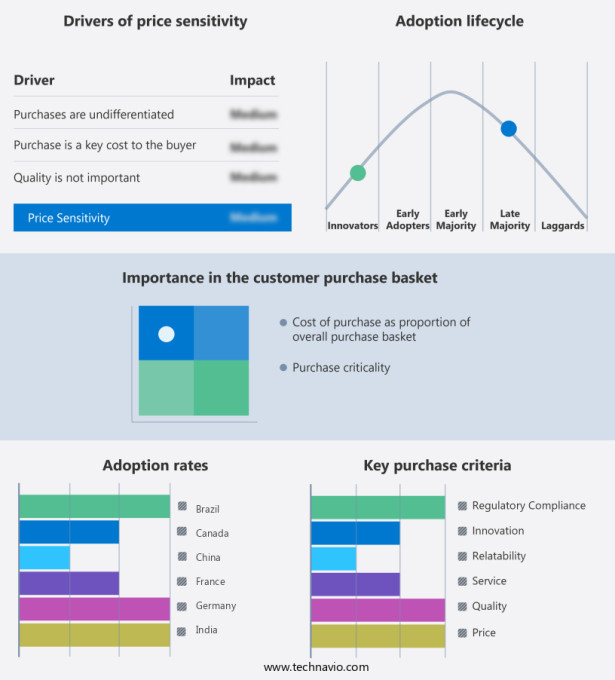
Virtual Queuing System Market Share by Geography

 Customer Landscape

Market Analyst Overview

Virtual queuing systems have gained significant traction in various industries, including public transportation, healthcare, hospitality, and the public sector. These systems enable organizations to optimize customer flow, improve employee efficiency, and enhance the overall customer experience. The adoption of virtual queuing systems is driven by several factors. Automation plays a crucial role in reducing the workload on staff and minimizing inaccuracies in queues. Cloud computing facilitates the implementation of these systems, allowing for continuous improvement and easy integration with other business applications. Employee satisfaction is another key factor influencing the market. Virtual queuing systems enable staff to focus on more complex tasks, freeing them from the tedious process of managing customer queues manually. Moreover, these systems provide on-screen information, allowing employees to monitor queue status and customer traffic in real-time. Emerging technologies, such as artificial intelligence (AI) and machine learning, are transforming virtual queuing systems.

These technologies enable predictive analytics, personalized customer engagement, and real-time resource allocation. Blockchain technology, on the other hand, ensures data security and transparency, making virtual queuing systems more reliable and trustworthy. Funding is a critical consideration for organizations looking to implement virtual queuing systems. Component manufacturers and infrastructure providers offer financing options, making it easier for organizations to invest in these systems. Sensor data and connected devices provide valuable insights into customer traffic and queue management, enabling organizations to optimize their operations and maximize their return on investment. Public transportation networks have been early adopters of virtual queuing systems. These systems enable efficient management of customer queues, reduce wait times, and improve customer response. In the healthcare sector, virtual queuing systems optimize patient journeys, improve appointment scheduling, and enhance patient outcomes.

Market Scope

Report Coverage

Details

Page number

198

Base year

2024

Historic period

2019 - 2023

Forecast period

2025-2029

Growth momentum & CAGR

Accelerate at a CAGR of 6.3%

Market Growth 2025-2029

USD 106.4 million

Regional analysis

North America, Europe, APAC, Middle East and Africa, and South America

Performing market contribution

North America at 37%

Key countries

US, UK, Canada, Germany, China, Japan, France, India, Brazil, and South Korea

Competitive landscape

Leading Companies, Market Positioning of Companies, Competitive Strategies, and Industry Risks

Key companies profiled

ezTurns, JRNI, Lucep Pte Ltd, Netsol IT Solutions Pvt. Ltd., QLESS Inc., Q-MATIC Group AB, Qminder Ltd., Q-nomy Inc., Queue it, Qwaiting, Waitwhile Inc., and Wavetec

Market Segmentation

Deployment (Cloud-based and On-premises), End-user (Retail, Healthcare, BFSI, Telecommunication, and Others), and Geography (North America, Europe, APAC, Middle East and Africa, and South America)

Customization purview

If our market report has not included the data that you are looking for, you can reach out to our analysts and get segments customized.

Download PDF Sample

What are the Key Data Covered in this Market Research Report?

  • CAGR of the market during the market forecast period
  • Detailed information on factors that will drive the market growth and forecasting between 2025 and 2029
  • Precise estimation of the size of the market  and its contribution of the market in focus to the parent market
  • Accurate predictions about upcoming market growth and trends and changes in consumer behavior
  • Growth of the market across North America, Europe, APAC, Middle East and Africa, and South America
  • Thorough analysis of the market's competitive landscape and detailed information about companies
  • Comprehensive analysis of factors that will challenge the growth of market companies

1 Executive Summary

  • 1.1 Market overview
    • Executive Summary - Chart on Market Overview
    • Executive Summary - Data Table on Market Overview
    • Executive Summary - Chart on Global Market Characteristics
    • Executive Summary - Chart on Market by Geography
    • Executive Summary - Chart on Market Segmentation by Deployment
    • Executive Summary - Chart on Market Segmentation by End-user
    • Executive Summary - Chart on Incremental Growth
    • Executive Summary - Data Table on Incremental Growth
    • Executive Summary - Chart on Company Market Positioning

2 Technavio Analysis

  • 2.1 Analysis of price sensitivity, lifecycle, customer purchase basket, adoption rates, and purchase criteria
    • Analysis of price sensitivity, lifecycle, customer purchase basket, adoption rates, and purchase criteria
  • 2.2 Criticality of inputs and Factors of differentiation
    • Overview on criticality of inputs and factors of differentiation
  • 2.3 Factors of disruption
    • Overview on factors of disruption
  • 2.4 Impact of drivers and challenges
    • Impact of drivers and challenges in 2024 and 2029

3 Market Landscape

  • 3.1 Market ecosystem
    • Parent Market
    • Data Table on - Parent Market
  • 3.2 Market characteristics
    • Market characteristics analysis
  • 3.3 Value chain analysis
    • Value chain analysis

4 Market Sizing

  • 4.1 Market definition
    • Offerings of companies included in the market definition
  • 4.2 Market segment analysis
    • Market segments
  • 4.3 Market size 2024
    • 4.4 Market outlook: Forecast for 2024-2029
      • Chart on Global - Market size and forecast 2024-2029 ($ million)
      • Data Table on Global - Market size and forecast 2024-2029 ($ million)
      • Chart on Global Market: Year-over-year growth 2024-2029 (%)
      • Data Table on Global Market: Year-over-year growth 2024-2029 (%)

    5 Historic Market Size

    • 5.1 Global Virtual Queuing System Market 2019 - 2023
      • Historic Market Size - Data Table on Global Virtual Queuing System Market 2019 - 2023 ($ million)
    • 5.2 Deployment segment analysis 2019 - 2023
      • Historic Market Size - Deployment Segment 2019 - 2023 ($ million)
    • 5.3 End-user segment analysis 2019 - 2023
      • Historic Market Size - End-user Segment 2019 - 2023 ($ million)
    • 5.4 Geography segment analysis 2019 - 2023
      • Historic Market Size - Geography Segment 2019 - 2023 ($ million)
    • 5.5 Country segment analysis 2019 - 2023
      • Historic Market Size - Country Segment 2019 - 2023 ($ million)

    6 Qualitative Analysis

    • 6.1 Impact of AI in the Global Virtual Queuing System Market

      7 Five Forces Analysis

      • 7.1 Five forces summary
        • Five forces analysis - Comparison between 2024 and 2029
      • 7.2 Bargaining power of buyers
        • Bargaining power of buyers - Impact of key factors 2024 and 2029
      • 7.3 Bargaining power of suppliers
        • Bargaining power of suppliers - Impact of key factors in 2024 and 2029
      • 7.4 Threat of new entrants
        • Threat of new entrants - Impact of key factors in 2024 and 2029
      • 7.5 Threat of substitutes
        • Threat of substitutes - Impact of key factors in 2024 and 2029
      • 7.6 Threat of rivalry
        • Threat of rivalry - Impact of key factors in 2024 and 2029
      • 7.7 Market condition
        • Chart on Market condition - Five forces 2024 and 2029

      8 Market Segmentation by Deployment

      • 8.1 Market segments
        • Chart on Deployment - Market share 2024-2029 (%)
        • Data Table on Deployment - Market share 2024-2029 (%)
      • 8.2 Comparison by Deployment
        • Chart on Comparison by Deployment
        • Data Table on Comparison by Deployment
      • 8.3 Cloud-based - Market size and forecast 2024-2029
        • Chart on Cloud-based - Market size and forecast 2024-2029 ($ million)
        • Data Table on Cloud-based - Market size and forecast 2024-2029 ($ million)
        • Chart on Cloud-based - Year-over-year growth 2024-2029 (%)
        • Data Table on Cloud-based - Year-over-year growth 2024-2029 (%)
      • 8.4 On-premises - Market size and forecast 2024-2029
        • Chart on On-premises - Market size and forecast 2024-2029 ($ million)
        • Data Table on On-premises - Market size and forecast 2024-2029 ($ million)
        • Chart on On-premises - Year-over-year growth 2024-2029 (%)
        • Data Table on On-premises - Year-over-year growth 2024-2029 (%)
      • 8.5 Market opportunity by Deployment
        • Market opportunity by Deployment ($ million)
        • Data Table on Market opportunity by Deployment ($ million)

      9 Market Segmentation by End-user

      • 9.1 Market segments
        • Chart on End-user - Market share 2024-2029 (%)
        • Data Table on End-user - Market share 2024-2029 (%)
      • 9.2 Comparison by End-user
        • Chart on Comparison by End-user
        • Data Table on Comparison by End-user
      • 9.3 Retail - Market size and forecast 2024-2029
        • Chart on Retail - Market size and forecast 2024-2029 ($ million)
        • Data Table on Retail - Market size and forecast 2024-2029 ($ million)
        • Chart on Retail - Year-over-year growth 2024-2029 (%)
        • Data Table on Retail - Year-over-year growth 2024-2029 (%)
      • 9.4 Healthcare - Market size and forecast 2024-2029
        • Chart on Healthcare - Market size and forecast 2024-2029 ($ million)
        • Data Table on Healthcare - Market size and forecast 2024-2029 ($ million)
        • Chart on Healthcare - Year-over-year growth 2024-2029 (%)
        • Data Table on Healthcare - Year-over-year growth 2024-2029 (%)
      • 9.5 BFSI - Market size and forecast 2024-2029
        • Chart on BFSI - Market size and forecast 2024-2029 ($ million)
        • Data Table on BFSI - Market size and forecast 2024-2029 ($ million)
        • Chart on BFSI - Year-over-year growth 2024-2029 (%)
        • Data Table on BFSI - Year-over-year growth 2024-2029 (%)
      • 9.6 Telecommunication - Market size and forecast 2024-2029
        • Chart on Telecommunication - Market size and forecast 2024-2029 ($ million)
        • Data Table on Telecommunication - Market size and forecast 2024-2029 ($ million)
        • Chart on Telecommunication - Year-over-year growth 2024-2029 (%)
        • Data Table on Telecommunication - Year-over-year growth 2024-2029 (%)
      • 9.7 Others - Market size and forecast 2024-2029
        • Chart on Others - Market size and forecast 2024-2029 ($ million)
        • Data Table on Others - Market size and forecast 2024-2029 ($ million)
        • Chart on Others - Year-over-year growth 2024-2029 (%)
        • Data Table on Others - Year-over-year growth 2024-2029 (%)
      • 9.8 Market opportunity by End-user
        • Market opportunity by End-user ($ million)
        • Data Table on Market opportunity by End-user ($ million)

      10 Customer Landscape

      • 10.1 Customer landscape overview
        • Analysis of price sensitivity, lifecycle, customer purchase basket, adoption rates, and purchase criteria

      11 Geographic Landscape

      • 11.1 Geographic segmentation
        • Chart on Market share by geography 2024-2029 (%)
        • Data Table on Market share by geography 2024-2029 (%)
      • 11.2 Geographic comparison
        • Chart on Geographic comparison
        • Data Table on Geographic comparison
      • 11.3 North America - Market size and forecast 2024-2029
        • Chart on North America - Market size and forecast 2024-2029 ($ million)
        • Data Table on North America - Market size and forecast 2024-2029 ($ million)
        • Chart on North America - Year-over-year growth 2024-2029 (%)
        • Data Table on North America - Year-over-year growth 2024-2029 (%)
      • 11.4 Europe - Market size and forecast 2024-2029
        • Chart on Europe - Market size and forecast 2024-2029 ($ million)
        • Data Table on Europe - Market size and forecast 2024-2029 ($ million)
        • Chart on Europe - Year-over-year growth 2024-2029 (%)
        • Data Table on Europe - Year-over-year growth 2024-2029 (%)
      • 11.5 APAC - Market size and forecast 2024-2029
        • Chart on APAC - Market size and forecast 2024-2029 ($ million)
        • Data Table on APAC - Market size and forecast 2024-2029 ($ million)
        • Chart on APAC - Year-over-year growth 2024-2029 (%)
        • Data Table on APAC - Year-over-year growth 2024-2029 (%)
      • 11.6 Middle East and Africa - Market size and forecast 2024-2029
        • Chart on Middle East and Africa - Market size and forecast 2024-2029 ($ million)
        • Data Table on Middle East and Africa - Market size and forecast 2024-2029 ($ million)
        • Chart on Middle East and Africa - Year-over-year growth 2024-2029 (%)
        • Data Table on Middle East and Africa - Year-over-year growth 2024-2029 (%)
      • 11.7 South America - Market size and forecast 2024-2029
        • Chart on South America - Market size and forecast 2024-2029 ($ million)
        • Data Table on South America - Market size and forecast 2024-2029 ($ million)
        • Chart on South America - Year-over-year growth 2024-2029 (%)
        • Data Table on South America - Year-over-year growth 2024-2029 (%)
      • 11.8 US - Market size and forecast 2024-2029
        • Chart on US - Market size and forecast 2024-2029 ($ million)
        • Data Table on US - Market size and forecast 2024-2029 ($ million)
        • Chart on US - Year-over-year growth 2024-2029 (%)
        • Data Table on US - Year-over-year growth 2024-2029 (%)
      • 11.9 UK - Market size and forecast 2024-2029
        • Chart on UK - Market size and forecast 2024-2029 ($ million)
        • Data Table on UK - Market size and forecast 2024-2029 ($ million)
        • Chart on UK - Year-over-year growth 2024-2029 (%)
        • Data Table on UK - Year-over-year growth 2024-2029 (%)
      • 11.10 Canada - Market size and forecast 2024-2029
        • Chart on Canada - Market size and forecast 2024-2029 ($ million)
        • Data Table on Canada - Market size and forecast 2024-2029 ($ million)
        • Chart on Canada - Year-over-year growth 2024-2029 (%)
        • Data Table on Canada - Year-over-year growth 2024-2029 (%)
      • 11.11 Germany - Market size and forecast 2024-2029
        • Chart on Germany - Market size and forecast 2024-2029 ($ million)
        • Data Table on Germany - Market size and forecast 2024-2029 ($ million)
        • Chart on Germany - Year-over-year growth 2024-2029 (%)
        • Data Table on Germany - Year-over-year growth 2024-2029 (%)
      • 11.12 China - Market size and forecast 2024-2029
        • Chart on China - Market size and forecast 2024-2029 ($ million)
        • Data Table on China - Market size and forecast 2024-2029 ($ million)
        • Chart on China - Year-over-year growth 2024-2029 (%)
        • Data Table on China - Year-over-year growth 2024-2029 (%)
      • 11.13 Japan - Market size and forecast 2024-2029
        • Chart on Japan - Market size and forecast 2024-2029 ($ million)
        • Data Table on Japan - Market size and forecast 2024-2029 ($ million)
        • Chart on Japan - Year-over-year growth 2024-2029 (%)
        • Data Table on Japan - Year-over-year growth 2024-2029 (%)
      • 11.14 India - Market size and forecast 2024-2029
        • Chart on India - Market size and forecast 2024-2029 ($ million)
        • Data Table on India - Market size and forecast 2024-2029 ($ million)
        • Chart on India - Year-over-year growth 2024-2029 (%)
        • Data Table on India - Year-over-year growth 2024-2029 (%)
      • 11.15 France - Market size and forecast 2024-2029
        • Chart on France - Market size and forecast 2024-2029 ($ million)
        • Data Table on France - Market size and forecast 2024-2029 ($ million)
        • Chart on France - Year-over-year growth 2024-2029 (%)
        • Data Table on France - Year-over-year growth 2024-2029 (%)
      • 11.16 Brazil - Market size and forecast 2024-2029
        • Chart on Brazil - Market size and forecast 2024-2029 ($ million)
        • Data Table on Brazil - Market size and forecast 2024-2029 ($ million)
        • Chart on Brazil - Year-over-year growth 2024-2029 (%)
        • Data Table on Brazil - Year-over-year growth 2024-2029 (%)
      • 11.17 South Korea - Market size and forecast 2024-2029
        • Chart on South Korea - Market size and forecast 2024-2029 ($ million)
        • Data Table on South Korea - Market size and forecast 2024-2029 ($ million)
        • Chart on South Korea - Year-over-year growth 2024-2029 (%)
        • Data Table on South Korea - Year-over-year growth 2024-2029 (%)
      • 11.18 Market opportunity by geography
        • Market opportunity by geography ($ million)
        • Data Tables on Market opportunity by geography ($ million)

      12 Drivers, Challenges, and Opportunity/Restraints

      • 12.1 Market drivers
        • 12.2 Market challenges
          • 12.3 Impact of drivers and challenges
            • Impact of drivers and challenges in 2024 and 2029
          • 12.4 Market opportunities/restraints

            13 Competitive Landscape

            • 13.1 Overview
              • 13.2 Competitive Landscape
                • Overview on criticality of inputs and factors of differentiation
              • 13.3 Landscape disruption
                • Overview on factors of disruption
              • 13.4 Industry risks
                • Impact of key risks on business

              14 Competitive Analysis

              • 14.1 Companies profiled
                • Companies covered
              • 14.2 Company ranking index
                • Company ranking index
              • 14.3 Market positioning of companies
                • Matrix on companies position and classification
              • 14.4 ezTurns
                • ezTurns - Overview
                • ezTurns - Product / Service
                • ezTurns - Key offerings
                • SWOT
              • 14.5 JRNI
                • JRNI - Overview
                • JRNI - Product / Service
                • JRNI - Key offerings
                • SWOT
              • 14.6 Lucep Pte Ltd
                • Lucep Pte Ltd - Overview
                • Lucep Pte Ltd - Product / Service
                • Lucep Pte Ltd - Key offerings
                • SWOT
              • 14.7 Netsol IT Solutions Pvt. Ltd.
                • Netsol IT Solutions Pvt. Ltd. - Overview
                • Netsol IT Solutions Pvt. Ltd. - Product / Service
                • Netsol IT Solutions Pvt. Ltd. - Key offerings
                • SWOT
              • 14.8 QLESS Inc.
                • QLESS Inc. - Overview
                • QLESS Inc. - Product / Service
                • QLESS Inc. - Key offerings
                • SWOT
              • 14.9 Q-MATIC Group AB
                • Q-MATIC Group AB - Overview
                • Q-MATIC Group AB - Product / Service
                • Q-MATIC Group AB - Key offerings
                • SWOT
              • 14.10 Qminder Ltd.
                • Qminder Ltd. - Overview
                • Qminder Ltd. - Product / Service
                • Qminder Ltd. - Key offerings
                • SWOT
              • 14.11 Q-nomy Inc.
                • Q-nomy Inc. - Overview
                • Q-nomy Inc. - Product / Service
                • Q-nomy Inc. - Key offerings
                • SWOT
              • 14.12 Queue it
                • Queue it - Overview
                • Queue it - Product / Service
                • Queue it - Key offerings
                • SWOT
              • 14.13 Qwaiting
                • Qwaiting - Overview
                • Qwaiting - Product / Service
                • Qwaiting - Key offerings
                • SWOT
              • 14.14 Waitwhile Inc.
                • Waitwhile Inc. - Overview
                • Waitwhile Inc. - Product / Service
                • Waitwhile Inc. - Key offerings
                • SWOT
              • 14.15 Wavetec
                • Wavetec - Overview
                • Wavetec - Product / Service
                • Wavetec - Key offerings
                • SWOT

              15 Appendix

              • 15.1 Scope of the report
                • 15.2 Inclusions and exclusions checklist
                  • Inclusions checklist
                  • Exclusions checklist
                • 15.3 Currency conversion rates for US$
                  • Currency conversion rates for US$
                • 15.4 Research methodology
                  • Research methodology
                • 15.5 Data procurement
                  • Information sources
                • 15.6 Data validation
                  • Data validation
                • 15.7 Validation techniques employed for market sizing
                  • Validation techniques employed for market sizing
                • 15.8 Data synthesis
                  • Data synthesis
                • 15.9 360 degree market analysis
                  • 360 degree market analysis
                • 15.10 List of abbreviations
                  • List of abbreviations

                Research Methodology

                Technavio presents a detailed picture of the market by way of study, synthesis, and summation of data from multiple sources. The analysts have presented the various facets of the market with a particular focus on identifying the key industry influencers. The data thus presented is comprehensive, reliable, and the result of extensive research, both primary and secondary.

                INFORMATION SOURCES

                Primary sources

                • Manufacturers and suppliers
                • Channel partners
                • Industry experts
                • Strategic decision makers

                Secondary sources

                • Industry journals and periodicals
                • Government data
                • Financial reports of key industry players
                • Historical data
                • Press releases

                DATA ANALYSIS

                Data Synthesis

                • Collation of data
                • Estimation of key figures
                • Analysis of derived insights

                Data Validation

                • Triangulation with data models
                • Reference against proprietary databases
                • Corroboration with industry experts

                REPORT WRITING

                Qualitative

                • Market drivers
                • Market challenges
                • Market trends
                • Five forces analysis

                Quantitative

                • Market size and forecast
                • Market segmentation
                • Geographical insights
                • Competitive landscape

                Interested in this report?

                Get your sample now to see our research methodology and insights!

                Download Now

                Frequently Asked Questions

                Virtual Queuing System market growth will increase by $ 106.4 mn during 2025-2029 .

                The Virtual Queuing System market is expected to grow at a CAGR of 6.3% during 2025-2029 .

                Virtual Queuing System market is segmented by Deployment( Cloud-based, On-premises) End-user( Retail, Healthcare, BFSI, Telecommunication, Others)

                ezTurns, JRNI, Lucep Pte Ltd, Netsol IT Solutions Pvt. Ltd., QLESS Inc., Q-MATIC Group AB, Qminder Ltd., Q-nomy Inc., Queue it, Qwaiting, Waitwhile Inc., Wavetec are a few of the key vendors in the Virtual Queuing System market.

                North America will register the highest growth rate of 37% among the other regions. Therefore, the Virtual Queuing System market in North America is expected to garner significant business opportunities for the vendors during the forecast period.

                US, UK, Canada, Germany, China, Japan, France, India, Brazil, South Korea

                • High levels of investmentThe global virtual queuing system market is experiencing robust growth is the driving factor this market.
                • significantly driven by substantial investments in artificial intelligence (AI) technologies. These investments are crucial in advancing the capabilities of virtual queuing systems is the driving factor this market.
                • particularly in sectors such as healthcare.In September 2023 is the driving factor this market.
                • CALE AI in Canada announced a significant investment of $21 million to fund nine AI projects selected by SCALE AI under its AI for Healthcare Initiative. These projects are focused on pioneering the deployment of AI solutions in hospitals is the driving factor this market.
                • addressing complex challenges in the healthcare sector. The initiatives include optimizing and forecasting resource and workflow operations is the driving factor this market.
                • enhancing patient care management is the driving factor this market.
                • and implementing virtual triaging and queue management systems.Such high levels of investment are pivotal in driving innovation and development within the global virtual queuing system market. By channeling funds into AI-driven projects is the driving factor this market.
                • organizations can develop advanced solutions that improve efficiency and effectiveness in managing queues. In healthcare is the driving factor this market.
                • for instance is the driving factor this market.
                • these investments enable the creation of systems that can predict patient flow is the driving factor this market.
                • optimize resource allocation is the driving factor this market.
                • and streamline operations is the driving factor this market.
                • ultimately enhancing patient care and reducing wait times.The infusion of capital into AI projects not only accelerates technological advancements but also encourages the adoption of virtual queuing systems across various industries. As organizations recognize the benefits of these systems is the driving factor this market.
                • such as improved operational efficiency is the driving factor this market.
                • better customer experience is the driving factor this market.
                • and reduced costs is the driving factor this market.
                • the demand for AI-integrated virtual queuing solutions is expected to rise.The high levels of investment in AI technologies are a key driver of growth in the global virtual queuing system market. These investments facilitate the development of innovative solutions that address industry-specific challenges is the driving factor this market.
                • promoting the widespread adoption of virtual queuing systems and contributing to the markets expansion. As funding continues to flow into AI projects is the driving factor this market.
                • the global virtual queuing system market is poised for significant growth and transformation. is the driving factor this market.

                The Virtual Queuing System market vendors should focus on grabbing business opportunities from the Cloud-based segment as it accounted for the largest market share in the base year.