Queue Management System Market Analysis North America, Europe, APAC, South America, Middle East and Africa - US, China, Germany, UK, India, Japan, Canada, UAE, South Korea, Brazil - Size and Forecast 2025-2029

Queue Management System Market Analysis North America, Europe, APAC, South America, Middle East and Africa - US, China, Germany, UK, India, Japan, Canada, UAE, South Korea, Brazil - Size and Forecast 2025-2029

Published: Dec 2024 202 Pages SKU: IRTNTR80472

Market Overview at a Glance

$296.5 Mn
Market Opportunity
6.3%
CAGR
5.0
YoY growth 2024-2025(%)

Queue Management System Market Size 2025-2029

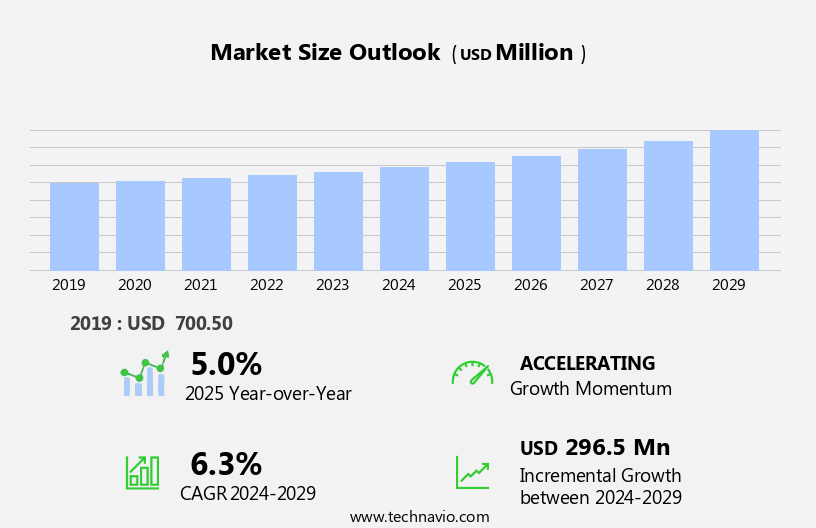
The queue management system market size is forecast to increase by USD 296.5 million, at a CAGR of 6.3% between 2024 and 2029.

  • The market is driven by the prevalence of long hospital queues and the increasing demand for efficient patient flow management. The implementation of advanced queue management systems enables healthcare providers to streamline patient registration, appointment scheduling, and resource allocation, reducing wait times and enhancing patient satisfaction. However, market growth is challenged by the integration with legacy systems, which can be complex and time-consuming. The successful adoption of queue management systems relies on seamless integration with existing hospital IT infrastructure, requiring significant investment in technology and resources.
  • Additionally, ensuring data security and privacy compliance adds to the implementation challenges. Companies seeking to capitalize on this market opportunity must focus on developing user-friendly, scalable, and secure solutions to address these challenges and meet the evolving demands of healthcare providers.

What will be the Size of the Queue Management System Market during the forecast period?

Queue Management System Market Size

Explore in-depth regional segment analysis with market size data - historical 2019-2023 and forecasts 2025-2029 - in the full report.  
Request Free Sample

Queue management systems continue to evolve, integrating various technologies and applications to streamline processes and enhance user experiences across numerous sectors. Event management and resource allocation are key areas of focus, with AI-driven solutions optimizing customer flow and predicting demand. Government applications leverage queue management systems for efficient service delivery, while UX and UI design ensure intuitive user interaction. Banking applications and mobile apps offer convenient, virtual queuing options, enabling real-time analytics and customer insights. Workflow management and predictive analytics facilitate capacity planning and business intelligence, improving operational efficiency. Digital signage and retail applications provide valuable information to customers, reducing wait times and enhancing the overall shopping experience.

In the education sector, queue management systems optimize student flow and improve resource allocation. AI-powered solutions offer personalized learning experiences, while API integration and machine learning enable advanced data analysis. Call center integration and customer feedback collection provide valuable insights, enhancing customer satisfaction and loyalty. Healthcare applications streamline patient flow and improve capacity planning, with AI-driven triage systems and predictive analytics optimizing resource allocation. Data security and privacy remain crucial considerations, ensuring the protection of sensitive patient information. The continuous unfolding of market activities in queue management systems reflects the evolving needs of businesses and industries, with cloud-based deployment and business process automation enabling seamless integration and scalability.

Ticketing systems and contact center solutions offer additional functionality, while interactive kiosks and staff scheduling tools optimize operational efficiency. In conclusion, the market is characterized by continuous innovation and adaptation to meet the evolving needs of various sectors. From event management and resource allocation to banking applications, education, healthcare, and beyond, queue management systems offer valuable solutions for businesses seeking to streamline processes, enhance user experiences, and improve operational efficiency.

How is this Queue Management System Industry segmented?

The queue management system industry research report provides comprehensive data (region-wise segment analysis), with forecasts and estimates in "USD million" for the period 2025-2029, as well as historical data from 2019-2023 for the following segments.

  • End-user
    • Retail and consumer goods
    • BFSI
    • Healthcare
    • IT and telecom
    • Others
  • Deployment
    • Cloud
    • On-premises
  • Geography
    • North America
      • US
      • Canada
    • Europe
      • Germany
      • UK
    • Middle East and Africa
      • UAE
    • APAC
      • China
      • India
      • Japan
      • South Korea
    • South America
      • Brazil
    • Rest of World (ROW)

    By End-user Insights

    The retail and consumer goods segment is estimated to witness significant growth during the forecast period.

    The market is experiencing notable growth in the retail and consumer goods sector, driven by the increasing demand for enhancing customer experience and operational efficiency. Queue management solutions play a pivotal role in optimizing customer flow, reducing wait times, and improving overall shopping experiences, especially during peak shopping periods and events. Artificial intelligence and machine learning technologies are increasingly being integrated into these systems to provide predictive analytics, customer insights, and real-time analytics, thereby enabling businesses to make data-driven decisions. Moreover, the adoption of cloud-based deployment and API integration has made queue management systems more accessible and flexible, allowing businesses to streamline their operations and improve customer satisfaction.

    In the banking sector, queue management software is being used to optimize workflow management, capacity planning, and call center integration, leading to operational efficiency and improved customer experience. In the education sector, virtual queuing and digital signage are being used to manage student flow and provide real-time information, while in healthcare applications, queue management systems are essential for managing patient flow and appointment scheduling. The integration of user experience and user interface design principles ensures that these systems are intuitive and easy to use, enhancing the overall customer journey mapping. Furthermore, loyalty programs, reporting & dashboards, and business process automation are key features of advanced queue management systems, enabling businesses to gain valuable customer insights and optimize their operations.

    Capacity planning and staff scheduling are other critical functions of these systems, ensuring that businesses are prepared for peak periods and can manage their resources effectively. In conclusion, the market is witnessing significant growth, driven by the need to enhance customer experience and operational efficiency across various industries. The integration of advanced technologies, such as artificial intelligence, machine learning, and cloud computing, is transforming the way businesses manage queues and optimize their operations.

    Queue Management System Market Size

    Request Free Sample

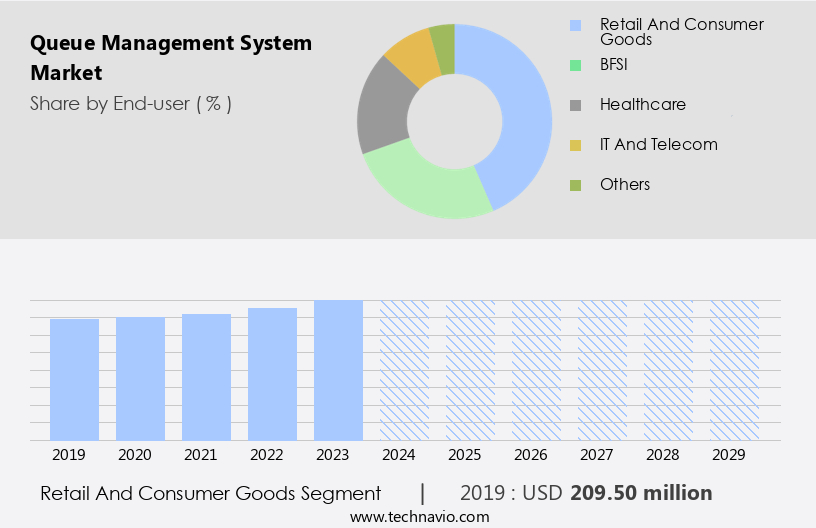
    The Retail and consumer goods segment was valued at USD 209.50 million in 2019 and showed a gradual increase during the forecast period.

    Regional Analysis

    North America is estimated to contribute 38% to the growth of the global market during the forecast period.Technavio’s analysts have elaborately explained the regional trends and drivers that shape the market during the forecast period.

    Queue Management System Market Share by Geography

     Request Free Sample

    The market in North America is witnessing notable expansion due to the escalating demand for streamlined service delivery and superior customer experiences. The region's commitment to digital transformation and technological innovations is fueling the adoption of queue management solutions across multiple industries. In an exemplary development, WaitWell, a Calgary-based SaaS startup, unveiled its queue management system platform at Department of Motor Vehicles (DMV) offices in Nevada in April 2024. This platform revolutionizes service delivery by allowing users to join queues using their mobile devices or on-site kiosks and receive real-time text notifications regarding wait times and other pertinent service information.

    The integration of artificial intelligence and machine learning technologies in these solutions enhances user experience (UX) and user interface (UI), enabling predictive analytics and business intelligence capabilities. Additionally, the implementation of workflow management, capacity planning, and digital signage optimizes operational efficiency and customer journey mapping. The market encompasses various applications, including banking, education, healthcare, retail, hospitality, and government sectors. Cloud-based deployment and API integration facilitate seamless integration with call center solutions, mobile apps, web portals, and ticketing systems. Furthermore, the adoption of real-time analytics, appointment scheduling, customer feedback collection, and data security features bolsters customer satisfaction and loyalty programs.

    The market's growth is also driven by the integration of customer experience management, customer segmentation, business process automation, and staff scheduling, ensuring a harmonious balance between efficient service delivery and optimal resource allocation.

    Market Dynamics

    Our researchers analyzed the data with 2024 as the base year, along with the key drivers, trends, and challenges. A holistic analysis of drivers will help companies refine their marketing strategies to gain a competitive advantage.

    What are the key market drivers leading to the rise in the adoption of Queue Management System Industry?

    • The significant prevalence of lengthy hospital queues serves as the primary market driver. 

    • The market experiences significant growth due to the increasing need for customer flow optimization in various industries, particularly in sectors with high customer traffic and long wait times. In healthcare, for instance, long queues in hospitals, especially in regions with large patient populations and limited resources, necessitate the implementation of efficient queue management systems. This is evidenced by the high patient volume and extended wait times in hospitals in major cities, such as Delhi, India, where government hospitals face extensive patient loads. The situation is further aggravated by the influx of patients seeking treatment for seasonal illnesses, leading to wait times of several hours or even years for certain diagnostic procedures.
    • To mitigate these challenges, businesses are adopting queue management solutions that offer features such as customer segmentation, business process automation, ticketing systems, contact center solutions, operational efficiency, interactive kiosks, reporting & dashboards, and cloud-based deployment. These systems enable organizations to streamline their operations, reduce wait times, and enhance customer satisfaction, ultimately leading to increased loyalty and repeat business. Additionally, staff scheduling and ticketing systems help manage resources effectively, ensuring optimal utilization and cost savings. Overall, the adoption of queue management systems is a strategic investment for businesses seeking to improve operational efficiency and deliver superior customer experiences.

    What are the market trends shaping the Queue Management System Industry?

    • Product launches are currently the most significant market trend. It is essential for businesses to stay informed and prepared for upcoming product launches to remain competitive.

    • The market is experiencing notable progress, driven by the introduction of advanced solutions that enhance customer engagement and streamline operational processes. One such innovation is Qnomy Inc.'s Virtual Lobby 3.2.0, launched in October 2024. This virtual waiting room solution caters to both walk-in and scheduled customers, offering a more efficient way to manage customer flow and reduce operational expenses. The Pre-Appointment Confirmation feature in Virtual Lobby enables organizations to engage proactively with customers, minimizing no-show rates through personalized confirmation links or QR codes. Furthermore, the virtual queue management capabilities of this system eliminate the need for costly physical kiosks and digital signage, providing a fully virtual solution for check-ins and waiting processes.
    • Resource allocation and workflow management are also improved through predictive analytics and event management features. Artificial intelligence (AI) and user experience (UX) are essential components of these systems, ensuring an immersive and harmonious user interface (UI) for banking applications, government services, and other industries. The market's growth is further fueled by the increasing adoption of mobile apps and web portals for virtual queuing, making it more convenient for customers to manage their appointments and reduce waiting times.

    What challenges does the Queue Management System Industry face during its growth?

    • The integration of legacy systems poses a significant challenge to industry growth, as this process can be complex and time-consuming, requiring specialized expertise and resources to ensure seamless data transfer and compatibility between systems. 

    • The market is witnessing significant growth due to the increasing demand for business intelligence and customer experience management. Modern queue management systems offer features like wait time reduction, call center integration, mobile check-in, customer insights, capacity planning, digital signage, and retail applications. However, integrating legacy systems into these modern architectures poses a significant challenge. Legacy systems, with their outdated data formats and proprietary standards, are not easily compatible with contemporary systems. This incompatibility necessitates the implementation of robust data transformation layers to convert legacy data into contemporary formats such as JSON or Avro. Furthermore, on-premise deployment and customer journey mapping are other essential aspects driving the market's growth.
    • These systems provide businesses with valuable customer insights, enabling them to optimize their operations and enhance the overall customer experience. Additionally, queue management systems offer capacity planning capabilities, ensuring efficient use of resources and minimizing wait times. In conclusion, the market's growth is driven by the need for business intelligence, customer experience management, and the integration of legacy systems into modern architectures.

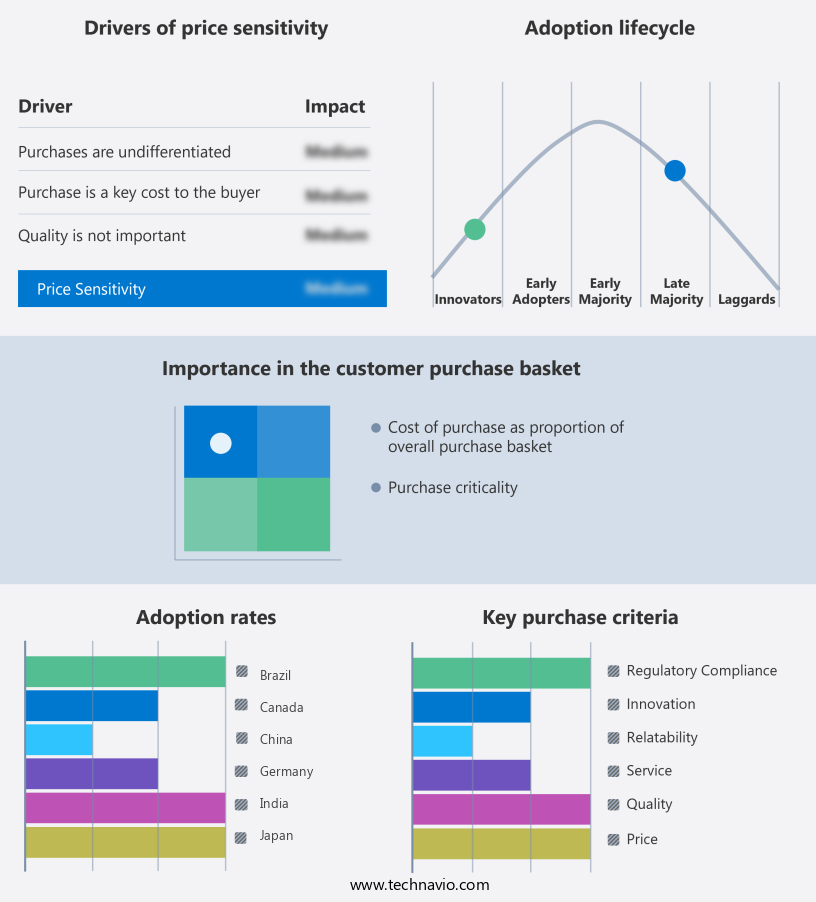
    Exclusive Customer Landscape

    The queue management system market forecasting report includes the adoption lifecycle of the market, covering from the innovator’s stage to the laggard’s stage. It focuses on adoption rates in different regions based on penetration. Furthermore, the queue management system market report also includes key purchase criteria and drivers of price sensitivity to help companies evaluate and develop their market growth analysis strategies.

    Queue Management System Market Share by Geography

     Customer Landscape

    Key Companies & Market Insights

    Companies are implementing various strategies, such as strategic alliances, queue management system market forecast, partnerships, mergers and acquisitions, geographical expansion, and product/service launches, to enhance their presence in the industry.

    Advantech Co. Ltd. - This company specializes in queue management solutions, incorporating virtual queuing, digital signage, and real-time analytics to optimize customer flow and boost service efficiency. Virtual queuing allows customers to join digital lines from their mobile devices or kiosks, reducing wait times and enhancing the overall customer experience. Digital signage displays vital information, such as wait times and service status, keeping customers informed and engaged. Real-time analytics provide valuable insights into customer behavior and service performance, enabling businesses to make data-driven decisions and improve operational efficiency.

    The industry research and growth report includes detailed analyses of the competitive landscape of the market and information about key companies, including:

    • Advantech Co. Ltd.
    • ATT Systems Pte Ltd.
    • Aurionpro Solutions Ltd.
    • Awebstar Technologies Pte Ltd.
    • DigitalDM
    • JRNI
    • Nemo Q
    • Netsol IT Solutions Pvt. Ltd.
    • QLESS Inc.
    • Q-MATIC Group AB
    • Qminder Ltd.
    • Q-nomy Inc.
    • Qtrac Inc.
    • Qwaiting
    • Skiplino Technologies WLL
    • Tensator Group
    • Verint Systems Inc.
    • Waitwhile Inc.
    • Wavetec

    Qualitative and quantitative analysis of companies has been conducted to help clients understand the wider business environment as well as the strengths and weaknesses of key industry players. Data is qualitatively analyzed to categorize companies as pure play, category-focused, industry-focused, and diversified; it is quantitatively analyzed to categorize companies as dominant, leading, strong, tentative, and weak.

    Recent Development and News in Queue Management System Market

    • In February 2024, leading queue management solutions provider, KioWare Corporation, announced the launch of its advanced AI-driven virtual queue system, QueueMaster Pro. This innovative solution aims to streamline customer experience by allowing virtual queue ticketing and real-time queue monitoring, as stated in their official press release (KioWare Corporation, 2024).
    • In May 2024, tech giants Microsoft and Amazon joined forces to integrate Amazon's Just Walk Out technology with Microsoft's Dynamics 365 Queue Management System. This strategic partnership aims to create a seamless shopping experience by combining contactless payment and queue management, as reported by Reuters (Reuters, 2024).
    • In September 2025, NEC Corporation successfully acquired a significant stake in queue management software provider, Q-Flow. This strategic acquisition is expected to expand NEC's presence in the queue management market and strengthen its portfolio of intelligent solutions, according to NEC's official press release (NEC Corporation, 2025).
    • In November 2025, the European Union announced the implementation of a new regulation mandating the use of queue management systems in all public and commercial sectors to improve service efficiency and reduce waiting times. This regulatory initiative is expected to boost the demand for queue management systems in Europe, as stated in the European Commission press release (European Commission, 2025).

    Research Analyst Overview

    • The market is experiencing significant growth, driven by the integration of IoT sensors and ML-driven customer insights. Third-party integrations enable resource optimization and data privacy, making queue management systems an essential tool for businesses. Self-service kiosks and AI-powered queue management systems streamline the customer journey, while predictive queuing models and ticketting software facilitate workflow optimization. Government analytics and hospitality analytics are major applications, with ML algorithms providing valuable insights for resource allocation and customer satisfaction. In the retail sector, CRM integration and multi-channel support optimize customer interactions, while contact center analytics enhance agent performance. Bi tools and education analytics enable data-driven decision-making, and user interface design ensures a seamless user experience.
    • Healthcare analytics and banking analytics improve operational efficiency and security, while event planning software and crowd management systems ensure smooth event execution. Cloud security is a critical concern, with businesses prioritizing data privacy and security in their queue management systems. Business process re-engineering and workflow optimization are ongoing trends, driving the adoption of queue optimization algorithms and mobile app development. Queue simulation and customer feedback analysis provide valuable insights for continuous improvement, ensuring that businesses remain competitive in today's dynamic market.

    Dive into Technavio’s robust research methodology, blending expert interviews, extensive data synthesis, and validated models for unparalleled Queue Management System Market insights. See full methodology.

    Market Scope

    Report Coverage

    Details

    Page number

    202

    Base year

    2024

    Historic period

    2019-2023

    Forecast period

    2025-2029

    Growth momentum & CAGR

    Accelerate at a CAGR of 6.3%

    Market growth 2025-2029

    USD 296.5 million

    Market structure

    Fragmented

    YoY growth 2024-2025(%)

    5.0

    Key countries

    US, China, Germany, UK, India, Japan, Canada, UAE, South Korea, and Brazil

    Competitive landscape

    Leading Companies, Market Positioning of Companies, Competitive Strategies, and Industry Risks

    Request Free Sample

    What are the Key Data Covered in this Queue Management System Market Research and Growth Report?

    • CAGR of the Queue Management System industry during the forecast period
    • Detailed information on factors that will drive the growth and forecasting between 2025 and 2029
    • Precise estimation of the size of the market and its contribution of the industry in focus to the parent market
    • Accurate predictions about upcoming growth and trends and changes in consumer behaviour
    • Growth of the market across North America, Europe, APAC, South America, and Middle East and Africa
    • Thorough analysis of the market’s competitive landscape and detailed information about companies
    • Comprehensive analysis of factors that will challenge the queue management system market growth of industry companies

    We can help! Our analysts can customize this queue management system market research report to meet your requirements.

    Get in touch


    1 Executive Summary

    • 1.1 Market overview
      • Executive Summary - Chart on Market Overview
      • Executive Summary - Data Table on Market Overview
      • Executive Summary - Chart on Global Market Characteristics
      • Executive Summary - Chart on Market by Geography
      • Executive Summary - Chart on Market Segmentation by End-user
      • Executive Summary - Chart on Market Segmentation by Deployment
      • Executive Summary - Chart on Incremental Growth
      • Executive Summary - Data Table on Incremental Growth
      • Executive Summary - Chart on Company Market Positioning

    2 Technavio Analysis

    • 2.1 Analysis of price sensitivity, lifecycle, customer purchase basket, adoption rates, and purchase criteria
      • Analysis of price sensitivity, lifecycle, customer purchase basket, adoption rates, and purchase criteria
    • 2.2 Criticality of inputs and Factors of differentiation
      • Overview on criticality of inputs and factors of differentiation
    • 2.3 Factors of disruption
      • Overview on factors of disruption
    • 2.4 Impact of drivers and challenges
      • Impact of drivers and challenges in 2024 and 2029

    3 Market Landscape

    • 3.1 Market ecosystem
      • Parent Market
      • Data Table on - Parent Market
    • 3.2 Market characteristics
      • Market characteristics analysis
    • 3.3 Value chain analysis
      • Value chain analysis

    4 Market Sizing

    • 4.1 Market definition
      • Offerings of companies included in the market definition
    • 4.2 Market segment analysis
      • Market segments
    • 4.3 Market size 2024
      • 4.4 Market outlook: Forecast for 2024-2029
        • Chart on Global - Market size and forecast 2024-2029 ($ million)
        • Data Table on Global - Market size and forecast 2024-2029 ($ million)
        • Chart on Global Market: Year-over-year growth 2024-2029 (%)
        • Data Table on Global Market: Year-over-year growth 2024-2029 (%)

      5 Historic Market Size

      • 5.1 Global Queue Management System Market 2019 - 2023
        • Historic Market Size - Data Table on Global Queue Management System Market 2019 - 2023 ($ million)
      • 5.2 End-user segment analysis 2019 - 2023
        • Historic Market Size - End-user Segment 2019 - 2023 ($ million)
      • 5.3 Deployment segment analysis 2019 - 2023
        • Historic Market Size - Deployment Segment 2019 - 2023 ($ million)
      • 5.4 Geography segment analysis 2019 - 2023
        • Historic Market Size - Geography Segment 2019 - 2023 ($ million)
      • 5.5 Country segment analysis 2019 - 2023
        • Historic Market Size - Country Segment 2019 - 2023 ($ million)

      6 Qualitative Analysis

      • 6.1 Impact of AI on the global queue management system market

        7 Five Forces Analysis

        • 7.1 Five forces summary
          • Five forces analysis - Comparison between 2024 and 2029
        • 7.2 Bargaining power of buyers
          • Bargaining power of buyers - Impact of key factors 2024 and 2029
        • 7.3 Bargaining power of suppliers
          • Bargaining power of suppliers - Impact of key factors in 2024 and 2029
        • 7.4 Threat of new entrants
          • Threat of new entrants - Impact of key factors in 2024 and 2029
        • 7.5 Threat of substitutes
          • Threat of substitutes - Impact of key factors in 2024 and 2029
        • 7.6 Threat of rivalry
          • Threat of rivalry - Impact of key factors in 2024 and 2029
        • 7.7 Market condition
          • Chart on Market condition - Five forces 2024 and 2029

        8 Market Segmentation by End-user

        • 8.1 Market segments
          • Chart on End-user - Market share 2024-2029 (%)
          • Data Table on End-user - Market share 2024-2029 (%)
        • 8.2 Comparison by End-user
          • Chart on Comparison by End-user
          • Data Table on Comparison by End-user
        • 8.3 Retail and consumer goods - Market size and forecast 2024-2029
          • Chart on Retail and consumer goods - Market size and forecast 2024-2029 ($ million)
          • Data Table on Retail and consumer goods - Market size and forecast 2024-2029 ($ million)
          • Chart on Retail and consumer goods - Year-over-year growth 2024-2029 (%)
          • Data Table on Retail and consumer goods - Year-over-year growth 2024-2029 (%)
        • 8.4 BFSI - Market size and forecast 2024-2029
          • Chart on BFSI - Market size and forecast 2024-2029 ($ million)
          • Data Table on BFSI - Market size and forecast 2024-2029 ($ million)
          • Chart on BFSI - Year-over-year growth 2024-2029 (%)
          • Data Table on BFSI - Year-over-year growth 2024-2029 (%)
        • 8.5 Healthcare - Market size and forecast 2024-2029
          • Chart on Healthcare - Market size and forecast 2024-2029 ($ million)
          • Data Table on Healthcare - Market size and forecast 2024-2029 ($ million)
          • Chart on Healthcare - Year-over-year growth 2024-2029 (%)
          • Data Table on Healthcare - Year-over-year growth 2024-2029 (%)
        • 8.6 IT and telecom - Market size and forecast 2024-2029
          • Chart on IT and telecom - Market size and forecast 2024-2029 ($ million)
          • Data Table on IT and telecom - Market size and forecast 2024-2029 ($ million)
          • Chart on IT and telecom - Year-over-year growth 2024-2029 (%)
          • Data Table on IT and telecom - Year-over-year growth 2024-2029 (%)
        • 8.7 Others - Market size and forecast 2024-2029
          • Chart on Others - Market size and forecast 2024-2029 ($ million)
          • Data Table on Others - Market size and forecast 2024-2029 ($ million)
          • Chart on Others - Year-over-year growth 2024-2029 (%)
          • Data Table on Others - Year-over-year growth 2024-2029 (%)
        • 8.8 Market opportunity by End-user
          • Market opportunity by End-user ($ million)
          • Data Table on Market opportunity by End-user ($ million)

        9 Market Segmentation by Deployment

        • 9.1 Market segments
          • Chart on Deployment - Market share 2024-2029 (%)
          • Data Table on Deployment - Market share 2024-2029 (%)
        • 9.2 Comparison by Deployment
          • Chart on Comparison by Deployment
          • Data Table on Comparison by Deployment
        • 9.3 Cloud - Market size and forecast 2024-2029
          • Chart on Cloud - Market size and forecast 2024-2029 ($ million)
          • Data Table on Cloud - Market size and forecast 2024-2029 ($ million)
          • Chart on Cloud - Year-over-year growth 2024-2029 (%)
          • Data Table on Cloud - Year-over-year growth 2024-2029 (%)
        • 9.4 On-premises - Market size and forecast 2024-2029
          • Chart on On-premises - Market size and forecast 2024-2029 ($ million)
          • Data Table on On-premises - Market size and forecast 2024-2029 ($ million)
          • Chart on On-premises - Year-over-year growth 2024-2029 (%)
          • Data Table on On-premises - Year-over-year growth 2024-2029 (%)
        • 9.5 Market opportunity by Deployment
          • Market opportunity by Deployment ($ million)
          • Data Table on Market opportunity by Deployment ($ million)

        10 Customer Landscape

        • 10.1 Customer landscape overview
          • Analysis of price sensitivity, lifecycle, customer purchase basket, adoption rates, and purchase criteria

        11 Geographic Landscape

        • 11.1 Geographic segmentation
          • Chart on Market share by geography 2024-2029 (%)
          • Data Table on Market share by geography 2024-2029 (%)
        • 11.2 Geographic comparison
          • Chart on Geographic comparison
          • Data Table on Geographic comparison
        • 11.3 North America - Market size and forecast 2024-2029
          • Chart on North America - Market size and forecast 2024-2029 ($ million)
          • Data Table on North America - Market size and forecast 2024-2029 ($ million)
          • Chart on North America - Year-over-year growth 2024-2029 (%)
          • Data Table on North America - Year-over-year growth 2024-2029 (%)
        • 11.4 Europe - Market size and forecast 2024-2029
          • Chart on Europe - Market size and forecast 2024-2029 ($ million)
          • Data Table on Europe - Market size and forecast 2024-2029 ($ million)
          • Chart on Europe - Year-over-year growth 2024-2029 (%)
          • Data Table on Europe - Year-over-year growth 2024-2029 (%)
        • 11.5 APAC - Market size and forecast 2024-2029
          • Chart on APAC - Market size and forecast 2024-2029 ($ million)
          • Data Table on APAC - Market size and forecast 2024-2029 ($ million)
          • Chart on APAC - Year-over-year growth 2024-2029 (%)
          • Data Table on APAC - Year-over-year growth 2024-2029 (%)
        • 11.6 South America - Market size and forecast 2024-2029
          • Chart on South America - Market size and forecast 2024-2029 ($ million)
          • Data Table on South America - Market size and forecast 2024-2029 ($ million)
          • Chart on South America - Year-over-year growth 2024-2029 (%)
          • Data Table on South America - Year-over-year growth 2024-2029 (%)
        • 11.7 Middle East and Africa - Market size and forecast 2024-2029
          • Chart on Middle East and Africa - Market size and forecast 2024-2029 ($ million)
          • Data Table on Middle East and Africa - Market size and forecast 2024-2029 ($ million)
          • Chart on Middle East and Africa - Year-over-year growth 2024-2029 (%)
          • Data Table on Middle East and Africa - Year-over-year growth 2024-2029 (%)
        • 11.8 US - Market size and forecast 2024-2029
          • Chart on US - Market size and forecast 2024-2029 ($ million)
          • Data Table on US - Market size and forecast 2024-2029 ($ million)
          • Chart on US - Year-over-year growth 2024-2029 (%)
          • Data Table on US - Year-over-year growth 2024-2029 (%)
        • 11.9 China - Market size and forecast 2024-2029
          • Chart on China - Market size and forecast 2024-2029 ($ million)
          • Data Table on China - Market size and forecast 2024-2029 ($ million)
          • Chart on China - Year-over-year growth 2024-2029 (%)
          • Data Table on China - Year-over-year growth 2024-2029 (%)
        • 11.10 Germany - Market size and forecast 2024-2029
          • Chart on Germany - Market size and forecast 2024-2029 ($ million)
          • Data Table on Germany - Market size and forecast 2024-2029 ($ million)
          • Chart on Germany - Year-over-year growth 2024-2029 (%)
          • Data Table on Germany - Year-over-year growth 2024-2029 (%)
        • 11.11 UK - Market size and forecast 2024-2029
          • Chart on UK - Market size and forecast 2024-2029 ($ million)
          • Data Table on UK - Market size and forecast 2024-2029 ($ million)
          • Chart on UK - Year-over-year growth 2024-2029 (%)
          • Data Table on UK - Year-over-year growth 2024-2029 (%)
        • 11.12 India - Market size and forecast 2024-2029
          • Chart on India - Market size and forecast 2024-2029 ($ million)
          • Data Table on India - Market size and forecast 2024-2029 ($ million)
          • Chart on India - Year-over-year growth 2024-2029 (%)
          • Data Table on India - Year-over-year growth 2024-2029 (%)
        • 11.13 Japan - Market size and forecast 2024-2029
          • Chart on Japan - Market size and forecast 2024-2029 ($ million)
          • Data Table on Japan - Market size and forecast 2024-2029 ($ million)
          • Chart on Japan - Year-over-year growth 2024-2029 (%)
          • Data Table on Japan - Year-over-year growth 2024-2029 (%)
        • 11.14 Canada - Market size and forecast 2024-2029
          • Chart on Canada - Market size and forecast 2024-2029 ($ million)
          • Data Table on Canada - Market size and forecast 2024-2029 ($ million)
          • Chart on Canada - Year-over-year growth 2024-2029 (%)
          • Data Table on Canada - Year-over-year growth 2024-2029 (%)
        • 11.15 UAE - Market size and forecast 2024-2029
          • Chart on UAE - Market size and forecast 2024-2029 ($ million)
          • Data Table on UAE - Market size and forecast 2024-2029 ($ million)
          • Chart on UAE - Year-over-year growth 2024-2029 (%)
          • Data Table on UAE - Year-over-year growth 2024-2029 (%)
        • 11.16 South Korea - Market size and forecast 2024-2029
          • Chart on South Korea - Market size and forecast 2024-2029 ($ million)
          • Data Table on South Korea - Market size and forecast 2024-2029 ($ million)
          • Chart on South Korea - Year-over-year growth 2024-2029 (%)
          • Data Table on South Korea - Year-over-year growth 2024-2029 (%)
        • 11.17 Brazil - Market size and forecast 2024-2029
          • Chart on Brazil - Market size and forecast 2024-2029 ($ million)
          • Data Table on Brazil - Market size and forecast 2024-2029 ($ million)
          • Chart on Brazil - Year-over-year growth 2024-2029 (%)
          • Data Table on Brazil - Year-over-year growth 2024-2029 (%)
        • 11.18 Market opportunity by geography
          • Market opportunity by geography ($ million)
          • Data Tables on Market opportunity by geography ($ million)

        12 Drivers, Challenges, and Opportunity/Restraints

        • 12.1 Market drivers
          • 12.2 Market challenges
            • 12.3 Impact of drivers and challenges
              • Impact of drivers and challenges in 2024 and 2029
            • 12.4 Market opportunities/restraints

              13 Competitive Landscape

              • 13.1 Overview
                • 13.2 Competitive Landscape
                  • Overview on criticality of inputs and factors of differentiation
                • 13.3 Landscape disruption
                  • Overview on factors of disruption
                • 13.4 Industry risks
                  • Impact of key risks on business

                14 Competitive Analysis

                • 14.1 Companies profiled
                  • Companies covered
                • 14.2 Company ranking index
                  • Company ranking index
                • 14.3 Market positioning of companies
                  • Matrix on companies position and classification
                • 14.4 ATT Systems Pte Ltd.
                  • ATT Systems Pte Ltd. - Overview
                  • ATT Systems Pte Ltd. - Product / Service
                  • ATT Systems Pte Ltd. - Key offerings
                  • SWOT
                • 14.5 Aurionpro Solutions Ltd.
                  • Aurionpro Solutions Ltd. - Overview
                  • Aurionpro Solutions Ltd. - Business segments
                  • Aurionpro Solutions Ltd. - Key offerings
                  • Aurionpro Solutions Ltd. - Segment focus
                  • SWOT
                • 14.6 Awebstar Technologies Pte Ltd.
                  • Awebstar Technologies Pte Ltd. - Overview
                  • Awebstar Technologies Pte Ltd. - Product / Service
                  • Awebstar Technologies Pte Ltd. - Key offerings
                  • SWOT
                • 14.7 JRNI
                  • JRNI - Overview
                  • JRNI - Product / Service
                  • JRNI - Key offerings
                  • SWOT
                • 14.8 Netsol IT Solutions Pvt. Ltd.
                  • Netsol IT Solutions Pvt. Ltd. - Overview
                  • Netsol IT Solutions Pvt. Ltd. - Product / Service
                  • Netsol IT Solutions Pvt. Ltd. - Key offerings
                  • SWOT
                • 14.9 QLESS Inc.
                  • QLESS Inc. - Overview
                  • QLESS Inc. - Product / Service
                  • QLESS Inc. - Key offerings
                  • SWOT
                • 14.10 Q-MATIC Group AB
                  • Q-MATIC Group AB - Overview
                  • Q-MATIC Group AB - Product / Service
                  • Q-MATIC Group AB - Key offerings
                  • SWOT
                • 14.11 Qminder Ltd.
                  • Qminder Ltd. - Overview
                  • Qminder Ltd. - Product / Service
                  • Qminder Ltd. - Key offerings
                  • SWOT
                • 14.12 Q-nomy Inc.
                  • Q-nomy Inc. - Overview
                  • Q-nomy Inc. - Product / Service
                  • Q-nomy Inc. - Key offerings
                  • SWOT
                • 14.13 Qtrac Inc.
                  • Qtrac Inc. - Overview
                  • Qtrac Inc. - Product / Service
                  • Qtrac Inc. - Key offerings
                  • SWOT
                • 14.14 Qwaiting
                  • Qwaiting - Overview
                  • Qwaiting - Product / Service
                  • Qwaiting - Key offerings
                  • SWOT
                • 14.15 Skiplino Technologies WLL
                  • Skiplino Technologies WLL - Overview
                  • Skiplino Technologies WLL - Product / Service
                  • Skiplino Technologies WLL - Key offerings
                  • SWOT
                • 14.16 Verint Systems Inc.
                  • Verint Systems Inc. - Overview
                  • Verint Systems Inc. - Product / Service
                  • Verint Systems Inc. - Key offerings
                  • SWOT
                • 14.17 Waitwhile Inc.
                  • Waitwhile Inc. - Overview
                  • Waitwhile Inc. - Product / Service
                  • Waitwhile Inc. - Key offerings
                  • SWOT
                • 14.18 Wavetec
                  • Wavetec - Overview
                  • Wavetec - Product / Service
                  • Wavetec - Key offerings
                  • SWOT

                15 Appendix

                • 15.1 Scope of the report
                  • 15.2 Inclusions and exclusions checklist
                    • Inclusions checklist
                    • Exclusions checklist
                  • 15.3 Currency conversion rates for US$
                    • Currency conversion rates for US$
                  • 15.4 Research methodology
                    • Research methodology
                  • 15.5 Data procurement
                    • Information sources
                  • 15.6 Data validation
                    • Data validation
                  • 15.7 Validation techniques employed for market sizing
                    • Validation techniques employed for market sizing
                  • 15.8 Data synthesis
                    • Data synthesis
                  • 15.9 360 degree market analysis
                    • 360 degree market analysis
                  • 15.10 List of abbreviations
                    • List of abbreviations

                  Research Methodology

                  Technavio presents a detailed picture of the market by way of study, synthesis, and summation of data from multiple sources. The analysts have presented the various facets of the market with a particular focus on identifying the key industry influencers. The data thus presented is comprehensive, reliable, and the result of extensive research, both primary and secondary.

                  INFORMATION SOURCES

                  Primary sources

                  • Manufacturers and suppliers
                  • Channel partners
                  • Industry experts
                  • Strategic decision makers

                  Secondary sources

                  • Industry journals and periodicals
                  • Government data
                  • Financial reports of key industry players
                  • Historical data
                  • Press releases

                  DATA ANALYSIS

                  Data Synthesis

                  • Collation of data
                  • Estimation of key figures
                  • Analysis of derived insights

                  Data Validation

                  • Triangulation with data models
                  • Reference against proprietary databases
                  • Corroboration with industry experts

                  REPORT WRITING

                  Qualitative

                  • Market drivers
                  • Market challenges
                  • Market trends
                  • Five forces analysis

                  Quantitative

                  • Market size and forecast
                  • Market segmentation
                  • Geographical insights
                  • Competitive landscape

                  Interested in this report?

                  Get your sample now to see our research methodology and insights!

                  Download Now

                  Frequently Asked Questions

                  Queue Management System market growth will increase by $ 296.5 mn during 2025-2029 .

                  The Queue Management System market is expected to grow at a CAGR of 6.3% during 2025-2029 .

                  Queue Management System market is segmented by End-user( Retail and consumer goods, BFSI, Healthcare, IT and telecom, Others) Deployment( Cloud, On-premises)

                  Advantech Co. Ltd., ATT Systems Pte Ltd., Aurionpro Solutions Ltd., Awebstar Technologies Pte Ltd., DigitalDM, JRNI, Nemo Q, Netsol IT Solutions Pvt. Ltd., QLESS Inc., Q-MATIC Group AB, Qminder Ltd., Q-nomy Inc., Qtrac Inc., Qwaiting, Skiplino Technologies WLL, Tensator Group, Verint Systems Inc., Waitwhile Inc., Wavetec are a few of the key vendors in the Queue Management System market.

                  North America will register the highest growth rate of 38% among the other regions. Therefore, the Queue Management System market in North America is expected to garner significant business opportunities for the vendors during the forecast period.

                  US, China, Germany, UK, India, Japan, Canada, UAE, South Korea, Brazil

                  • Prevalence of long hospital queuesThe global queue management system market is significantly driven by the prevalence of long hospital queues is the driving factor this market.
                  • particularly in regions with high patient volumes and limited healthcare resources. In India is the driving factor this market.
                  • for instance is the driving factor this market.
                  • the summer of 2023 saw a surge in patients suffering from heat-related illnesses such as dehydration is the driving factor this market.
                  • fever is the driving factor this market.
                  • and nausea. This influx led to crowded outpatient departments (OPDs) in hospitals is the driving factor this market.
                  • with at least 50 patients visiting the medicine department daily and around six requiring admission each day.The situation is exacerbated in government hospitals in major cities like Delhi is the driving factor this market.
                  • where patients face extensive wait times for routine tests. The overwhelming patient load has resulted in waiting periods of three to four years for certain diagnostic procedures. This scenario highlights the urgent need for efficient queue management systems to streamline patient flow and reduce wait times.Queue management systems can play a crucial role in addressing these challenges by optimizing patient scheduling is the driving factor this market.
                  • reducing bottlenecks is the driving factor this market.
                  • and improving overall operational efficiency. These systems enable hospitals to manage patient appointments more effectively is the driving factor this market.
                  • ensuring that resources are allocated appropriately and that patients receive timely care. By implementing advanced queue management solutions is the driving factor this market.
                  • healthcare facilities can enhance patient satisfaction is the driving factor this market.
                  • reduce stress on medical staff is the driving factor this market.
                  • and improve the overall quality of care.The increasing demand for healthcare services is the driving factor this market.
                  • coupled with the strain on existing infrastructure is the driving factor this market.
                  • underscores the importance of adopting queue management systems. As hospitals and clinics strive to cope with rising patient numbers is the driving factor this market.
                  • the integration of these systems becomes essential for maintaining efficient operations and delivering high-quality healthcare. This trend is expected to drive significant growth in the global queue management system market is the driving factor this market.
                  • as healthcare providers seek innovative solutions to manage patient flow and enhance service delivery. is the driving factor this market.

                  The Queue Management System market vendors should focus on grabbing business opportunities from the Retail and consumer goods segment as it accounted for the largest market share in the base year.