Vitamin B3 Market Analysis North America, Europe, Asia, Rest of World (ROW) - US, Denmark, China, Canada, India - Size and Forecast 2024-2028

Vitamin B3 Market Analysis North America, Europe, Asia, Rest of World (ROW) - US, Denmark, China, Canada, India - Size and Forecast 2024-2028

Published: Jul 2024 131 Pages SKU: IRTNTR73495

Market Overview at a Glance

$84.8 Mn
Market Opportunity
4.49%
CAGR
4.23
YoY growth 2023-2024(%)

Vitamin B3 Market Size 2024-2028

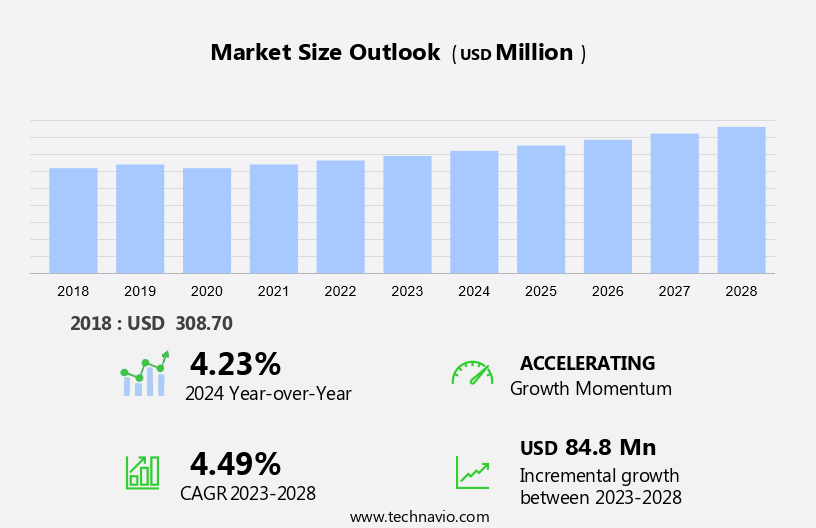
The vitamin B3 market size is forecast to increase by USD 84.8 million at a CAGR of 4.49% between 2023 and 2028.

  • The market is experiencing significant growth due to several key trends and factors. The increasing awareness of health and wellness, particularly In the US and North America, has led to a rise in consumer spending on vitamin supplements, including those derived from brown rice, a rich source of niacin or vitamin B3. In the animal feed industry, vitamin B3 is widely used as a feed additive to improve the growth and health of livestock, such as beef and poultry. In the food industry, vitamin B3 is used in various applications, including In the production of bread and meat processing, to enhance the nutritional value and shelf life of these products. 
  • Niacin is naturally present in various foods, such as tuna, salmon, vegetables, and other nutrient-rich sources. Moreover, the demand for vitamin B3 in cosmeceuticals and personal care products is also on the rise, as it is known to improve skin health and mental health. Avocado, mushroom, and salmon are among the natural food sources of vitamin B3, making them popular ingredients in various health and wellness products. Regulatory control on supplement usage limits, particularly In the US, is another factor driving the growth of the market. Overall, the market is expected to continue its growth trajectory due to these trends and factors.

What will be the Size of the Market During the Forecast Period?

Vitamin B3 Market Size

 Request Free Sample

  • The market encompasses various forms of Niacin and Nicotinic Acid, essential pyridine carboxylic acids that play a crucial role in human and animal nutrition. Niacin, also known as Vitamin B3, is an organic compound integral to energy production and DNA repair. In human nutrition, it alleviates deficiency symptoms like nausea, anemia, headaches, tiredness, and improves cardiovascular health. In animal nutrition, it enhances growth and improves feed efficiency. Niacin is extensively used in pharmaceutical-grade supplements, available as powders, granular, and liquids. It is also employed as a feed additive for livestock and poultry. In the food industry, niacin is added to processed foods, including fortified packaged foods, to enhance nutritional value.
  • Niacin and its amide form, Niacinamide, are also integral to cosmeceuticals due to their skin-enhancing properties. However, the increasing prevalence of high blood cholesterol and deficiency symptoms necessitates the growing demand for niacin supplements. Overall, the market is expected to witness steady growth, driven by its diverse applications in human and animal nutrition and the cosmetics industry.

How is this Industry segmented and which is the largest segment?

The industry research report provides comprehensive data (region-wise segment analysis), with forecasts and estimates in "USD billion" for the period 2024-2028, as well as historical data from 2018-2022 for the following segments.
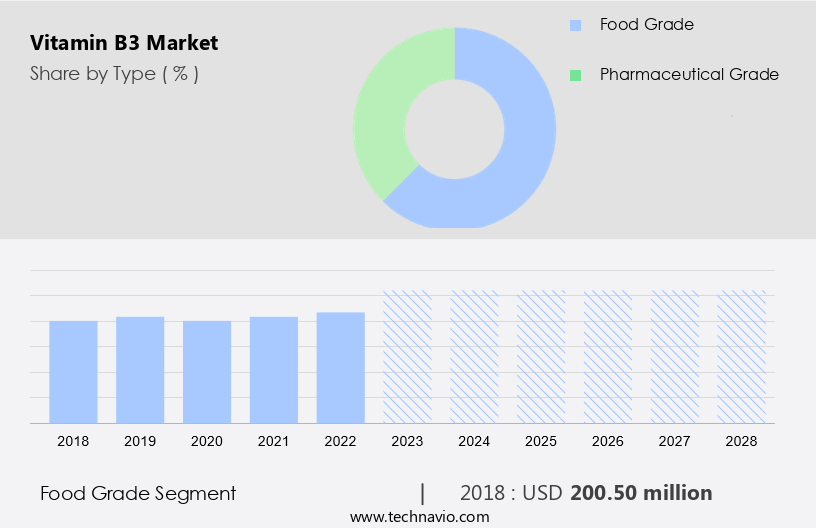
  • Type
    • Food grade
    • Pharmaceutical grade
  • Geography
    • North America
      • Canada
      • US
    • Europe
      • Denmark
    • Asia
      • China
      • India
    • Rest of World (ROW)

By Type Insights

  • The food grade segment is estimated to witness significant growth during the forecast period.

Vitamin B3, also known as niacin or nicotinic acid, is an essential organic compound in human and animal nutrition. It plays a crucial role in reducing high blood cholesterol levels and heart-related issues. Foods rich in vitamin B3 include red meat, poultry, fish such as tuna and salmon, brown rice, fortified cereals, and bread. Consumers prefer natural sources over supplements due to potential toxicity concerns. Vitamin B3 deficiency can lead to anemia, headaches, tiredness, and nausea. In the healthcare and animal nutrition segments, vitamin B3 is used In the form of niacin supplements, nicotinic acid, powder, granular, and liquid. The demand for vitamin B3 is increasing due to health consciousness, disease resistance, and changing consumer lifestyles.

Vitamin B3 Market Size

Get a glance at the Vitamin B3 Industry report of share of various segments Request Free Sample

The food grade segment was valued at USD 200.50 million in 2018 and showed a gradual increase during the forecast period.

Regional Analysis

  • North America is estimated to contribute 38% to the growth of the global market during the forecast period.

Technavio's analysts have elaborately explained the regional trends and drivers that shape the market during the forecast period.

Vitamin B3 Market Share by Geography

For more insights on the market share of various regions, Request Free Sample

The market is experiencing growth due to increasing consumer awareness of its health benefits. Vitamin B3, also known as niacin or nicotinic acid, is an organic compound essential for human and animal nutrition. It is found naturally in foods such as tuna, salmon, vegetables, and processed foods, but deficiency can occur. Niacin supplements are available in various forms, including powder, granular, and liquid, for those with deficiencies or for fortification purposes. Niacin plays a crucial role in human and animal health, aiding In the production of energy, reducing high blood cholesterol levels, and improving disease resistance. In the healthcare sector, it is used to treat conditions such as anemia, headaches, tiredness, and nausea.

Market Dynamics

Our researchers analyzed the data with 2023 as the base year, along with the key drivers, trends, and challenges. A holistic analysis of drivers will help companies refine their marketing strategies to gain a competitive advantage.

What are the key market drivers leading to the rise In the adoption of Vitamin B3 Industry?

Increasing prevalence of vitamin B3 deficiency is the key driver of the market.

  • The market is experiencing significant growth due to increasing consumer awareness regarding the importance of maintaining good health and preventing diseases. Vitamin B3, also known as niacin or nicotinic acid, is an essential organic compound that plays a crucial role in human and animal nutrition. It is used in various industries, including pharmaceuticals, feed additives, cosmeceuticals, and food fortification programs. Deficiency of vitamin B3 can lead to various health issues such as pellagra, dermatitis, dementia, and diarrhea. With changing consumer lifestyles, urbanization, and dietary diversification, the incidence of vitamin B3 deficiency is on the rise. This trend is driving the demand for niacin supplements, which are used to treat and prevent deficiency symptoms such as nausea, anemia, headaches, and tiredness.
  • The processed food industry's reliance on fortified packaged foods and food regulatory bodies' focus on ensuring adequate nutrient intake through food fortification programs are also contributing to the market's growth. In addition, the development of product offerings in various forms, including powder, granular, and liquid, catering to diverse consumer preferences, is further fueling market expansion. The healthcare expenditure on nutritional products, including vitamin B3 supplements, is expected to continue rising as consumers prioritize disease resistance and overall health consciousness. The market's growth is also influenced by the increasing popularity of healthy food products and the growing demand for fortified feed products in animal nutrition.

What are the market trends shaping the Vitamin B3 Industry?

Increasing consumer spending on nutrient supplements is the upcoming market trend.

  • The market is experiencing growth due to increasing consumer spending and the rising demand for nutrient-rich processed foods. With a growing population and urbanization, there is a significant increase In the consumption of packaged and dehydrated food products. This trend is particularly prominent among expatriates and working populations with hectic lifestyles. Vitamin B3, also known as niacin or nicotinic acid, is an essential organic compound that plays a crucial role in human and animal nutrition. It is used in various industries, including pharmaceuticals, feed additives, cosmeceuticals, and food fortification. Niacin and niacinamide are the two primary forms of vitamin B3 used In these industries.
  • In the human nutrition segment, niacin supplements are used to treat and prevent deficiencies related to high blood cholesterol, anemia, headaches, tiredness, and other health issues. In animal nutrition, it is used as a feed additive to improve disease resistance and enhance growth. In the cosmeceutical industry, it is used in skincare products due to its antioxidant properties. The development of new product offerings, such as powder, granular, and liquid forms of vitamin B3, is expected to further fuel market growth. The healthcare expenditure on nutritional products and food regulatory bodies' focus on food fortification programs are also contributing factors.

What challenges does the Vitamin B3 Industry face during its growth?

Regulatory control on supplement usage limit is a key challenge affecting the industry growth.

  • Vitamin B3, also known as niacin or nicotinic acid, is an essential organic compound In the B3 complex group. It plays a vital role in human and animal nutrition, particularly in energy production, DNA repair, and disease resistance. Niacin supplements are available in various forms, including powder, granular, and liquid, for use in human and animal nutrition, feed additives, cosmeceuticals, and fortified food products. Pharmaceutical-grade niacin is used to treat high blood cholesterol levels, while niacinamide is used to alleviate symptoms of anemia, headaches, tiredness, and other health issues. Niacin deficiency can lead to various health complications, including pellagra and dermatitis.
  • In the US, the Food and Drug Administration (FDA) regulates the manufacturing and use of niacin supplements. The Recommended Dietary Allowances (RDAs) for niacin are 14 mg niacin equivalents (NE) for women, 16 mg NE for men, 18 mg NE for pregnant women, and 17 mg NE for lactating women. Consuming niacin supplements in excess of these recommended amounts can lead to side effects such as flushing. Niacin is found naturally in various food sources, including tuna, salmon, vegetables, and dairy products. Processed food products and food fortification programs have increased the availability of niacin In the diet.

Exclusive Customer Landscape

The market forecasting report includes the adoption lifecycle of the market, covering from the innovator's stage to the laggard's stage. It focuses on adoption rates in different regions based on penetration. Furthermore, the market report also includes key purchase criteria and drivers of price sensitivity to help companies evaluate and develop their market growth analysis strategies.
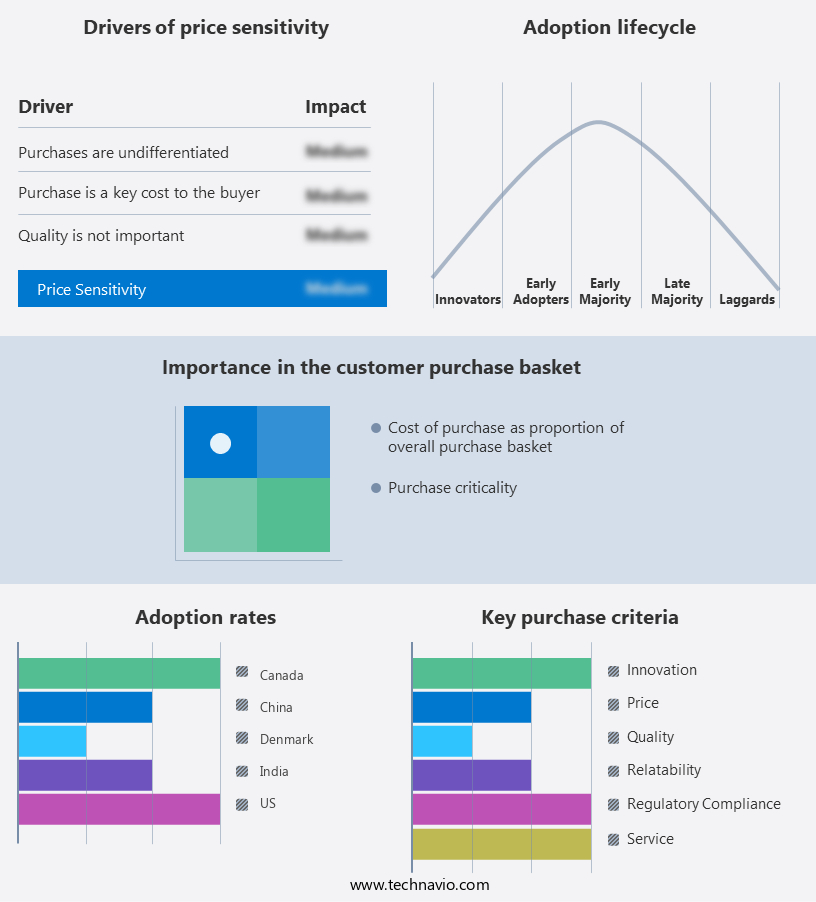
Vitamin B3 Market Share by Geography

 Customer Landscape

Key Companies & Market Insights

Companies are implementing various strategies, such as strategic alliances, market forecast, partnerships, mergers and acquisitions, geographical expansion, and product/service launches, to enhance their presence in the industry.

The industry research and growth report includes detailed analyses of the competitive landscape of the market and information about key companies, including:

  • Agro Cool India Ltd.
  • Brother Enterprises Holding Co. Ltd.
  • ChromaDex Inc.
  • Foodchem International Corp.
  • Glanbia plc
  • Jubilant Pharmova Ltd.
  • Koninklijke DSM NV
  • Lasons India Pvt. Ltd.
  • Lonza Group Ltd.
  • Merck KGaA
  • Shandong Hongda Biotechnology Co. Ltd.
  • Spectrum Laboratory Products Inc.
  • TER HELL and Co. GmbH
  • The Chemical Co.
  • Twinlab Consolidated Holdings Inc.
  • Vanetta Ltd.
  • Veer Chemie and Aromatics Pvt. Ltd.
  • Vertellus Holdings LLC
  • Western Drugs Ltd.
  • Yuki Gosei Kogyo Co. Ltd.

Qualitative and quantitative analysis of companies has been conducted to help clients understand the wider business environment as well as the strengths and weaknesses of key industry players. Data is qualitatively analyzed to categorize companies as pure play, category-focused, industry-focused, and diversified; it is quantitatively analyzed to categorize companies as dominant, leading, strong, tentative, and weak.

Research Analyst Overview

Vitamin B3, also known as niacin or nicotinic acid, is an essential organic compound that plays a crucial role in various metabolic processes in both human and animal nutrition. This micronutrient is a vital component of the B-complex group, which is essential for the production of energy from food and the synthesis of certain amino acids and nucleotides. The global market for Vitamin B3 has been witnessing significant growth due to the increasing awareness of its health benefits and the rising demand for nutritional products. This trend is observed across various sectors, including human nutrition, animal nutrition, and cosmeceuticals.

Moreover, in the human nutrition segment, the demand for niacin supplements has been growing due to their ability to help address various health concerns. These include high blood cholesterol levels, anemia, headaches, tiredness, and nausea. Niacin and niacinamide are commonly used In the form of powder, granular, or liquid supplements to meet the daily recommended intake of this essential nutrient. The animal nutrition sector also relies heavily on Vitamin B3, particularly In the form of feed additives. This is to ensure that livestock and poultry receive adequate amounts of this nutrient In their diets. The use of Vitamin B3 in animal feed fortification has been shown to improve disease resistance, enhance growth, and promote overall health and productivity.

Furthermore, the cosmeceutical industry has also seen the development of Vitamin B3-based products. These include creams, lotions, and serums that help improve skin health and appearance by reducing inflammation, improving skin elasticity, and reducing the appearance of fine lines and wrinkles. The processed food industry has also been a significant contributor to the growth of the market. Fortified packaged foods, such as breakfast cereals, energy bars, and baked goods, are common sources of this nutrient. The increasing trend of urbanization and changing consumer lifestyles has led to a greater demand for convenient and nutritious food options, driving the growth of the processed food industry and, in turn, the market.

Despite the growing demand for Vitamin B3, there are challenges facing the market. One of the primary challenges is the lack of available ingredients to meet the increasing demand. This has led to the development of new production methods and technologies to increase the availability and affordability of this essential nutrient. Another challenge is the regulatory landscape for Vitamin B3-containing products. Food regulatory bodies have set strict guidelines for the use and labeling of Vitamin B3 in food and nutritional products. Compliance with these regulations can be costly and time-consuming, which may limit the entry of new players into the market.

In addition, the market is expected to continue growing due to the increasing awareness of its health benefits and the rising demand for nutritional products across various sectors. However, challenges such as the lack of available ingredients and regulatory compliance may limit the growth of the market. Despite these challenges, the future of the market looks promising, with ongoing research and development efforts aimed at addressing these challenges and expanding the applications of this essential nutrient.

Market Scope

Report Coverage

Details

Page number

131

Base year

2023

Historic period

2018-2022

Forecast period

2024-2028

Growth momentum & CAGR

Accelerate at a CAGR of 4.49%

Market growth 2024-2028

USD 84.8 million

Market structure

Fragmented

YoY growth 2023-2024(%)

4.23

Key countries

US, Denmark, China, Canada, and India

Competitive landscape

Leading Companies, market growth and forecasting , Market Positioning of Companies, Competitive Strategies, and Industry Risks

Request Free Sample

What are the Key Data Covered in this Market Research and Growth Report?

  • CAGR of the Vitamin B3 industry during the forecast period
  • Detailed information on factors that will drive the growth and forecasting between 2024 and 2028
  • Precise estimation of the size of the market and its contribution of the industry in focus to the parent market
  • Accurate predictions about upcoming growth and trends and changes in consumer behaviour
  • Growth of the market across North America, Europe, Asia, and Rest of World (ROW)
  • Thorough analysis of the market's competitive landscape and detailed information about companies
  • Comprehensive analysis of factors that will challenge the vitamin b3 market growth of industry companies

We can help! Our analysts can customize this vitamin b3 market research report to meet your requirements.

Get in touch

1 Executive Summary

  • 1.1 Market overview
    • Executive Summary - Chart on Market Overview
    • Executive Summary - Data Table on Market Overview
    • Executive Summary - Chart on Global Market Characteristics
    • Executive Summary - Chart on Market by Geography
    • Executive Summary - Chart on Market Segmentation by Type
    • Executive Summary - Chart on Incremental Growth
    • Executive Summary - Data Table on Incremental Growth
    • Executive Summary - Chart on Company Market Positioning

2 Market Landscape

  • 2.1 Market ecosystem
    • Parent Market
    • Data Table on - Parent Market
  • 2.2 Market characteristics
    • Market characteristics analysis
  • 2.3 Value chain analysis
    • Value Chain Analysis

3 Market Sizing

  • 3.1 Market definition
    • Offerings of companies included in the market definition
  • 3.2 Market segment analysis
    • Market segments
  • 3.3 Market size 2023
    • 3.4 Market outlook: Forecast for 2023-2028
      • Chart on Global - Market size and forecast 2023-2028 ($ million)
      • Data Table on Global - Market size and forecast 2023-2028 ($ million)
      • Chart on Global Market: Year-over-year growth 2023-2028 (%)
      • Data Table on Global Market: Year-over-year growth 2023-2028 (%)

    4 Historic Market Size

    • 4.1 Global Vitamin B3 Market 2018 - 2022
      • Historic Market Size - Data Table on Global Vitamin B3 Market 2018 - 2022 ($ million)
    • 4.2 Type segment analysis 2018 - 2022
      • Historic Market Size - Type Segment 2018 - 2022 ($ million)
    • 4.3 Geography segment analysis 2018 - 2022
      • Historic Market Size - Geography Segment 2018 - 2022 ($ million)
    • 4.4 Country segment analysis 2018 - 2022
      • Historic Market Size - Country Segment 2018 - 2022 ($ million)

    5 Five Forces Analysis

    • 5.1 Five forces summary
      • Five forces analysis - Comparison between 2023 and 2028
    • 5.2 Bargaining power of buyers
      • Bargaining power of buyers - Impact of key factors 2023 and 2028
    • 5.3 Bargaining power of suppliers
      • Bargaining power of suppliers - Impact of key factors in 2023 and 2028
    • 5.4 Threat of new entrants
      • Threat of new entrants - Impact of key factors in 2023 and 2028
    • 5.5 Threat of substitutes
      • Threat of substitutes - Impact of key factors in 2023 and 2028
    • 5.6 Threat of rivalry
      • Threat of rivalry - Impact of key factors in 2023 and 2028
    • 5.7 Market condition
      • Chart on Market condition - Five forces 2023 and 2028

    6 Market Segmentation by Type

    • 6.1 Market segments
      • Chart on Type - Market share 2023-2028 (%)
      • Data Table on Type - Market share 2023-2028 (%)
    • 6.2 Comparison by Type
      • Chart on Comparison by Type
      • Data Table on Comparison by Type
    • 6.3 Food grade - Market size and forecast 2023-2028
      • Chart on Food grade - Market size and forecast 2023-2028 ($ million)
      • Data Table on Food grade - Market size and forecast 2023-2028 ($ million)
      • Chart on Food grade - Year-over-year growth 2023-2028 (%)
      • Data Table on Food grade - Year-over-year growth 2023-2028 (%)
    • 6.4 Pharmaceutical grade - Market size and forecast 2023-2028
      • Chart on Pharmaceutical grade - Market size and forecast 2023-2028 ($ million)
      • Data Table on Pharmaceutical grade - Market size and forecast 2023-2028 ($ million)
      • Chart on Pharmaceutical grade - Year-over-year growth 2023-2028 (%)
      • Data Table on Pharmaceutical grade - Year-over-year growth 2023-2028 (%)
    • 6.5 Market opportunity by Type
      • Market opportunity by Type ($ million)
      • Data Table on Market opportunity by Type ($ million)

    7 Customer Landscape

    • 7.1 Customer landscape overview
      • Analysis of price sensitivity, lifecycle, customer purchase basket, adoption rates, and purchase criteria

    8 Geographic Landscape

    • 8.1 Geographic segmentation
      • Chart on Market share by geography 2023-2028 (%)
      • Data Table on Market share by geography 2023-2028 (%)
    • 8.2 Geographic comparison
      • Chart on Geographic comparison
      • Data Table on Geographic comparison
    • 8.3 North America - Market size and forecast 2023-2028
      • Chart on North America - Market size and forecast 2023-2028 ($ million)
      • Data Table on North America - Market size and forecast 2023-2028 ($ million)
      • Chart on North America - Year-over-year growth 2023-2028 (%)
      • Data Table on North America - Year-over-year growth 2023-2028 (%)
    • 8.4 Europe - Market size and forecast 2023-2028
      • Chart on Europe - Market size and forecast 2023-2028 ($ million)
      • Data Table on Europe - Market size and forecast 2023-2028 ($ million)
      • Chart on Europe - Year-over-year growth 2023-2028 (%)
      • Data Table on Europe - Year-over-year growth 2023-2028 (%)
    • 8.5 Asia - Market size and forecast 2023-2028
      • Chart on Asia - Market size and forecast 2023-2028 ($ million)
      • Data Table on Asia - Market size and forecast 2023-2028 ($ million)
      • Chart on Asia - Year-over-year growth 2023-2028 (%)
      • Data Table on Asia - Year-over-year growth 2023-2028 (%)
    • 8.6 Rest of World (ROW) - Market size and forecast 2023-2028
      • Chart on Rest of World (ROW) - Market size and forecast 2023-2028 ($ million)
      • Data Table on Rest of World (ROW) - Market size and forecast 2023-2028 ($ million)
      • Chart on Rest of World (ROW) - Year-over-year growth 2023-2028 (%)
      • Data Table on Rest of World (ROW) - Year-over-year growth 2023-2028 (%)
    • 8.7 US - Market size and forecast 2023-2028
      • Chart on US - Market size and forecast 2023-2028 ($ million)
      • Data Table on US - Market size and forecast 2023-2028 ($ million)
      • Chart on US - Year-over-year growth 2023-2028 (%)
      • Data Table on US - Year-over-year growth 2023-2028 (%)
    • 8.8 Denmark - Market size and forecast 2023-2028
      • Chart on Denmark - Market size and forecast 2023-2028 ($ million)
      • Data Table on Denmark - Market size and forecast 2023-2028 ($ million)
      • Chart on Denmark - Year-over-year growth 2023-2028 (%)
      • Data Table on Denmark - Year-over-year growth 2023-2028 (%)
    • 8.9 China - Market size and forecast 2023-2028
      • Chart on China - Market size and forecast 2023-2028 ($ million)
      • Data Table on China - Market size and forecast 2023-2028 ($ million)
      • Chart on China - Year-over-year growth 2023-2028 (%)
      • Data Table on China - Year-over-year growth 2023-2028 (%)
    • 8.10 Canada - Market size and forecast 2023-2028
      • Chart on Canada - Market size and forecast 2023-2028 ($ million)
      • Data Table on Canada - Market size and forecast 2023-2028 ($ million)
      • Chart on Canada - Year-over-year growth 2023-2028 (%)
      • Data Table on Canada - Year-over-year growth 2023-2028 (%)
    • 8.11 India - Market size and forecast 2023-2028
      • Chart on India - Market size and forecast 2023-2028 ($ million)
      • Data Table on India - Market size and forecast 2023-2028 ($ million)
      • Chart on India - Year-over-year growth 2023-2028 (%)
      • Data Table on India - Year-over-year growth 2023-2028 (%)
    • 8.12 Market opportunity by geography
      • Market opportunity by geography ($ million)
      • Data Tables on Market opportunity by geography ($ million)

    9 Drivers, Challenges, and Opportunity/Restraints

    • 9.1 Market drivers
      • 9.2 Market challenges
        • 9.3 Impact of drivers and challenges
          • Impact of drivers and challenges in 2023 and 2028
        • 9.4 Market opportunities/restraints

          10 Competitive Landscape

          • 10.1 Overview
            • 10.2 Competitive Landscape
              • Overview on criticality of inputs and factors of differentiation
            • 10.3 Landscape disruption
              • Overview on factors of disruption
            • 10.4 Industry risks
              • Impact of key risks on business

            11 Competitive Analysis

            • 11.1 Companies profiled
              • Companies covered
            • 11.2 Market positioning of companies
              • Matrix on companies position and classification
            • 11.3 Brother Enterprises Holding Co. Ltd.
              • Brother Enterprises Holding Co. Ltd. - Overview
              • Brother Enterprises Holding Co. Ltd. - Product / Service
              • Brother Enterprises Holding Co. Ltd. - Key offerings
            • 11.4 Foodchem International Corp.
              • Foodchem International Corp. - Overview
              • Foodchem International Corp. - Product / Service
              • Foodchem International Corp. - Key offerings
            • 11.5 Jubilant Pharmova Ltd.
              • Jubilant Pharmova Ltd. - Overview
              • Jubilant Pharmova Ltd. - Business segments
              • Jubilant Pharmova Ltd. - Key news
              • Jubilant Pharmova Ltd. - Key offerings
              • Jubilant Pharmova Ltd. - Segment focus
            • 11.6 Koninklijke DSM NV
              • Koninklijke DSM NV - Overview
              • Koninklijke DSM NV - Business segments
              • Koninklijke DSM NV - Key news
              • Koninklijke DSM NV - Key offerings
              • Koninklijke DSM NV - Segment focus
            • 11.7 Lasons India Pvt. Ltd.
              • Lasons India Pvt. Ltd. - Overview
              • Lasons India Pvt. Ltd. - Product / Service
              • Lasons India Pvt. Ltd. - Key offerings
            • 11.8 Lonza Group Ltd.
              • Lonza Group Ltd. - Overview
              • Lonza Group Ltd. - Business segments
              • Lonza Group Ltd. - Key news
              • Lonza Group Ltd. - Key offerings
              • Lonza Group Ltd. - Segment focus
            • 11.9 Shandong Hongda Biotechnology Co. Ltd.
              • Shandong Hongda Biotechnology Co. Ltd. - Overview
              • Shandong Hongda Biotechnology Co. Ltd. - Product / Service
              • Shandong Hongda Biotechnology Co. Ltd. - Key offerings
            • 11.10 Twinlab Consolidated Holdings Inc.
              • Twinlab Consolidated Holdings Inc. - Overview
              • Twinlab Consolidated Holdings Inc. - Product / Service
              • Twinlab Consolidated Holdings Inc. - Key offerings
            • 11.11 Vanetta Ltd.
              • Vanetta Ltd. - Overview
              • Vanetta Ltd. - Product / Service
              • Vanetta Ltd. - Key offerings
            • 11.12 Vertellus Holdings LLC
              • Vertellus Holdings LLC - Overview
              • Vertellus Holdings LLC - Product / Service
              • Vertellus Holdings LLC - Key offerings

            12 Appendix

            • 12.1 Scope of the report
              • 12.2 Inclusions and exclusions checklist
                • Inclusions checklist
                • Exclusions checklist
              • 12.3 Currency conversion rates for US$
                • Currency conversion rates for US$
              • 12.4 Research methodology
                • Research methodology
              • 12.5 Data procurement
                • Information sources
              • 12.6 Data validation
                • Data validation
              • 12.7 Validation techniques employed for market sizing
                • Validation techniques employed for market sizing
              • 12.8 Data synthesis
                • Data synthesis
              • 12.9 360 degree market analysis
                • 360 degree market analysis
              • 12.10 List of abbreviations
                • List of abbreviations

              Research Methodology

              Technavio presents a detailed picture of the market by way of study, synthesis, and summation of data from multiple sources. The analysts have presented the various facets of the market with a particular focus on identifying the key industry influencers. The data thus presented is comprehensive, reliable, and the result of extensive research, both primary and secondary.

              INFORMATION SOURCES

              Primary sources

              • Manufacturers and suppliers
              • Channel partners
              • Industry experts
              • Strategic decision makers

              Secondary sources

              • Industry journals and periodicals
              • Government data
              • Financial reports of key industry players
              • Historical data
              • Press releases

              DATA ANALYSIS

              Data Synthesis

              • Collation of data
              • Estimation of key figures
              • Analysis of derived insights

              Data Validation

              • Triangulation with data models
              • Reference against proprietary databases
              • Corroboration with industry experts

              REPORT WRITING

              Qualitative

              • Market drivers
              • Market challenges
              • Market trends
              • Five forces analysis

              Quantitative

              • Market size and forecast
              • Market segmentation
              • Geographical insights
              • Competitive landscape

              Interested in this report?

              Get your sample now to see our research methodology and insights!

              Download Now

              Frequently Asked Questions

              Vitamin B3 market growth will increase by $ 84.8 mn during 2024-2028 .

              The Vitamin B3 market is expected to grow at a CAGR of 4.49% during 2024-2028 .

              Vitamin B3 market is segmented by Type( Food grade, Pharmaceutical grade)

              Agro Cool India Ltd., Brother Enterprises Holding Co. Ltd., ChromaDex Inc., Foodchem International Corp., Glanbia plc, Jubilant Pharmova Ltd., Koninklijke DSM NV, Lasons India Pvt. Ltd., Lonza Group Ltd., Merck KGaA, Shandong Hongda Biotechnology Co. Ltd., Spectrum Laboratory Products Inc., TER HELL and Co. GmbH, The Chemical Co., Twinlab Consolidated Holdings Inc., Vanetta Ltd., Veer Chemie and Aromatics Pvt. Ltd., Vertellus Holdings LLC, Western Drugs Ltd., Yuki Gosei Kogyo Co. Ltd. are a few of the key vendors in the Vitamin B3 market.

              North America will register the highest growth rate of 38% among the other regions. Therefore, the Vitamin B3 market in North America is expected to garner significant business opportunities for the vendors during the forecast period.

              US, Denmark, China, Canada, India

              • Increasing prevalence of vitamin B3 deficiencyConsumers have recognized the important role of food and vitamin supplements in creating a healthy lifestyle. They are increasingly adopting supplement products to achieve a wide range of health benefits. The growing awareness about the benefits of vitamin supplements in preventing the onset of diseases is boosting the growth of the global vitamin B3 market.With lifestyle changes amid hectic work schedules is the driving factor this market.
              • consumers find it difficult to maintain proper health and consume essential nutrients. The deficiency of vitamin B3 leads to weak immunity and causes diseases such as pellagra is the driving factor this market.
              • dermatitis is the driving factor this market.
              • dementia is the driving factor this market.
              • and diarrhea is the driving factor this market.
              • which are increasing among consumers. The rising number of dermatitis and skin-related cases will increase the demand for vitamin B3 supplements is the driving factor this market.
              • which will drive the growth of the market during the forecast period. According to the National Institutes of Health (NIH) is the driving factor this market.
              • the Dietary Supplement Label Database recommends 16 milligrams (mg) of vitamin B3 in one day for people aged 4 years and above who are consuming a 2 is the driving factor this market.
              • 000-calorie diet. Additionally is the driving factor this market.
              • there has been a gradual increase in the geriatric population gradually. According to the United Nations Organization is the driving factor this market.
              • the global geriatric population will exceed 1.5 billion people by 2050. This implies that by 2050 is the driving factor this market.
              • 16% of the world population will be aged 65 years or older. The elderly population are at high risk of having vitamin B3 deficiency. The increasing prevalence of vitamin B3 deficiency will increase the demand for vitamin B3 supplements and boost the growth of the global vitamin B3 market during the forecast period. is the driving factor this market.

              The Vitamin B3 market vendors should focus on grabbing business opportunities from the Food grade segment as it accounted for the largest market share in the base year.