Water As A Fuel Market Analysis, Size, and Forecast 2025-2029: North America (US, Canada, and Mexico), APAC (China, Japan, and India), Europe (Germany, UK, and France), South America (Brazil, Argentina, and Colombia), Middle East and Africa (South Africa, UAE, and Saudi Arabia), and Rest of World (ROW)

Water As A Fuel Market Analysis, Size, and Forecast 2025-2029:
North America (US, Canada, and Mexico), APAC (China, Japan, and India), Europe (Germany, UK, and France), South America (Brazil, Argentina, and Colombia), Middle East and Africa (South Africa, UAE, and Saudi Arabia), and Rest of World (ROW)

Published: Dec 2025 295 Pages SKU: IRTNTR81142

Market Overview at a Glance

$4.68 B
Market Opportunity
12.5%
CAGR 2024 - 2029
39.3%
North America Growth
$2.85 B
Hydrogen fuel segment 2023

Water As A Fuel Market Size 2025-2029

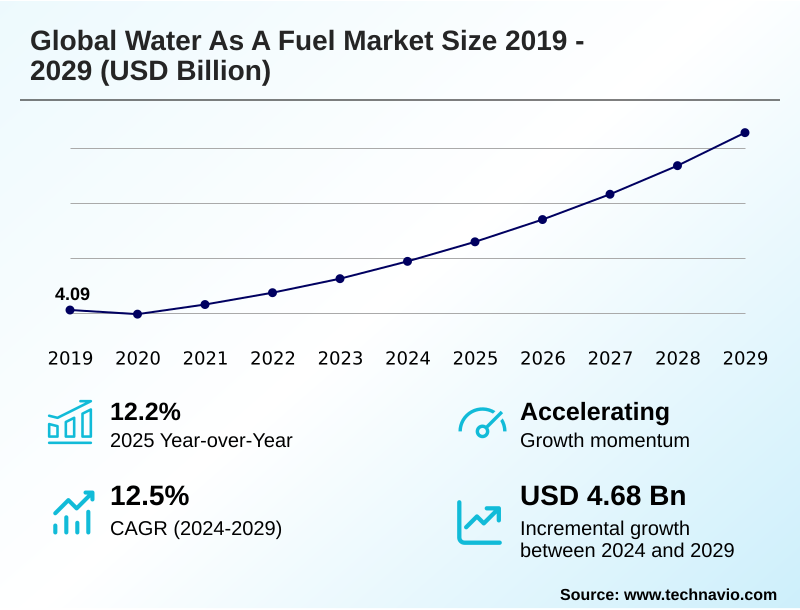
The water as a fuel market size is valued to increase by USD 4.68 billion, at a CAGR of 12.5% from 2024 to 2029. Global decarbonization policies and net-zero commitments will drive the water as a fuel market.

Major Market Trends & Insights

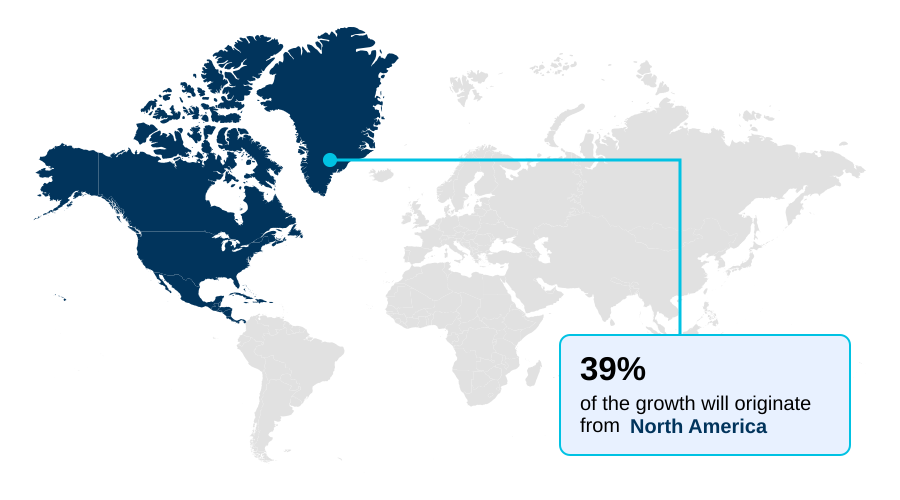
  • North America dominated the market and accounted for a 39.3% growth during the forecast period.
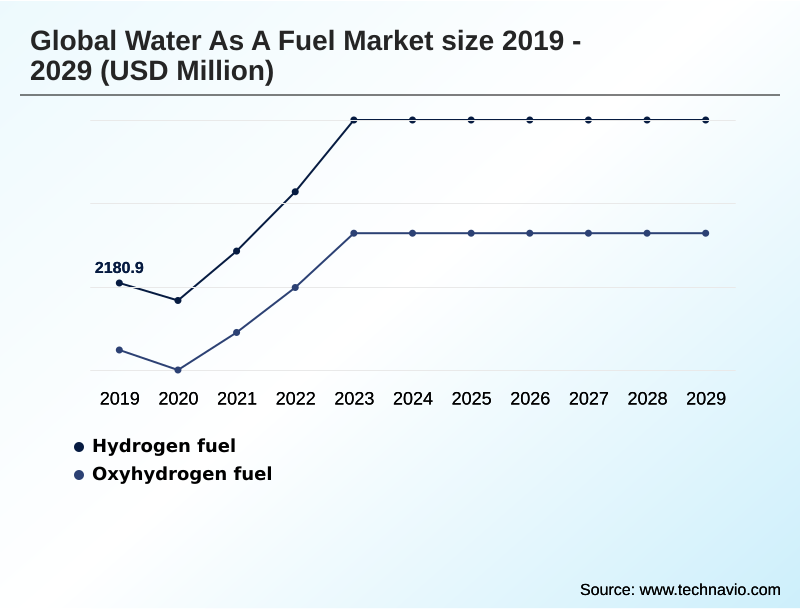
  • By Type - Hydrogen fuel segment was valued at USD 2.85 billion in 2023
  • By Technology - Natural gas reforming segment accounted for the largest market revenue share in 2023

Market Size & Forecast

  • Market Opportunities: USD 6.45 billion
  • Market Future Opportunities: USD 4.68 billion
  • CAGR from 2024 to 2029 : 12.5%

Market Summary

  • The water as a fuel market is foundational to the global energy transition, driven by the dual imperatives of achieving net-zero emissions and enhancing energy security. This market centers on producing hydrogen from water via electrolysis, a process that, when powered by renewables, yields a zero-emission energy carrier.
  • A key trend is the strategic development of hydrogen hubs that co-locate production with industrial offtake, creating economies of scale. However, the sector faces significant hurdles, including the high production cost of green hydrogen compared to fossil-based alternatives and the lack of dedicated storage and transport infrastructure.
  • For instance, a global logistics firm seeking to decarbonize its fleet must weigh the rapid refueling of hydrogen-powered trucks, which can restore full range in minutes, against the operational complexities and capital costs of establishing a private hydrogen refueling network, illustrating the practical trade-offs that define the current market landscape.

What will be the Size of the Water As A Fuel Market during the forecast period?

Get Key Insights on Market Forecast (PDF) Request Free Sample

How is the Water As A Fuel Market Segmented?

The water as a fuel industry research report provides comprehensive data (region-wise segment analysis), with forecasts and estimates in "USD million" for the period 2025-2029, as well as historical data from 2019-2023 for the following segments.

  • Type
    • Hydrogen fuel
    • Oxyhydrogen fuel
  • Technology
    • Natural gas reforming
    • Electrolysis
  • End-user
    • Transportation
    • Power generation
    • Material handling equipment
    • Others
  • Geography
    • North America
      • US
      • Canada
      • Mexico
    • APAC
      • China
      • Japan
      • India
    • Europe
      • Germany
      • UK
      • France
    • South America
      • Brazil
      • Argentina
      • Colombia
    • Middle East and Africa
      • South Africa
      • UAE
      • Saudi Arabia
    • Rest of World (ROW)

By Type Insights

The hydrogen fuel segment is estimated to witness significant growth during the forecast period.

The hydrogen fuel segment is pivotal, focusing on producing high-purity hydrogen for applications where battery power is insufficient.

In the push for zero-emission transportation solutions and clean mobility solutions, this segment powers hydrogen fuel cell systems and advanced fuel cell powertrain designs.

This is central to the national hydrogen strategy of many countries aiming for the decarbonization of heavy industry.

For heavy-duty hydrogen-powered mobility, refueling from compressed hydrogen storage takes minutes, a significant operational advantage that reduces downtime by over 95% compared to battery charging.

Development of integrated hydrogen hubs and hydrogen valley development projects supports the necessary hydrogen refueling stations infrastructure, targeting hard-to-abate sector decarbonization. This contrasts with niche applications like stoichiometric oxyhydrogen combustion.

Request Free Sample

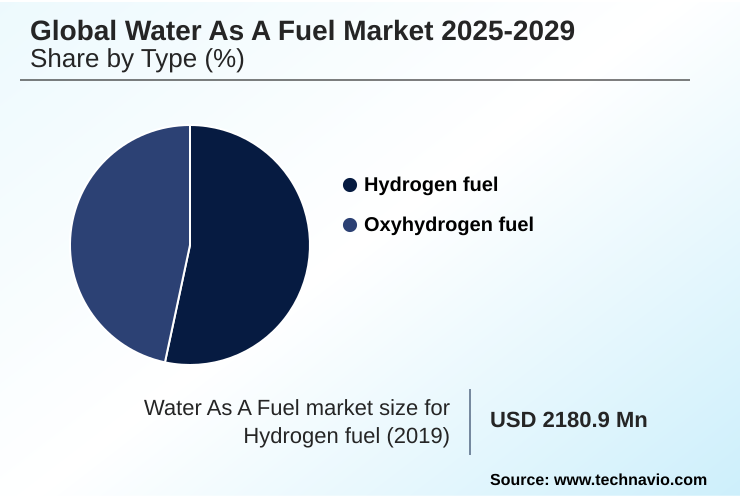
The Hydrogen fuel segment was valued at USD 2.85 billion in 2023 and showed a gradual increase during the forecast period.

Request Free Sample

Regional Analysis

North America is estimated to contribute 39.3% to the growth of the global market during the forecast period.Technavio’s analysts have elaborately explained the regional trends and drivers that shape the market during the forecast period.

See How Water As A Fuel Market Demand is Rising in North America Request Free Sample

The geographic landscape is defined by a division between production and consumption hubs, fostering a global hydrogen economy ecosystem.

Regions with favorable renewable energy integration, such as Australia and Chile, are developing giga-scale export projects focused on industrial hydrogen feedstock and derivatives.

In Europe, proton exchange membrane electrolysis is favored for its flexibility, while solid oxide electrolysis cell technology is explored for high-efficiency industrial process decarbonization.

In North America, the focus includes on-site hydrogen generation and retrofitting power plants with hydrogen-ready gas turbines. The US, accounting for almost 40% of incremental growth, is advancing the direct reduced iron process for green steel production.

Mature technologies like alkaline water electrolysis enable cost-effective green industrial feedstock production, enhancing grid stability and balancing.

Market Dynamics

Our researchers analyzed the data with 2024 as the base year, along with the key drivers, trends, and challenges. A holistic analysis of drivers will help companies refine their marketing strategies to gain a competitive advantage.

  • The trajectory of the global water as a fuel market hinges on resolving several interconnected factors, beginning with the economic viability of green hydrogen versus blue hydrogen, where policy incentives play a critical role.
  • A primary focus is the cost reduction in electrolysis technology for green hydrogen, which is being driven by scaling up electrolyzer manufacturing for cost parity with conventional methods. This effort is complemented by extensive water as a fuel research and development and advancements in proton exchange membrane fuel cells, alongside parallel work on solid oxide electrolysis for high-efficiency hydrogen.
  • The integration of renewables for hydrogen production is fundamental, but the industry concurrently faces significant challenges in hydrogen storage and distribution infrastructure. Policy impact on clean hydrogen production investments is crucial for underwriting the supply chain for green hydrogen export and establishing technical standards for cross-border hydrogen trade.
  • The role of hydrogen in long-duration grid energy storage and its use in hydrogen fuel cells for stationary power generation are key to grid stability.
  • Ultimately, success lies in using green hydrogen for industrial process decarbonization, developing hydrogen hubs for industrial clusters, and decarbonizing heavy-duty transport with hydrogen fuel cells, all while exploring green ammonia as a carrier for hydrogen trade and the potential of hydrogen as a fuel in the aviation industry.
  • The viability of steam methane reforming with carbon capture and the impact of geopolitics on hydrogen energy security remain important considerations.

What are the key market drivers leading to the rise in the adoption of Water As A Fuel Industry?

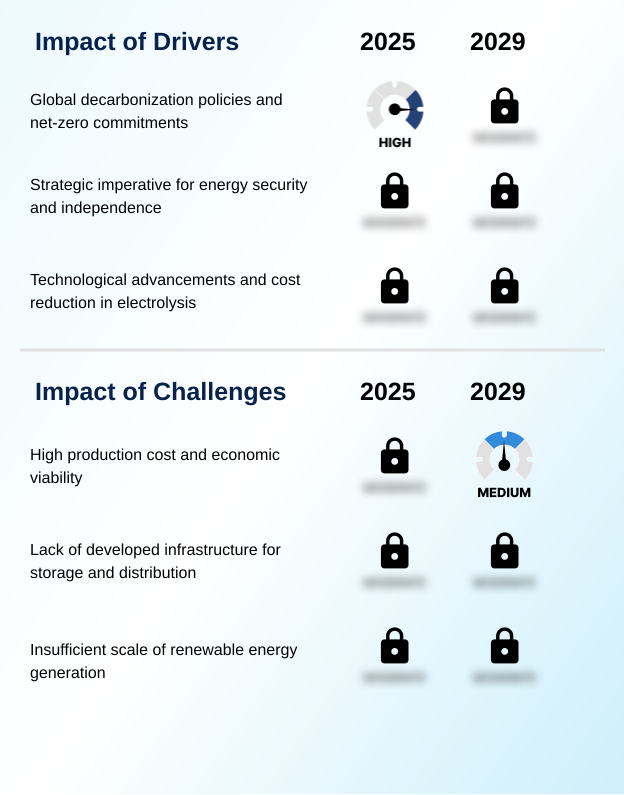
  • Global decarbonization policies and net-zero commitments are the primary drivers for the market, compelling industries to adopt water-derived hydrogen to meet stringent emissions targets.

  • The market is propelled by robust climate policy frameworks and binding net-zero emissions targets that mandate a shift toward cleaner energy.
  • This top-down push from global decarbonization policies creates demand for green hydrogen production, which is supported by incentives like the hydrogen production tax credit.
  • These policies stimulate investment in advanced electrolysis technology to lower electrolyzer capital expenditure, crucial for achieving a low-carbon hydrogen standard.
  • The adoption of renewable fuels of non-biological origin is becoming a core tenet of strategic energy independence, helping companies with future-proofing industrial operations.
  • By securing long-term renewable power purchase agreements, producers can ensure a viable zero-emission fuel cycle, reducing industrial carbon footprints by more than 70% in targeted applications.

What are the market trends shaping the Water As A Fuel Industry?

  • A key market trend is the development of large-scale hydrogen hubs and valleys. This approach co-locates production and consumption to create economies of scale and de-risk investments.

  • A significant trend is the focus on hydrogen derivatives as the primary medium for cross-border hydrogen trade and establishing a seaborne hydrogen commodity market. Green ammonia production and green methanol production offer a more practical alternative to liquefied hydrogen transport, as they are denser energy carriers and can leverage existing infrastructure, facilitating their role as a clean energy export commodity.
  • This pragmatic approach simplifies the hydrogen supply chain, with cryogenic liquid hydrogen reserved for specific applications. These sustainable maritime fuels are essential for reducing energy import dependency reduction. The build-out of pan-european hydrogen infrastructure and giga-scale green hydrogen projects accelerates this trend, with project financing for export-oriented facilities increasing by 40% in the last year.

What challenges does the Water As A Fuel Industry face during its growth?

  • The high production cost of green hydrogen and its overall economic viability compared to conventional fuels remain a key challenge affecting industry growth.

  • Key challenges temper market expansion, centering on the hydrogen production cost and the need to scale electrolyzer manufacturing capacity to achieve economies of scale. While water electrolysis technology is central, competition from the incumbent steam methane reforming process and autothermal reforming technology—even with carbon capture and storage—remains significant.
  • The push for grey hydrogen substitution is hampered by the lack of a pervasive hydrogen infrastructure backbone and decentralized energy networks. Creating resilient energy systems requires immense investment coordination.
  • Energy transition pathways are further complicated by the need for sector coupling strategies to balance supply and demand, with infrastructure gaps representing an investment deficit at least 20 times larger than current annual spending. A circular carbon economy model is still aspirational for this sector.

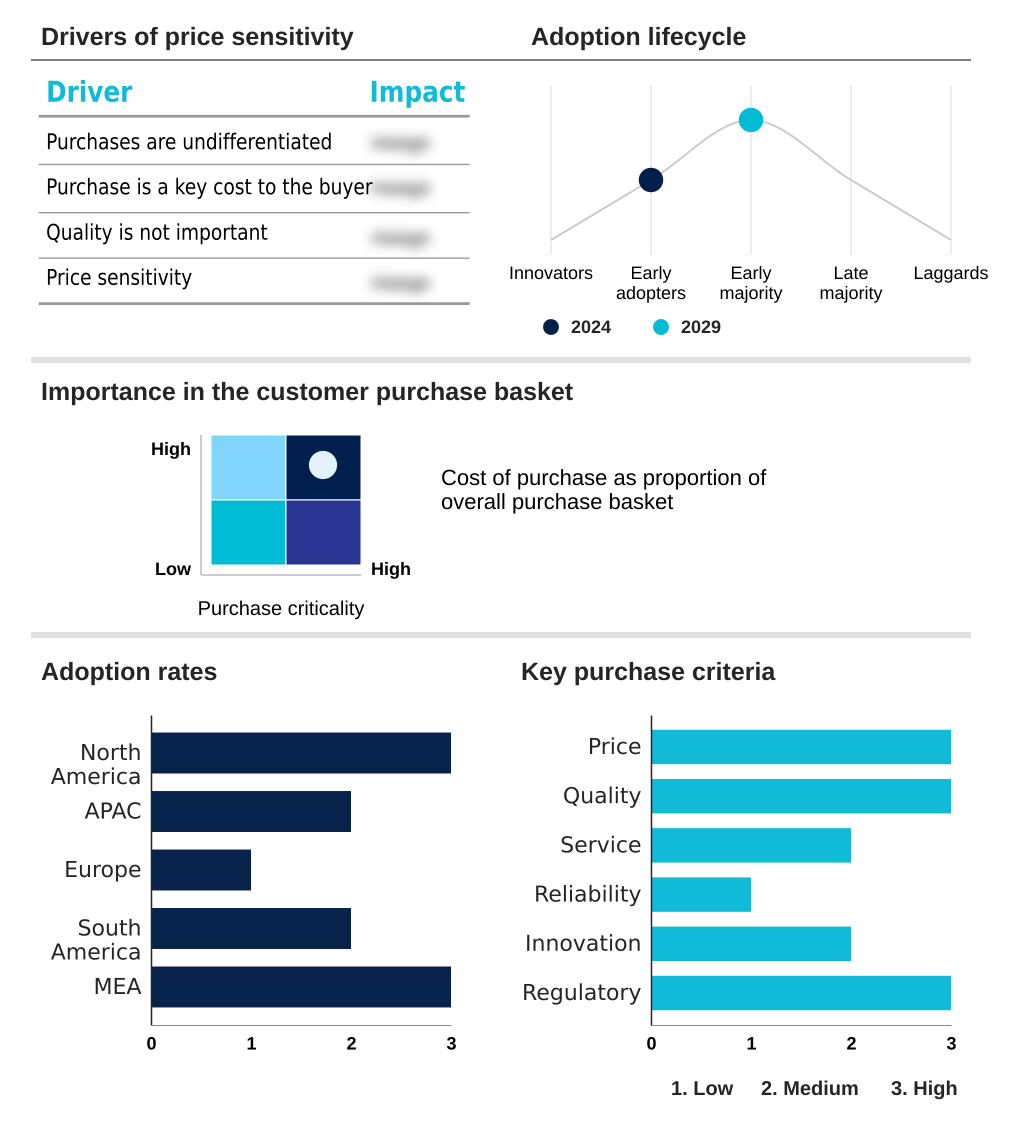
Exclusive Technavio Analysis on Customer Landscape

The water as a fuel market forecasting report includes the adoption lifecycle of the market, covering from the innovator’s stage to the laggard’s stage. It focuses on adoption rates in different regions based on penetration. Furthermore, the water as a fuel market report also includes key purchase criteria and drivers of price sensitivity to help companies evaluate and develop their market growth analysis strategies.

Customer Landscape of Water As A Fuel Industry

Competitive Landscape

Companies are implementing various strategies, such as strategic alliances, water as a fuel market forecast, partnerships, mergers and acquisitions, geographical expansion, and product/service launches, to enhance their presence in the industry.

Air Liquide SA - Delivers integrated hydrogen solutions, from electrolysis-based production to advanced fuel cell applications for clean energy generation.

The industry research and growth report includes detailed analyses of the competitive landscape of the market and information about key companies, including:

  • Air Liquide SA
  • Ballard Power Systems Inc.
  • Bloom Energy Corp.
  • Cummins Inc.
  • Enel Spa
  • ENGIE SA
  • Exxon Mobil Corp.
  • FuelCell Energy Inc.
  • Iberdrola SA
  • ITM Power PLC
  • Linde Plc
  • McPhy Energy SA
  • Nel ASA
  • Orsted AS
  • Panasonic Holdings Corp.
  • Plug Power Inc.
  • Siemens Energy AG
  • Sinopec Shanghai Co. Ltd.

Qualitative and quantitative analysis of companies has been conducted to help clients understand the wider business environment as well as the strengths and weaknesses of key industry players. Data is qualitatively analyzed to categorize companies as pure play, category-focused, industry-focused, and diversified; it is quantitatively analyzed to categorize companies as dominant, leading, strong, tentative, and weak.

Recent Development and News in Water as a fuel market

  • In September 2024, the governments of Germany and Australia solidified their bilateral Hydrogen Accord with a joint declaration to accelerate the development of a green hydrogen supply chain between the two nations.
  • In November 2024, Cummins Inc. announced the commercial rollout of its new generation of PEM electrolyzers, designed to increase green hydrogen output efficiency by 15% while reducing the use of scarce platinum group metals.
  • In January 2025, Air Liquide SA and the Port of Rotterdam jointly announced the final investment decision for a 200 MW electrolyzer plant, a key project for the port's ambition to become a major European hydrogen hub.
  • In March 2025, NEOM Green Hydrogen Co. confirmed the start of commercial operations for the first phase of its mega-plant, initiating the first shipments of green ammonia to targeted European and Asian markets.

Dive into Technavio’s robust research methodology, blending expert interviews, extensive data synthesis, and validated models for unparalleled Water As A Fuel Market insights. See full methodology.

Market Scope
Page number 295
Base year 2024
Historic period 2019-2023
Forecast period 2025-2029
Growth momentum & CAGR Accelerate at a CAGR of 12.5%
Market growth 2025-2029 USD 4678.7 million
Market structure Fragmented
YoY growth 2024-2025(%) 12.2%
Key countries US, Canada, Mexico, China, Japan, India, South Korea, Australia, Indonesia, Germany, UK, France, Italy, Spain, The Netherlands, Brazil, Argentina, Colombia, South Africa, UAE, Saudi Arabia, Israel and Turkey
Competitive landscape Leading Companies, Market Positioning of Companies, Competitive Strategies, and Industry Risks

Request Free Sample

Research Analyst Overview

  • The market is fundamentally reshaping the energy landscape, moving beyond niche applications toward becoming a cornerstone of industrial strategy. Boardroom decisions are now centered on the long-term capital allocation for grey hydrogen substitution, leveraging clean hydrogen production as a competitive differentiator.
  • This involves assessing the entire hydrogen supply chain, from sourcing water for electrolysis technology to the logistics of liquefied hydrogen transport. A key deliberation is the investment in industrial hydrogen feedstock for processes like the direct reduced iron process, versus deploying hydrogen-powered mobility solutions.
  • The viability of on-site hydrogen generation using advanced electrolysis technology, such as proton exchange membrane electrolysis or solid oxide electrolysis cell systems, is a critical variable. These systems, supported by incentives like the hydrogen production tax credit, can achieve a 20% lower operational cost in regions with low-cost renewables.
  • The conversation also includes hydrogen-ready gas turbines and hydrogen combustion engines, which offer pathways for decarbonizing existing assets. Strategic planning must navigate the complexities of hydrogen embrittlement issues in existing infrastructure and the high cost of compressed hydrogen storage and hydrogen refueling stations.
  • Firms are evaluating the transition from steam methane reforming process and autothermal reforming technology, with or without carbon capture and storage, to true zero-emission fuel cycle pathways using high-purity hydrogen.

What are the Key Data Covered in this Water As A Fuel Market Research and Growth Report?

  • What is the expected growth of the Water As A Fuel Market between 2025 and 2029?

    • USD 4.68 billion, at a CAGR of 12.5%

  • What segmentation does the market report cover?

    • The report is segmented by Type (Hydrogen fuel, and Oxyhydrogen fuel), Technology (Natural gas reforming, and Electrolysis), End-user (Transportation, Power generation, Material handling equipment, and Others) and Geography (North America, APAC, Europe, South America, Middle East and Africa)

  • Which regions are analyzed in the report?

    • North America, APAC, Europe, South America and Middle East and Africa

  • What are the key growth drivers and market challenges?

    • Global decarbonization policies and net-zero commitments, High production cost and economic viability

  • Who are the major players in the Water As A Fuel Market?

    • Air Liquide SA, Ballard Power Systems Inc., Bloom Energy Corp., Cummins Inc., Enel Spa, ENGIE SA, Exxon Mobil Corp., FuelCell Energy Inc., Iberdrola SA, ITM Power PLC, Linde Plc, McPhy Energy SA, Nel ASA, Orsted AS, Panasonic Holdings Corp., Plug Power Inc., Siemens Energy AG and Sinopec Shanghai Co. Ltd.

Market Research Insights

  • The market's dynamics are shaped by a strategic push for energy import dependency reduction and the decarbonization of heavy industry. Supportive climate policy frameworks are accelerating the development of a hydrogen economy ecosystem, with a focus on sector coupling strategies to enhance grid stability and balancing.
  • The pursuit of strategic energy independence is driving investment in resilient energy systems and giga-scale green hydrogen projects. This focus on zero-emission transportation solutions has resulted in a 30% increase in public funding for hydrogen refueling infrastructure in leading regions.
  • Furthermore, the use of green hydrogen as a green industrial feedstock can reduce the carbon intensity of products like steel by over 90%, creating a powerful incentive for industrial process decarbonization and the future-proofing of industrial operations.

We can help! Our analysts can customize this water as a fuel market research report to meet your requirements.

Get in touch

1. Executive Summary

1.1 Market overview

Executive Summary - Chart on Market Overview
Executive Summary - Data Table on Market Overview
Executive Summary - Chart on Global Market Characteristics
Executive Summary - Chart on Market by Geography
Executive Summary - Chart on Market Segmentation by Type
Executive Summary - Chart on Market Segmentation by Technology
Executive Summary - Chart on Market Segmentation by End-user
Executive Summary - Chart on Incremental Growth
Executive Summary - Data Table on Incremental Growth
Executive Summary - Chart on Company Market Positioning

2. Technavio Analysis

2.1 Analysis of price sensitivity, lifecycle, customer purchase basket, adoption rates, and purchase criteria

2.2 Criticality of inputs and Factors of differentiation

Chart on Overview on criticality of inputs and factors of differentiation

2.3 Factors of disruption

Chart on Overview on factors of disruption

2.4 Impact of drivers and challenges

Chart on Impact of drivers and challenges in 2024 and 2029

3. Market Landscape

3.1 Market ecosystem

Chart on Parent Market
Data Table on - Parent Market

3.2 Market characteristics

Chart on Market characteristics analysis

3.3 Value chain analysis

Chart on Value chain analysis

4. Market Sizing

4.1 Market definition

Data Table on Offerings of companies included in the market definition

4.2 Market segment analysis

Market segments

4.3 Market size 2024

4.4 Market outlook: Forecast for 2024-2029

Chart on Global - Market size and forecast 2024-2029 ($ million)
Data Table on Global - Market size and forecast 2024-2029 ($ million)
Chart on Global Market: Year-over-year growth 2024-2029 (%)
Data Table on Global Market: Year-over-year growth 2024-2029 (%)

5. Historic Market Size

5.1 Global Water As A Fuel Market 2019 - 2023

Historic Market Size - Data Table on Global Water As A Fuel Market 2019 - 2023 ($ million)

5.2 Type segment analysis 2019 - 2023

Historic Market Size - Type Segment 2019 - 2023 ($ million)

5.3 Technology segment analysis 2019 - 2023

Historic Market Size - Technology Segment 2019 - 2023 ($ million)

5.4 End-user segment analysis 2019 - 2023

Historic Market Size - End-user Segment 2019 - 2023 ($ million)

5.5 Geography segment analysis 2019 - 2023

Historic Market Size - Geography Segment 2019 - 2023 ($ million)

5.6 Country segment analysis 2019 - 2023

Historic Market Size - Country Segment 2019 - 2023 ($ million)

6. Qualitative Analysis

6.1 Impact of AI in global water as a fuel market

7. Five Forces Analysis

7.1 Five forces summary

Five forces analysis - Comparison between 2024 and 2029

7.2 Bargaining power of buyers

Bargaining power of buyers - Impact of key factors 2024 and 2029

7.3 Bargaining power of suppliers

Bargaining power of suppliers - Impact of key factors in 2024 and 2029

7.4 Threat of new entrants

Threat of new entrants - Impact of key factors in 2024 and 2029

7.5 Threat of substitutes

Threat of substitutes - Impact of key factors in 2024 and 2029

7.6 Threat of rivalry

Threat of rivalry - Impact of key factors in 2024 and 2029

7.7 Market condition

Chart on Market condition - Five forces 2024 and 2029

8. Market Segmentation by Type

8.1 Market segments

Chart on Type - Market share 2024-2029 (%)
Data Table on Type - Market share 2024-2029 (%)

8.2 Comparison by Type

Chart on Comparison by Type
Data Table on Comparison by Type

8.3 Hydrogen fuel - Market size and forecast 2024-2029

Chart on Hydrogen fuel - Market size and forecast 2024-2029 ($ million)
Data Table on Hydrogen fuel - Market size and forecast 2024-2029 ($ million)
Chart on Hydrogen fuel - Year-over-year growth 2024-2029 (%)
Data Table on Hydrogen fuel - Year-over-year growth 2024-2029 (%)

8.4 Oxyhydrogen fuel - Market size and forecast 2024-2029

Chart on Oxyhydrogen fuel - Market size and forecast 2024-2029 ($ million)
Data Table on Oxyhydrogen fuel - Market size and forecast 2024-2029 ($ million)
Chart on Oxyhydrogen fuel - Year-over-year growth 2024-2029 (%)
Data Table on Oxyhydrogen fuel - Year-over-year growth 2024-2029 (%)

8.5 Market opportunity by Type

Market opportunity by Type ($ million)
Data Table on Market opportunity by Type ($ million)

9. Market Segmentation by Technology

9.1 Market segments

Chart on Technology - Market share 2024-2029 (%)
Data Table on Technology - Market share 2024-2029 (%)

9.2 Comparison by Technology

Chart on Comparison by Technology
Data Table on Comparison by Technology

9.3 Natural gas reforming - Market size and forecast 2024-2029

Chart on Natural gas reforming - Market size and forecast 2024-2029 ($ million)
Data Table on Natural gas reforming - Market size and forecast 2024-2029 ($ million)
Chart on Natural gas reforming - Year-over-year growth 2024-2029 (%)
Data Table on Natural gas reforming - Year-over-year growth 2024-2029 (%)

9.4 Electrolysis - Market size and forecast 2024-2029

Chart on Electrolysis - Market size and forecast 2024-2029 ($ million)
Data Table on Electrolysis - Market size and forecast 2024-2029 ($ million)
Chart on Electrolysis - Year-over-year growth 2024-2029 (%)
Data Table on Electrolysis - Year-over-year growth 2024-2029 (%)

9.5 Market opportunity by Technology

Market opportunity by Technology ($ million)
Data Table on Market opportunity by Technology ($ million)

10. Market Segmentation by End-user

10.1 Market segments

Chart on End-user - Market share 2024-2029 (%)
Data Table on End-user - Market share 2024-2029 (%)

10.2 Comparison by End-user

Chart on Comparison by End-user
Data Table on Comparison by End-user

10.3 Transportation - Market size and forecast 2024-2029

Chart on Transportation - Market size and forecast 2024-2029 ($ million)
Data Table on Transportation - Market size and forecast 2024-2029 ($ million)
Chart on Transportation - Year-over-year growth 2024-2029 (%)
Data Table on Transportation - Year-over-year growth 2024-2029 (%)

10.4 Power generation - Market size and forecast 2024-2029

Chart on Power generation - Market size and forecast 2024-2029 ($ million)
Data Table on Power generation - Market size and forecast 2024-2029 ($ million)
Chart on Power generation - Year-over-year growth 2024-2029 (%)
Data Table on Power generation - Year-over-year growth 2024-2029 (%)

10.5 Material handling equipment - Market size and forecast 2024-2029

Chart on Material handling equipment - Market size and forecast 2024-2029 ($ million)
Data Table on Material handling equipment - Market size and forecast 2024-2029 ($ million)
Chart on Material handling equipment - Year-over-year growth 2024-2029 (%)
Data Table on Material handling equipment - Year-over-year growth 2024-2029 (%)

10.6 Others - Market size and forecast 2024-2029

Chart on Others - Market size and forecast 2024-2029 ($ million)
Data Table on Others - Market size and forecast 2024-2029 ($ million)
Chart on Others - Year-over-year growth 2024-2029 (%)
Data Table on Others - Year-over-year growth 2024-2029 (%)

10.7 Market opportunity by End-user

Market opportunity by End-user ($ million)
Data Table on Market opportunity by End-user ($ million)

11. Customer Landscape

11.1 Customer landscape overview

Analysis of price sensitivity, lifecycle, customer purchase basket, adoption rates, and purchase criteria

12. Geographic Landscape

12.1 Geographic segmentation

Chart on Market share by geography 2024-2029 (%)
Data Table on Market share by geography 2024-2029 (%)

12.2 Geographic comparison

Chart on Geographic comparison
Data Table on Geographic comparison

12.3 North America - Market size and forecast 2024-2029

Chart on North America - Market size and forecast 2024-2029 ($ million)
Data Table on North America - Market size and forecast 2024-2029 ($ million)
Chart on North America - Year-over-year growth 2024-2029 (%)
Data Table on North America - Year-over-year growth 2024-2029 (%)
Chart on Regional Comparison - North America
Data Table on Regional Comparison - North America

12.3.1 US - Market size and forecast 2024-2029

Chart on US - Market size and forecast 2024-2029 ($ million)
Data Table on US - Market size and forecast 2024-2029 ($ million)
Chart on US - Year-over-year growth 2024-2029 (%)
Data Table on US - Year-over-year growth 2024-2029 (%)

12.3.2 Canada - Market size and forecast 2024-2029

Chart on Canada - Market size and forecast 2024-2029 ($ million)
Data Table on Canada - Market size and forecast 2024-2029 ($ million)
Chart on Canada - Year-over-year growth 2024-2029 (%)
Data Table on Canada - Year-over-year growth 2024-2029 (%)

12.3.3 Mexico - Market size and forecast 2024-2029

Chart on Mexico - Market size and forecast 2024-2029 ($ million)
Data Table on Mexico - Market size and forecast 2024-2029 ($ million)
Chart on Mexico - Year-over-year growth 2024-2029 (%)
Data Table on Mexico - Year-over-year growth 2024-2029 (%)

12.4 APAC - Market size and forecast 2024-2029

Chart on APAC - Market size and forecast 2024-2029 ($ million)
Data Table on APAC - Market size and forecast 2024-2029 ($ million)
Chart on APAC - Year-over-year growth 2024-2029 (%)
Data Table on APAC - Year-over-year growth 2024-2029 (%)
Chart on Regional Comparison - APAC
Data Table on Regional Comparison - APAC

12.4.1 China - Market size and forecast 2024-2029

Chart on China - Market size and forecast 2024-2029 ($ million)
Data Table on China - Market size and forecast 2024-2029 ($ million)
Chart on China - Year-over-year growth 2024-2029 (%)
Data Table on China - Year-over-year growth 2024-2029 (%)

12.4.2 Japan - Market size and forecast 2024-2029

Chart on Japan - Market size and forecast 2024-2029 ($ million)
Data Table on Japan - Market size and forecast 2024-2029 ($ million)
Chart on Japan - Year-over-year growth 2024-2029 (%)
Data Table on Japan - Year-over-year growth 2024-2029 (%)

12.4.3 India - Market size and forecast 2024-2029

Chart on India - Market size and forecast 2024-2029 ($ million)
Data Table on India - Market size and forecast 2024-2029 ($ million)
Chart on India - Year-over-year growth 2024-2029 (%)
Data Table on India - Year-over-year growth 2024-2029 (%)

12.4.4 South Korea - Market size and forecast 2024-2029

Chart on South Korea - Market size and forecast 2024-2029 ($ million)
Data Table on South Korea - Market size and forecast 2024-2029 ($ million)
Chart on South Korea - Year-over-year growth 2024-2029 (%)
Data Table on South Korea - Year-over-year growth 2024-2029 (%)

12.4.5 Australia - Market size and forecast 2024-2029

Chart on Australia - Market size and forecast 2024-2029 ($ million)
Data Table on Australia - Market size and forecast 2024-2029 ($ million)
Chart on Australia - Year-over-year growth 2024-2029 (%)
Data Table on Australia - Year-over-year growth 2024-2029 (%)

12.4.6 Indonesia - Market size and forecast 2024-2029

Chart on Indonesia - Market size and forecast 2024-2029 ($ million)
Data Table on Indonesia - Market size and forecast 2024-2029 ($ million)
Chart on Indonesia - Year-over-year growth 2024-2029 (%)
Data Table on Indonesia - Year-over-year growth 2024-2029 (%)

12.5 Europe - Market size and forecast 2024-2029

Chart on Europe - Market size and forecast 2024-2029 ($ million)
Data Table on Europe - Market size and forecast 2024-2029 ($ million)
Chart on Europe - Year-over-year growth 2024-2029 (%)
Data Table on Europe - Year-over-year growth 2024-2029 (%)
Chart on Regional Comparison - Europe
Data Table on Regional Comparison - Europe

12.5.1 Germany - Market size and forecast 2024-2029

Chart on Germany - Market size and forecast 2024-2029 ($ million)
Data Table on Germany - Market size and forecast 2024-2029 ($ million)
Chart on Germany - Year-over-year growth 2024-2029 (%)
Data Table on Germany - Year-over-year growth 2024-2029 (%)

12.5.2 UK - Market size and forecast 2024-2029

Chart on UK - Market size and forecast 2024-2029 ($ million)
Data Table on UK - Market size and forecast 2024-2029 ($ million)
Chart on UK - Year-over-year growth 2024-2029 (%)
Data Table on UK - Year-over-year growth 2024-2029 (%)

12.5.3 France - Market size and forecast 2024-2029

Chart on France - Market size and forecast 2024-2029 ($ million)
Data Table on France - Market size and forecast 2024-2029 ($ million)
Chart on France - Year-over-year growth 2024-2029 (%)
Data Table on France - Year-over-year growth 2024-2029 (%)

12.5.4 Italy - Market size and forecast 2024-2029

Chart on Italy - Market size and forecast 2024-2029 ($ million)
Data Table on Italy - Market size and forecast 2024-2029 ($ million)
Chart on Italy - Year-over-year growth 2024-2029 (%)
Data Table on Italy - Year-over-year growth 2024-2029 (%)

12.5.5 Spain - Market size and forecast 2024-2029

Chart on Spain - Market size and forecast 2024-2029 ($ million)
Data Table on Spain - Market size and forecast 2024-2029 ($ million)
Chart on Spain - Year-over-year growth 2024-2029 (%)
Data Table on Spain - Year-over-year growth 2024-2029 (%)

12.5.6 The Netherlands - Market size and forecast 2024-2029

Chart on The Netherlands - Market size and forecast 2024-2029 ($ million)
Data Table on The Netherlands - Market size and forecast 2024-2029 ($ million)
Chart on The Netherlands - Year-over-year growth 2024-2029 (%)
Data Table on The Netherlands - Year-over-year growth 2024-2029 (%)

12.6 South America - Market size and forecast 2024-2029

Chart on South America - Market size and forecast 2024-2029 ($ million)
Data Table on South America - Market size and forecast 2024-2029 ($ million)
Chart on South America - Year-over-year growth 2024-2029 (%)
Data Table on South America - Year-over-year growth 2024-2029 (%)
Chart on Regional Comparison - South America
Data Table on Regional Comparison - South America

12.6.1 Brazil - Market size and forecast 2024-2029

Chart on Brazil - Market size and forecast 2024-2029 ($ million)
Data Table on Brazil - Market size and forecast 2024-2029 ($ million)
Chart on Brazil - Year-over-year growth 2024-2029 (%)
Data Table on Brazil - Year-over-year growth 2024-2029 (%)

12.6.2 Argentina - Market size and forecast 2024-2029

Chart on Argentina - Market size and forecast 2024-2029 ($ million)
Data Table on Argentina - Market size and forecast 2024-2029 ($ million)
Chart on Argentina - Year-over-year growth 2024-2029 (%)
Data Table on Argentina - Year-over-year growth 2024-2029 (%)

12.6.3 Colombia - Market size and forecast 2024-2029

Chart on Colombia - Market size and forecast 2024-2029 ($ million)
Data Table on Colombia - Market size and forecast 2024-2029 ($ million)
Chart on Colombia - Year-over-year growth 2024-2029 (%)
Data Table on Colombia - Year-over-year growth 2024-2029 (%)

12.7 Middle East and Africa - Market size and forecast 2024-2029

Chart on Middle East and Africa - Market size and forecast 2024-2029 ($ million)
Data Table on Middle East and Africa - Market size and forecast 2024-2029 ($ million)
Chart on Middle East and Africa - Year-over-year growth 2024-2029 (%)
Data Table on Middle East and Africa - Year-over-year growth 2024-2029 (%)
Chart on Regional Comparison - Middle East and Africa
Data Table on Regional Comparison - Middle East and Africa

12.7.1 South Africa - Market size and forecast 2024-2029

Chart on South Africa - Market size and forecast 2024-2029 ($ million)
Data Table on South Africa - Market size and forecast 2024-2029 ($ million)
Chart on South Africa - Year-over-year growth 2024-2029 (%)
Data Table on South Africa - Year-over-year growth 2024-2029 (%)

12.7.2 UAE - Market size and forecast 2024-2029

Chart on UAE - Market size and forecast 2024-2029 ($ million)
Data Table on UAE - Market size and forecast 2024-2029 ($ million)
Chart on UAE - Year-over-year growth 2024-2029 (%)
Data Table on UAE - Year-over-year growth 2024-2029 (%)

12.7.3 Saudi Arabia - Market size and forecast 2024-2029

Chart on Saudi Arabia - Market size and forecast 2024-2029 ($ million)
Data Table on Saudi Arabia - Market size and forecast 2024-2029 ($ million)
Chart on Saudi Arabia - Year-over-year growth 2024-2029 (%)
Data Table on Saudi Arabia - Year-over-year growth 2024-2029 (%)

12.7.4 Israel - Market size and forecast 2024-2029

Chart on Israel - Market size and forecast 2024-2029 ($ million)
Data Table on Israel - Market size and forecast 2024-2029 ($ million)
Chart on Israel - Year-over-year growth 2024-2029 (%)
Data Table on Israel - Year-over-year growth 2024-2029 (%)

12.7.5 Turkey - Market size and forecast 2024-2029

Chart on Turkey - Market size and forecast 2024-2029 ($ million)
Data Table on Turkey - Market size and forecast 2024-2029 ($ million)
Chart on Turkey - Year-over-year growth 2024-2029 (%)
Data Table on Turkey - Year-over-year growth 2024-2029 (%)

12.8 Market opportunity by geography

Market opportunity by geography ($ million)
Data Tables on Market opportunity by geography ($ million)

13. Drivers, Challenges, and Opportunity

13.1 Market drivers

Global decarbonization policies and net-zero commitments
Strategic imperative for energy security and independence
Technological advancements and cost reduction in electrolysis

13.2 Market challenges

High production cost and economic viability
Lack of developed infrastructure for storage and distribution
Insufficient scale of renewable energy generation

13.3 Impact of drivers and challenges

Impact of drivers and challenges in 2024 and 2029

13.4 Market opportunities

Development of large-scale hydrogen hubs and valleys
Increasing focus on hydrogen derivatives for transport and trade
Emergence of cross-border hydrogen trade agreements

14. Competitive Landscape

14.1 Overview

14.2

Overview on criticality of inputs and factors of differentiation

14.3 Landscape disruption

Overview on factors of disruption

14.4 Industry risks

Impact of key risks on business

15. Competitive Analysis

15.1 Companies profiled

Companies covered

15.2 Company ranking index

15.3 Market positioning of companies

Matrix on companies position and classification

15.4 Air Liquide SA

Air Liquide SA - Overview
Air Liquide SA - Product / Service
Air Liquide SA - Key news
Air Liquide SA - Key offerings
SWOT

15.5 Ballard Power Systems Inc.

Ballard Power Systems Inc. - Overview
Ballard Power Systems Inc. - Product / Service
Ballard Power Systems Inc. - Key offerings
SWOT

15.6 Bloom Energy Corp.

Bloom Energy Corp. - Overview
Bloom Energy Corp. - Product / Service
Bloom Energy Corp. - Key offerings
SWOT

15.7 Cummins Inc.

Cummins Inc. - Overview
Cummins Inc. - Business segments
Cummins Inc. - Key news
Cummins Inc. - Key offerings
Cummins Inc. - Segment focus
SWOT

15.8 Enel Spa

Enel Spa - Overview
Enel Spa - Product / Service
Enel Spa - Key offerings
SWOT

15.9 Exxon Mobil Corp.

Exxon Mobil Corp. - Overview
Exxon Mobil Corp. - Business segments
Exxon Mobil Corp. - Key news
Exxon Mobil Corp. - Key offerings
Exxon Mobil Corp. - Segment focus
SWOT

15.10 FuelCell Energy Inc.

FuelCell Energy Inc. - Overview
FuelCell Energy Inc. - Product / Service
FuelCell Energy Inc. - Key offerings
SWOT

15.11 Iberdrola SA

Iberdrola SA - Overview
Iberdrola SA - Business segments
Iberdrola SA - Key offerings
Iberdrola SA - Segment focus
SWOT

15.12 Linde Plc

Linde Plc - Overview
Linde Plc - Business segments
Linde Plc - Key news
Linde Plc - Key offerings
Linde Plc - Segment focus
SWOT

15.13 Nel ASA

Nel ASA - Overview
Nel ASA - Business segments
Nel ASA - Key offerings
Nel ASA - Segment focus
SWOT

15.14 Orsted AS

Orsted AS - Overview
Orsted AS - Product / Service
Orsted AS - Key offerings
SWOT

15.15 Panasonic Holdings Corp.

Panasonic Holdings Corp. - Overview
Panasonic Holdings Corp. - Business segments
Panasonic Holdings Corp. - Key news
Panasonic Holdings Corp. - Key offerings
Panasonic Holdings Corp. - Segment focus
SWOT

15.16 Plug Power Inc.

Plug Power Inc. - Overview
Plug Power Inc. - Product / Service
Plug Power Inc. - Key offerings
SWOT

15.17 Siemens Energy AG

Siemens Energy AG - Overview
Siemens Energy AG - Business segments
Siemens Energy AG - Key news
Siemens Energy AG - Key offerings
Siemens Energy AG - Segment focus
SWOT

15.18 Sinopec Shanghai Co. Ltd.

Sinopec Shanghai Co. Ltd. - Overview
Sinopec Shanghai Co. Ltd. - Business segments
Sinopec Shanghai Co. Ltd. - Key news
Sinopec Shanghai Co. Ltd. - Key offerings
Sinopec Shanghai Co. Ltd. - Segment focus
SWOT

16. Appendix

16.1 Scope of the report

Market definition
Objectives
Notes and caveats

16.2 Inclusions and exclusions checklist

Inclusions checklist
Exclusions checklist

16.3 Currency conversion rates for US$

16.4 Research methodology

16.5 Data procurement

Information sources

16.6 Data validation

16.7 Validation techniques employed for market sizing

16.8 Data synthesis

16.9 360 degree market analysis

16.10 List of abbreviations

Research Methodology

Technavio presents a detailed picture of the market by way of study, synthesis, and summation of data from multiple sources. The analysts have presented the various facets of the market with a particular focus on identifying the key industry influencers. The data thus presented is comprehensive, reliable, and the result of extensive research, both primary and secondary.

INFORMATION SOURCES

Primary sources

  • Manufacturers and suppliers
  • Channel partners
  • Industry experts
  • Strategic decision makers

Secondary sources

  • Industry journals and periodicals
  • Government data
  • Financial reports of key industry players
  • Historical data
  • Press releases

DATA ANALYSIS

Data Synthesis

  • Collation of data
  • Estimation of key figures
  • Analysis of derived insights

Data Validation

  • Triangulation with data models
  • Reference against proprietary databases
  • Corroboration with industry experts

REPORT WRITING

Qualitative

  • Market drivers
  • Market challenges
  • Market trends
  • Five forces analysis

Quantitative

  • Market size and forecast
  • Market segmentation
  • Geographical insights
  • Competitive landscape

Interested in this report?

Get your sample now to see our research methodology and insights!

Download Now

Frequently Asked Questions

Water As A Fuel market growth will increase by USD 4678.7 million during 2025-2029.

The Water As A Fuel market is expected to grow at a CAGR of 12.5% during 2025-2029.

Water As A Fuel market is segmented by Type (Hydrogen fuel, Oxyhydrogen fuel) Technology (Natural gas reforming, Electrolysis) End-user (Transportation, Power generation, Material handling equipment, Others)

Air Liquide SA, Ballard Power Systems Inc., Bloom Energy Corp., Cummins Inc., Enel Spa, ENGIE SA, Exxon Mobil Corp., FuelCell Energy Inc., Iberdrola SA, ITM Power PLC, Linde Plc, McPhy Energy SA, Nel ASA, Orsted AS, Panasonic Holdings Corp., Plug Power Inc., Siemens Energy AG, Sinopec Shanghai Co. Ltd. are a few of the key vendors in the Water As A Fuel market.

North America will register the highest growth rate of 39.3% among the other regions. Therefore, the Water As A Fuel market in North America is expected to garner significant business opportunities for the vendors during the forecast period.

US, Canada, Mexico, China, Japan, India, South Korea, Australia, Indonesia, Germany, UK, France, Italy, Spain, The Netherlands, Brazil, Argentina, Colombia, South Africa, UAE, Saudi Arabia, Israel, Turkey

  • Global decarbonization policies and net-zero commitments is the driving factor this market.

The Water As A Fuel market vendors should focus on grabbing business opportunities from the Type segment as it accounted for the largest market share in the base year.