
Well Abandonment Services Market Size 2025-2029
The well abandonment services market size is forecast to increase by USD 1.26 billion, at a CAGR of 4.9% between 2024 and 2029.
- The market is experiencing significant growth due to the maturing of oil and gas fields, which necessitates the decommissioning of older wells. Technological advances in well abandonment techniques have facilitated more efficient and cost-effective processes. However, the high costs associated with these projects remain a challenge for market growth. The adoption of innovative technologies, such as remote-operated vehicles and subsea abandonment systems, is expected to mitigate these costs and improve the overall efficiency of well abandonment projects. The market is poised for steady growth, driven by the increasing focus on environmental sustainability and regulatory compliance in the oil and gas industry.
What will be the Size of the Market During the Forecast Period?

- The energy sector is undergoing a significant transformation as international energy demand shifts towards clean and renewable sources. Renewable energy, including solar power and bioenergy, is becoming increasingly important in the global energy mix. However, the transition to clean energy sources does not negate the existence of abandoned oil and gas wells, which pose environmental and financial challenges. Abandoned oil wells, including those on offshore platforms and subsea infrastructures, present a significant liability for energy companies. These wells, which have reached the end of their productive life, require ongoing costs for maintenance, monitoring, and decommissioning. Legal obligations to ensure the safe abandonment of these wells are essential to mitigate potential environmental risks and prevent future accidents.
- The oil and gas industry's ongoing costs associated with abandoned wells are a concern, especially in the context of inflation reduction and the International Energy Agency's push for energy efficiency. The repowering of abandoned oil and gas platforms for renewable electricity generation is an emerging trend that can help mitigate these costs while reducing carbon emissions. The environment is a critical consideration in the abandonment of oil and gas wells. The potential for contamination of soil and water sources is a significant concern, and real-time monitoring and control systems are essential to prevent any adverse environmental impact. New technologies, such as bioremediation, are being explored to help mitigate the environmental impact of abandoned wells.
How is this market segmented and which is the largest segment?
The market research report provides comprehensive data (region-wise segment analysis), with forecasts and estimates in "USD billion" for the period 2025-2029, as well as historical data from 2019-2023 for the following segments.
- Application
- Offshore
- Onshore
- Type
- Permanent
- Temporary
- Geography
- Europe
- Germany
- UK
- Norway
- North America
- Canada
- US
- Middle East and Africa
- APAC
- China
- Japan
- South America
- Europe
By Application Insights
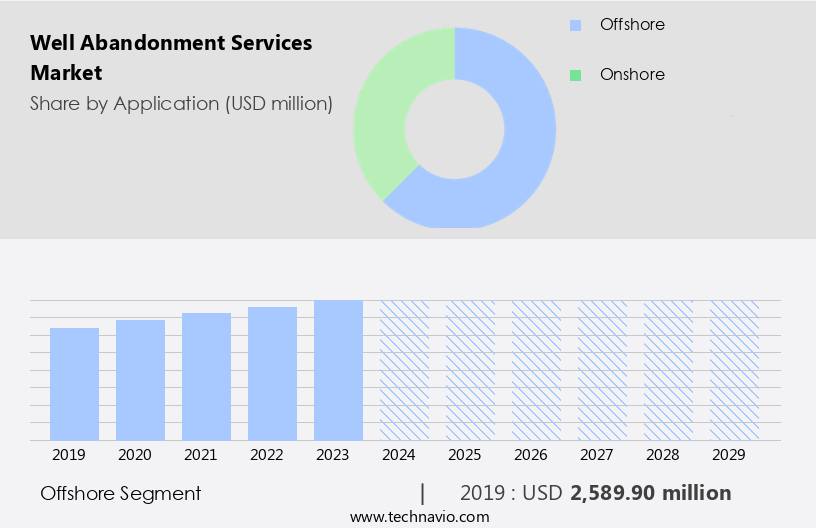
- The offshore segment is estimated to witness significant growth during the forecast period.
The market has seen substantial growth, particularly in offshore locations. This is due to the high complexities and harsh environments of offshore operations, leading to increased costs. The segment's expansion is driven by the presence of numerous matured offshore oil and gas wells in regions such as the Gulf of Mexico and the North Sea. Traditional well abandonment methods involve using drilling rigs, but advancements in technology now allow for rigless techniques. Factors influencing the requirements for offshore well abandonment include water depth, well type, and the availability of rigless methods. In 2024, offshore well abandonment accounted for the largest market share.
Get a glance at the market report of share of various segments Request Free Sample
The offshore segment was valued at USD 2.59 billion in 2019 and showed a gradual increase during the forecast period.
Regional Analysis
- Europe is estimated to contribute 56% to the growth of the global market during the forecast period.
Technavio's analysts have elaborately explained the regional trends and drivers that shape the market during the forecast period.

For more insights on the market share of various regions Request Free Sample
The European market is expected to experience significant growth due to the increasing number of maturing assets in major oil-producing regions, such as the North Sea. The UK, Norway, and Denmark are key contributors to this market, with extensive decommissioning opportunities arising from the stringent regulatory environment and the end of productive lives for many oil and gas wells in the UK Continental Shelf (UKCS). The decommissioning process involves the safe removal of infrastructure and the restoration of sites to their natural state, reducing environmental impact and aligning with the global shift towards clean energy and renewable electricity. Energy consumption from traditional sources is decreasing as international energy demand increases for cleaner alternatives. This trend is expected to continue, driving the demand for in Europe during the forecast period.
Market Dynamics
Our researchers analyzed the data with 2024 as the base year, along with the key drivers, trends, and challenges. A holistic analysis of drivers will help companies refine their marketing strategies to gain a competitive advantage.
What are the key market drivers leading to the rise in the adoption of the Well Abandonment Services Market?
Maturing oil and gas fields is the key driver of the market.
- The market is driven by the increasing international energy demand and the shift towards clean energy sources, such as renewable energy from solar power and wind power. The abandonment of orphaned and abandoned oil and gas wells, including those on offshore platforms and shale gas projects, is essential when their productivity declines and the operational costs exceed the revenue generated from selling crude oil or natural gas. This trend is accentuated by the increasing prices of fossil fuels and the growing focus on reducing greenhouse gas emissions. The ongoing costs of maintaining and monitoring these wells, including the use of deep casing tools and skilled personnel, can be substantial.
- New technologies, such as real-time monitoring and control systems, are being developed to optimize the abandonment process and minimize the environmental impact. However, restrictive regulations and low technological advancement can hinder the growth of the market. The global energy infrastructure's ongoing costs and the need for oilfield investments in new technologies and hydraulic fracturing present challenges. Transitioning to green energy sources, such as bioenergy and heat pumps, is crucial to mitigate the environmental impact and reduce the reliance on fossil fuels.
What are the market trends shaping the Well Abandonment Services Market?
Technological advances in well abandonment techniques are the upcoming trend in the market.
- The market encompasses the industry's efforts to decommission oil and gas wells, a critical aspect of the energy sector as international energy demand shifts towards cleaner, renewable sources. This transition necessitates abandoning orphaned and abandoned wells, including those on offshore oil and gas platforms and shale projects, to minimize energy consumption from fossil fuels. Three primary methods for well abandonment are the rig method, coiled tubing method, and rigless method. In the rig method, a rig with sufficient capacity is employed to extract tubing and downhole equipment. The coiled tubing method involves using a coiled tubing unit to perform abandonment tasks, while the rigless method employs wireline or slickline equipment. Offshore decommissioning is gaining prominence due to the rising costs of maintaining and operating aging platforms, stringent regulations, and the shift towards renewable electricity sources such as solar power and wind power. This trend is particularly noticeable in regions like the Gulf of Mexico (GoM) and the North Sea.
- Well abandonment is essential for reducing ongoing costs, adhering to legal obligations, and enhancing productivity in the oil and gas industry. Additionally, it plays a crucial role in minimizing the environmental impact of oil reserves and ensuring the safety of offshore oil, gas platforms, subsea infrastructures, and deepwater drilling activities. The International Energy Agency (IEA) and various governments are promoting initiatives like REPowerEU, Inflation Reduction, and the European Union's Green Deal to incentivize the transition to green energy sources and support the decommissioning of fossil fuel infrastructure. As a result, the demand is expected to grow, necessitating skilled personnel, new technologies, and real-time monitoring and control systems to optimize the global energy infrastructure.
What challenges do the Well Abandonment Services Market face during its growth?
High costs associated with well abandonment projects is a key challenge affecting the market growth.
- Well abandonment refers to the process of permanently plugging and sealing oil and gas wells that have reached the end of their productive life. This process is crucial for ensuring the safe and environmentally responsible decommissioning of energy assets. The cost of well abandonment projects is influenced by several factors, including the weight of materials needed for removal, disconnection and removal costs, market volatility, supply chain inflation, industry experience, information management systems, and technical data. As international energy demand continues to rise, the focus on clean energy sources, such as renewable electricity from solar and wind power, bioenergy, and electric cars, becomes increasingly important.
- Renewable energy sources are becoming more cost-effective and productive, leading to a shift away from fossil fuels. However, the ongoing costs of maintaining and abandoning oil and gas platforms, shale gas projects, deepwater drilling activities, and offshore oil and gas platforms remain significant. Legal obligations and liability concerns are also driving the need for well abandonment services. For instance, the European Union's REPowerEU plan aims to reduce the EU's dependence on Russian fossil fuels and accelerate the transition to renewable energy sources. The Inflation Reduction Act in the US provides incentives for carbon capture, utilization, and storage (CCUS) and other clean energy technologies.
- Despite the challenges, new technologies, such as deep casing tools, real-time monitoring, and control systems, are being developed to improve productivity and reduce costs. The global energy infrastructure is undergoing a transformation, and well-abandonment services will play a critical role in ensuring a smooth transition to a low-carbon economy. However, restrictive regulations and low technological advancement can pose challenges for oilfield investments and the implementation of new technologies. In conclusion, well abandonment is an essential aspect of the energy industry, and its cost depends on various factors, including material removal costs, disconnection and removal costs, market volatility, supply chain inflation, industry experience, information management systems, and technical data.
Exclusive Customer Landscape
The market forecasting report includes the adoption lifecycle of the market, covering from the innovator's stage to the laggard's stage. It focuses on adoption rates in different regions based on penetration. Furthermore, the market report also includes key purchase criteria and drivers of price sensitivity to help companies evaluate and develop their market growth analysis strategies.

Customer Landscape
Key Companies & Market Insights
Companies are implementing various strategies, such as strategic alliances, market forecast , partnerships, mergers and acquisitions, geographical expansion, and product/service launches, to enhance their presence in the market.
A Plus Well Service Inc. - The company offers well abandonment services such as plug and abandonment alongside products such as Double Derrick Rigs.
The market research and growth report includes detailed analyses of the competitive landscape of the market and information about key companies, including:
- A and T Well and Pump
- Acona
- Acteon Group Ltd.
- AGR Holdco Ltd.
- BiSN Oil Tools Ltd.
- Calfrac Well Services Ltd.
- Coretrax Ltd.
- Dan Wood Co.
- Expro Group Holdings NV
- Halliburton Co.
- M and W Drilling LLC
- NexTier Oilfield Solutions Inc.
- Oceaneering International Inc.
- Petrofac Ltd.
- Proserv UK Ltd.
- Schlumberger Ltd.
- TechnipFMC plc
- Weatherford International Plc
- Well Engineering Partners (WEP) BV.
Qualitative and quantitative analysis of companies has been conducted to help clients understand the wider business environment as well as the strengths and weaknesses of key market players. Data is qualitatively analyzed to categorize companies as pure play, category-focused, industry-focused, and diversified; it is quantitatively analyzed to categorize companies as dominant, leading, strong, tentative, and weak.
Research Analyst Overview
The energy sector is undergoing a significant transformation, with renewable energy sources gaining increasing prominence in the global energy mix. According to the International Energy Agency (IEA), renewable energy is expected to account for over 30% of the world's electricity generation by 2025. This shift towards cleaner energy sources is influencing various aspects of the energy industry, including the management of abandoned and orphaned wells. Abandoned wells, also known as orphaned wells, refer to oil and gas wells that have been drilled but are no longer in production. These wells pose unique challenges due to ongoing costs, legal obligations, and environmental concerns. With the focus on reducing greenhouse gas emissions and transitioning to cleaner energy sources, managing abandoned wells has become a critical issue. The global energy infrastructure is vast and complex, encompassing various types of energy sources and infrastructures.
Oil & gas platforms, subsea infrastructures, and offshore oil and gas projects are significant contributors to this infrastructure. Deepwater drilling activities and shale gas projects have added to the complexity, increasing the number of abandoned wells. The ongoing costs associated with managing abandoned wells can be substantial. These costs include maintenance, monitoring, and the eventual plugging and abandonment (P&A) process. Legal obligations, such as regulatory compliance and liability, further add to the financial burden. Productivity losses due to the decommissioning of wells can also impact the profitability of oil and gas companies. Environmental considerations are another critical factor in abandoned well management. The potential for leaks and contamination of groundwater and soil can pose significant risks to the environment and public health. The use of new technologies, such as real-time monitoring and control systems, can help mitigate these risks and improve the efficiency of the P&A process.
|
Market Scope |
|
|
Report Coverage |
Details |
|
Page number |
198 |
|
Base year |
2024 |
|
Historic period |
2019-2023 |
|
Forecast period |
2025-2029 |
|
Growth momentum & CAGR |
Accelerate at a CAGR of 4.9% |
|
Market Growth 2025-2029 |
USD 1.26 billion |
|
Market structure |
Fragmented |
|
YoY growth 2024-2025(%) |
4.7 |
|
Key countries |
US, UK, Norway, Saudi Arabia, China, Canada, Germany, Japan, Australia, and UAE |
|
Competitive landscape |
Leading Companies, Market Positioning of Companies, Competitive Strategies, and Industry Risks |
What are the Key Data Covered in this Market Research and Growth Report?
- CAGR of the market during the forecast period
- Detailed information on factors that will drive the market growth and forecasting between 2025 and 2029
- Precise estimation of the size of the market and its contribution of the market in focus to the parent market
- Accurate predictions about upcoming market growth and trends and changes in consumer behaviour
- Growth of the market across Europe, North America, Middle East and Africa, APAC, and South America
- Thorough analysis of the market's competitive landscape and detailed information about companies
- Comprehensive analysis of factors that will challenge the growth of market companies
We can help! Our analysts can customize this market research report to meet your requirements.
 RIA -
RIA - 
