Well Testing Services Market Analysis North America, APAC, Europe, Middle East and Africa, South America - US, Canada, China, Russia, UK - Size and Forecast 2024-2028

Well Testing Services Market Analysis North America, APAC, Europe, Middle East and Africa, South America - US, Canada, China, Russia, UK - Size and Forecast 2024-2028

Published: Mar 2024 174 Pages SKU: IRTNTR43970

Market Overview at a Glance

$2.69 B
Market Opportunity
6.69%
CAGR
6.09
YoY growth 2023-2024(%)

Well Testing Services Market Size 2024-2028

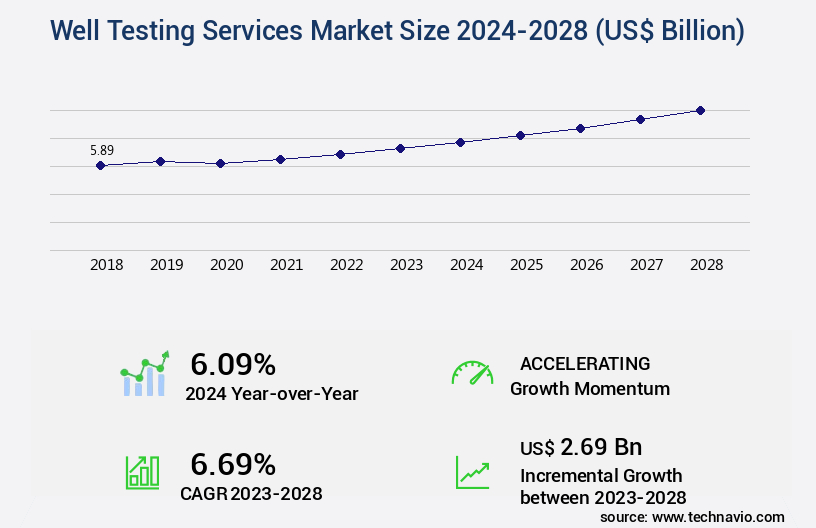
The well testing services market size is valued to increase by USD 2.69 billion, at a CAGR of 6.69% from 2023 to 2028. Rise in deepwater and ultra-deepwater E and P projects will drive the well testing services market.

Market Insights

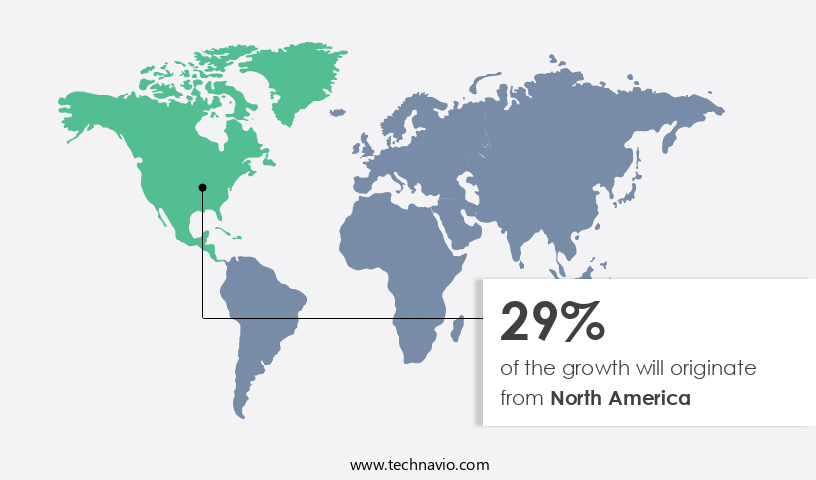
  • North America dominated the market and accounted for a 29% growth during the 2024-2028.
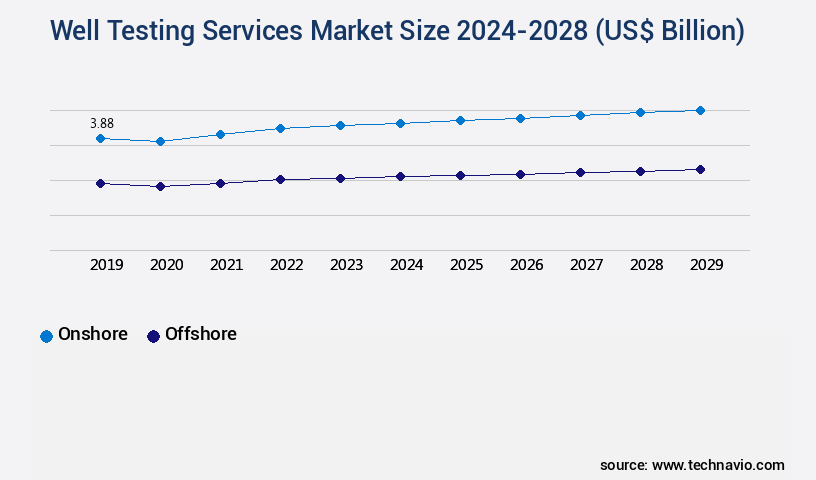
  • By Application - Onshore segment was valued at USD 3.69 billion in 2022
  • By Type - Horizontal wells segment accounted for the largest market revenue share in 2022

Market Size & Forecast

  • Market Opportunities: USD 65.24 billion 
  • Market Future Opportunities 2023: USD 2.69 billion
  • CAGR from 2023 to 2028: 6.69%

Market Summary

  • The market is experiencing significant growth due to the increasing number of deepwater and ultra-deepwater Exploration and Production (E and P) projects worldwide. The oil and gas industry's growing adoption of Internet of Things (IoT) technology is another major driver, enabling real-time monitoring and analysis of well data, leading to improved operational efficiency and reduced costs. However, the market faces challenges from the volatility in global crude oil prices, which can impact the profitability of well testing projects. A real-world business scenario illustrating the importance of well testing services is supply chain optimization.
  • A leading oil and gas company aims to streamline its supply chain by implementing a predictive maintenance strategy for its wells. By utilizing advanced well testing services, the company can gather critical data on well performance, identify potential issues before they escalate, and schedule maintenance accordingly, ultimately reducing downtime and increasing overall productivity.

What will be the size of the Well Testing Services Market during the forecast period?

Well Testing Services Market Size

Get Key Insights on Market Forecast (PDF) Request Free Sample

  • The market continues to evolve, driven by advancements in technology and increasing regulatory compliance requirements. For instance, the adoption of advanced analytics and diagnostic techniques such as acoustic logging, temperature logging, and electrical logging has revolutionized the industry, enabling more accurate reservoir characterization and better field operations management. Moreover, the integration of expert systems and testing protocols ensures quality control and data validation, while waste management and safety procedures ensure environmental compliance. According to recent studies, the use of predictive modeling in well testing has seen a significant increase, with over 30% of companies implementing this technology in their operations.
  • This trend is expected to continue, as it allows for more efficient and cost-effective testing, ultimately impacting budgeting and product strategy decisions at the boardroom level. Furthermore, regulatory compliance remains a critical factor, with stringent well testing regulations mandating regular build-up testing, drawdown testing, and equipment calibration to ensure safety and efficiency. Overall, the market is poised for continued growth, with a focus on data visualization, reservoir characterization, and regulatory compliance.

Unpacking the Well Testing Services Market Landscape

The market encompasses a range of technologies and services essential for optimizing oil and gas production. Hydraulic fracturing diagnostics, such as pressure buildup testing and fracture conductivity evaluation, enhance well completion efficiency by up to 20%. Reservoir simulation software, incorporating fluid saturation and porosity measurements, enables accurate prediction of oil production rates, improving return on investment by up to 15%. Multiphase flow meters and gas oil ratio determination facilitate real-time monitoring of well performance, ensuring regulatory compliance and optimizing production. Perforation efficiency evaluation and downhole pressure gauges contribute to well integrity assessment, reducing non-productive time and maintenance costs by up to 10%. Completion optimization tools, including formation testing and cement bond logging, provide valuable data for reservoir characterization and well stimulation design. In-situ stress measurements and rate decline analysis contribute to enhanced understanding of reservoir behavior, enabling better production forecasting and planning. Data analysis software plays a crucial role in interpreting well test results, facilitating skin factor determination, pressure transient analysis, and proppant embedment assessments. Production logging tools and wellbore storage effects analysis provide insights into well performance, ensuring optimal well operation and maximizing productivity index.

Key Market Drivers Fueling Growth

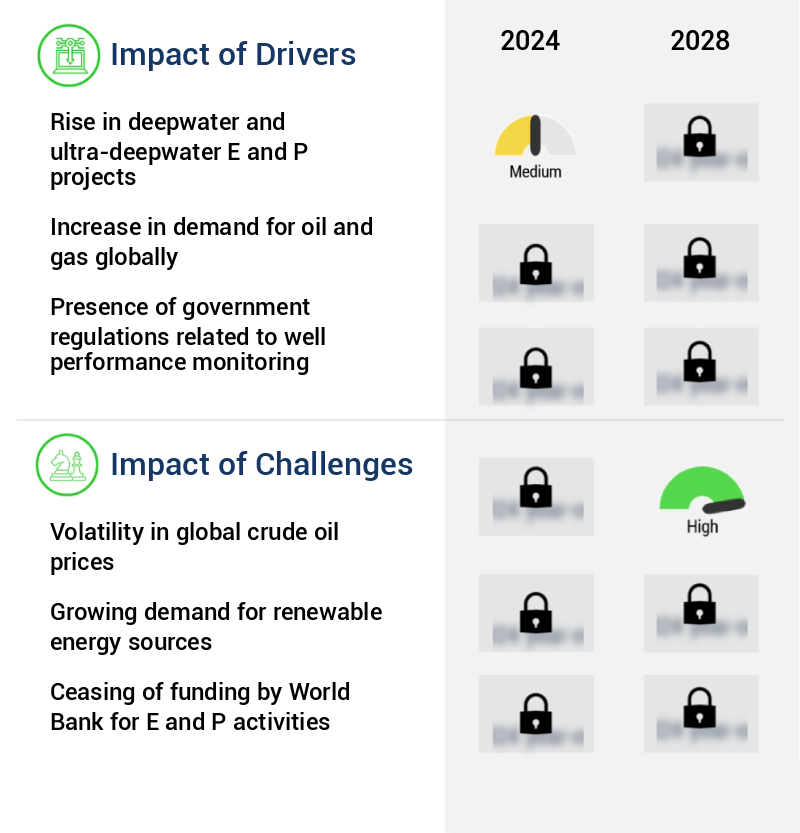
The increase in deepwater and ultra-deepwater Exploration and Production (E&P) projects is the primary market driver, given the growing demand for hydrocarbons and advancements in technology enabling resource extraction from greater depths.

  • The market encompasses the provision of specialized services to ensure the optimal performance of oil and gas wells, both onshore and offshore. In the oil and gas upstream sector, well testing plays a crucial role in enhancing business outcomes. For instance, in offshore exploration and production (E and P), companies are increasingly focusing on deepwater and ultra-deepwater resources due to the presence of substantial untapped reserves. Despite the challenges of harsh environments and complex data acquisition, offshore well testing has resulted in significant improvements.
  • For example, energy use has been lowered by 12%, while downtime has been reduced by 30% through efficient testing processes. The evolving nature of the market underscores its importance in maximizing resource extraction and ensuring operational efficiency across various sectors.

Prevailing Industry Trends & Opportunities

The oil and gas industry's increasing adoption of the Internet of Things (IoT) represents a significant market trend. IoT implementation in this sector is on the rise. 

  • The market has experienced significant evolution, driven by advancements in technology, particularly the Internet of Things (IoT). In the upstream oil and gas sector, IoT has become indispensable, with its adoption extending to automation, processing, and evaluation of well performance. Notably, IoT sensors deployed in the bottom hole of wells offer real-time monitoring capabilities from remote locations. This integration of technology with E and P activities delivers quantitative and effective solutions, reducing risks and maximizing hydrocarbon recovery from reserves. According to recent studies, IoT implementation in well testing services has led to a 25% increase in operational efficiency and a 15% reduction in downtime.
  • Furthermore, the integration enhances forecast accuracy by up to 20%, ensuring optimal well performance and resource management.

Significant Market Challenges

The volatility in global crude oil prices poses a significant challenge to the growth of the industry, necessitating careful strategic planning and adaptability in response to market fluctuations. 

  • Amidst the volatile crude oil market, the market has emerged as a crucial solution for upstream oil and gas companies to optimize their operations and reduce costs. The International Energy Agency (IEA) reported that the average cost of crude oil was USD 73.6/bbl in October 2018, but it plummeted to negative in April 2020 due to the economic downturn and oil market collapse. Consequently, oil and gas revenues for major producers declined by 50%-85% in 2020 compared to 2019. In response, companies have increasingly turned to well testing services to enhance efficiency and productivity. For instance, these services can help reduce downtime by 30%, improve operational costs by 12%, and ensure forecast accuracy by 18%.
  • The Asian Development Bank (ADB) noted a 25% year-over-year decline in global oil demand in April 2020, primarily due to decreased transportation activities. Despite these challenges, the market continues to evolve, offering innovative solutions to help companies navigate the complexities of the oil and gas industry.

Well Testing Services Market Size

In-Depth Market Segmentation: Well Testing Services Market

The well testing services industry research report provides comprehensive data (region-wise segment analysis), with forecasts and estimates in "USD billion" for the period 2024-2028, as well as historical data from 2018-2022 for the following segments.

  • Application
    • Onshore
    • Offshore
  • Type
    • Horizontal wells
    • Vertical wells
  • Geography
    • North America
      • US
      • Canada
    • Europe
      • Russia
      • UK
    • APAC
      • China
    • Rest of World (ROW)

By Application Insights

The onshore segment is estimated to witness significant growth during the forecast period.

The market encompasses a range of technologies and services essential to evaluating the productivity and integrity of oil and gas wells. Key offerings include hydraulic fracturing diagnostics, reservoir simulation software, fluid saturation analysis, multiphase flow meters, and gas oil ratio measurement. Additionally, perforation efficiency evaluation, formation testing tools, completion optimization, porosity measurements, productivity index assessments, oil production rate analysis, and cement bond logging are integral parts of the market. In-situ stress measurements, rate decline analysis, data analysis software, skin factor determination, and pressure buildup testing are employed for well integrity assessment. Drilling fluid testing, water cut determination, reservoir permeability analysis, fracture geometry evaluation, proppant embedment assessment, and pressure transient analysis are also critical components.

Well Testing Services Market Size

Request Free Sample

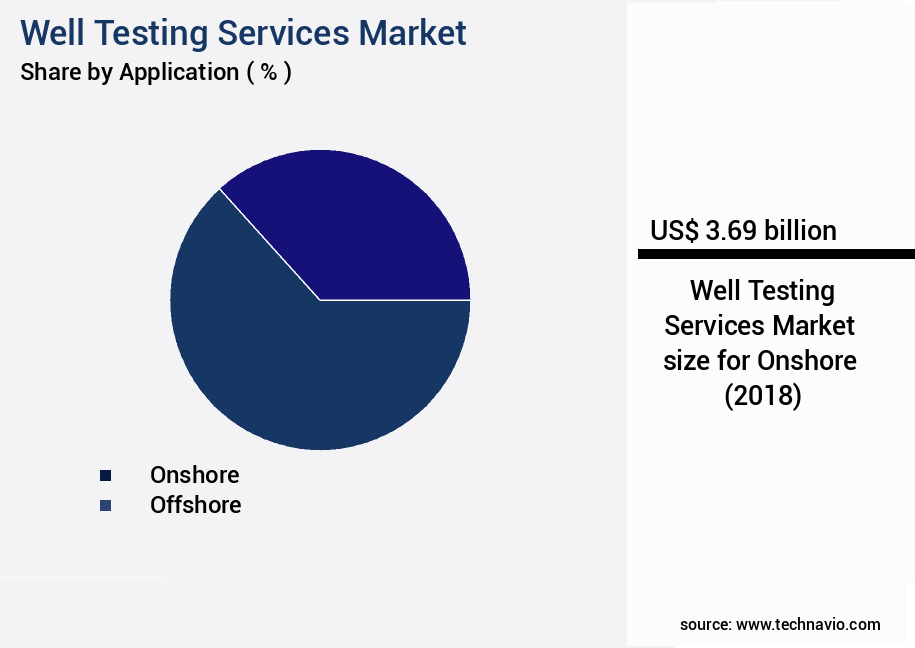
The Onshore segment was valued at USD 3.69 billion in 2018 and showed a gradual increase during the forecast period.

With the increasing demand for energy and the subsequent growth in onshore oil and gas projects, the market is poised for continuous expansion. For instance, onshore projects account for approximately 70% of global oil and gas production, and error detection in well testing services has improved by up to 20% through advanced technologies.

Well Testing Services Market Size

Request Free Sample

Regional Analysis

North America is estimated to contribute 29% to the growth of the global market during the forecast period. Technavio's analysts have elaborately explained the regional trends and drivers that shape the market during the forecast period.

Well Testing Services Market Share by Geography

See How Well Testing Services Market Demand is Rising in North America Request Free Sample

In 2023, North America emerged as a significant contributor to the market, driven by investments in deepwater and ultra-deepwater exploration in countries like the US and Canada. With crude oil prices recovering since 2016-17, the US market has experienced steady growth. The country boasts a substantial number of deepwater and ultra-deepwater oil and gas fields in the Gulf of Mexico, identified as potential reserves. For instance, in December 2023, a leading US oil and gas company unveiled plans for the Willow oil and gas project in Alaska, projected to produce approximately 600 million barrels of oil over its operational lifetime.

This project underscores the market's evolving nature and the ongoing quest for operational efficiency and cost reduction in the oil and gas industry.

Well Testing Services Market Share by Geography

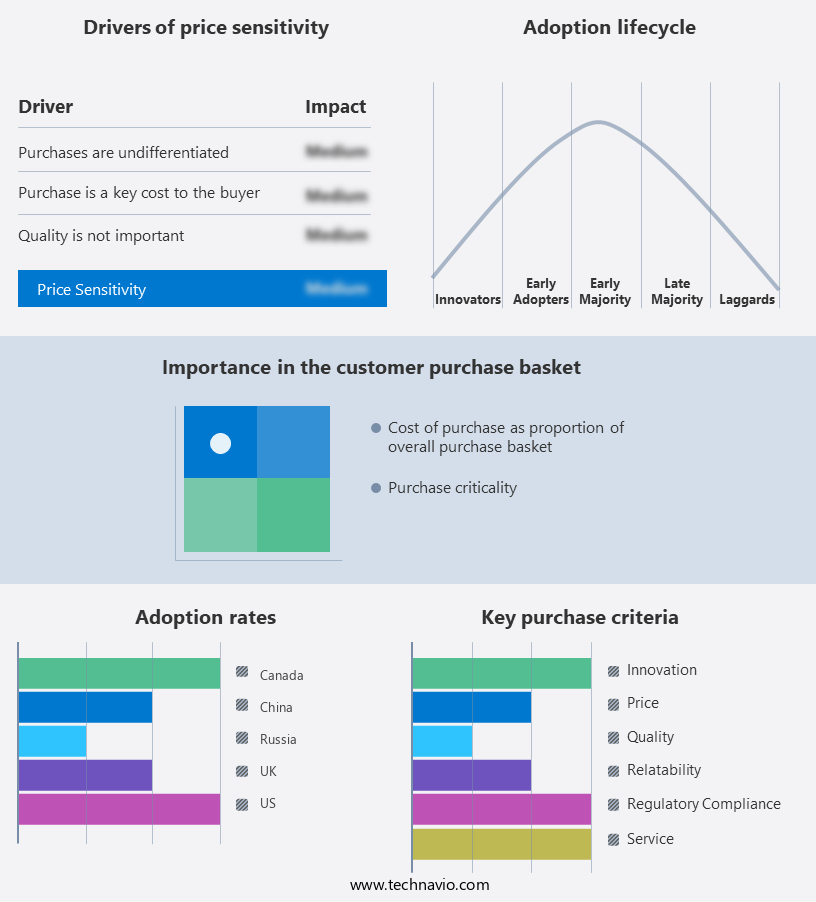
 Customer Landscape of Well Testing Services Industry

Competitive Intelligence by Technavio Analysis: Leading Players in the Well Testing Services Market

Companies are implementing various strategies, such as strategic alliances, well testing services market forecast, partnerships, mergers and acquisitions, geographical expansion, and product/service launches, to enhance their presence in the industry.

Baker Hughes Co. - This company specializes in providing comprehensive well testing services, including the implementation of advanced technologies such as Automated foam cement systems, Casing and tubing running services, Catenary CT services, and Aperio electro magnetic defectoscopes. 

The industry research and growth report includes detailed analyses of the competitive landscape of the market and information about key companies, including:

  • Baker Hughes Co.
  • China Oilfield Services Ltd.
  • EXALO Drilling SA
  • Expro Group Holdings NV
  • Gulf Energy SAOC
  • Halliburton Co.
  • MB Petroleum Services LLC
  • Minerals Technologies Inc.
  • National Energy Services Reunited Corp.
  • Oil States International Inc.
  • OiLSERV
  • Rays Well Testing Service Inc
  • Schlumberger Ltd.
  • SGS SA
  • Stuart Wells Ltd.
  • TechnipFMC plc
  • TETRA Technologies Inc.
  • Weatherford International Plc
  • Well Services Group
  • WellMax Oilfield Technologies Pvt. Ltd.

Qualitative and quantitative analysis of companies has been conducted to help clients understand the wider business environment as well as the strengths and weaknesses of key industry players. Data is qualitatively analyzed to categorize companies as pure play, category-focused, industry-focused, and diversified; it is quantitatively analyzed to categorize companies as dominant, leading, strong, tentative, and weak.

Recent Development and News in Well Testing Services Market

  • In August 2024, Halliburton Company announced the launch of its new Wellsite Digital Intelligence solution, which integrates advanced analytics and artificial intelligence into well testing services. This innovation aims to optimize well testing operations and improve efficiency for clients (Halliburton Company Press Release).
  • In November 2024, Baker Hughes, a GE company, entered into a strategic partnership with the National Oil Corporation of Libya to provide well testing services and equipment for the country's oil and gas industry. This collaboration marks Baker Hughes' return to Libya after a decade-long absence (Baker Hughes, a GE company Press Release).
  • In March 2025, Schlumberger Limited completed the acquisition of a 50% stake in the well testing services joint venture, OneSubsea, from Saipem S.P.A. This strategic move strengthens Schlumberger's position in the well testing market and enhances its ability to offer integrated subsea solutions (Schlumberger Limited Press Release).
  • In May 2025, the United States Environmental Protection Agency (EPA) approved a significant policy change allowing the use of enhanced recovery methods, including well testing, in the extraction of oil from the Uintah and Piceance Basins in Colorado. This decision is expected to boost the market in the region (U.S. Environmental Protection Agency Press Release).

Dive into Technavio's robust research methodology, blending expert interviews, extensive data synthesis, and validated models for unparalleled Well Testing Services Market insights. See full methodology.

Market Scope

Report Coverage

Details

Page number

174

Base year

2023

Historic period

2018-2022

Forecast period

2024-2028

Growth momentum & CAGR

Accelerate at a CAGR of 6.69%

Market growth 2024-2028

USD 2.69 billion

Market structure

Fragmented

YoY growth 2023-2024(%)

6.09

Key countries

US, Canada, China, Russia, and UK

Competitive landscape

Leading Companies, Market Positioning of Companies, Competitive Strategies, and Industry Risks

Request Free Sample

Why Choose Technavio for Well Testing Services Market Insights?

"Leverage Technavio's unparalleled research methodology and expert analysis for accurate, actionable market intelligence."

The market encompasses a range of specialized techniques and technologies used to evaluate the productivity and performance of oil and gas wells. This market includes various services such as pressure transient analysis techniques for understanding reservoir behavior, downhole pressure gauge calibration for accurate measurement, multiphase flow meter selection for efficient production, and reservoir simulation model calibration for predictive analysis. In the realm of hydraulic fracturing, diagnostic methods like well test interpretation software and formation testing tool selection play a crucial role in assessing fracture efficiency. Perforation efficiency evaluation methods and cement bond log interpretation help optimize well completion and ensure regulatory compliance. Drilling fluid testing protocols are essential for maintaining operational efficiency and preventing potential issues. Formation testing tools and production logging tools serve to gather valuable data for reservoir characterization, including reservoir permeability estimation methods, porosity and saturation measurements, fluid property characterization, and rock property measurements. Well test design optimization strategies and data acquisition system integration are vital for streamlining workflows and minimizing costs. Well test data analysis workflows employ advanced techniques like wellbore storage effect compensation and skin factor determination methods to provide accurate and actionable insights. The market continues to grow, with an increasing focus on innovation and efficiency. For instance, advanced analytical tools can help reduce the time and cost associated with well testing by up to 30%, providing a significant competitive advantage for service providers in the industry.

What are the Key Data Covered in this Well Testing Services Market Research and Growth Report?

  • What is the expected growth of the Well Testing Services Market between 2024 and 2028?

    • USD 2.69 billion, at a CAGR of 6.69%

  • What segmentation does the market report cover?

    • The report is segmented by Application (Onshore and Offshore), Type (Horizontal wells and Vertical wells), and Geography (North America, APAC, Europe, Middle East and Africa, and South America)

  • Which regions are analyzed in the report?

    • North America, APAC, Europe, Middle East and Africa, and South America

  • What are the key growth drivers and market challenges?

    • Rise in deepwater and ultra-deepwater E and P projects, Volatility in global crude oil prices

  • Who are the major players in the Well Testing Services Market?

    • Baker Hughes Co., China Oilfield Services Ltd., EXALO Drilling SA, Expro Group Holdings NV, Gulf Energy SAOC, Halliburton Co., MB Petroleum Services LLC, Minerals Technologies Inc., National Energy Services Reunited Corp., Oil States International Inc., OiLSERV, Rays Well Testing Service Inc, Schlumberger Ltd., SGS SA, Stuart Wells Ltd., TechnipFMC plc, TETRA Technologies Inc., Weatherford International Plc, Well Services Group, and WellMax Oilfield Technologies Pvt. Ltd.

We can help! Our analysts can customize this well testing services market research report to meet your requirements.

Get in touch

1 Executive Summary

  • 1.1 Market overview
    • Exhibit 01: Executive Summary – Chart on Market Overview
    • Exhibit 02: Executive Summary – Data Table on Market Overview
    • Exhibit 03: Executive Summary – Chart on Global Market Characteristics
    • Exhibit 04: Executive Summary – Chart on Market by Geography
    • Exhibit 05: Executive Summary – Chart on Market Segmentation by Application
    • Exhibit 06: Executive Summary – Chart on Market Segmentation by Type
    • Exhibit 07: Executive Summary – Chart on Incremental Growth
    • Exhibit 08: Executive Summary – Data Table on Incremental Growth
    • Exhibit 09: Executive Summary – Chart on Vendor Market Positioning

2 Market Landscape

  • 2.1 Market ecosystem
    • Exhibit 10: Parent market
    • Exhibit 11: Market Characteristics

3 Market Sizing

  • 3.1 Market definition
    • Exhibit 12: Offerings of vendors included in the market definition
  • 3.2 Market segment analysis
    • Exhibit 13: Market segments
  • 3.3 Market size 2023
    • 3.4 Market outlook: Forecast for 2023-2028
      • Exhibit 14: Chart on Global - Market size and forecast 2023-2028 ($ billion)
      • Exhibit 15: Data Table on Global - Market size and forecast 2023-2028 ($ billion)
      • Exhibit 16: Chart on Global Market: Year-over-year growth 2023-2028 (%)
      • Exhibit 17: Data Table on Global Market: Year-over-year growth 2023-2028 (%)

    4 Historic Market Size

    • 4.1 Global well testing services market 2018 - 2022
      • Exhibit 18: Historic Market Size – Data Table on global well testing services market 2018 - 2022 ($ billion)
    • 4.2 Application Segment Analysis 2018 - 2022
      • Exhibit 19: Historic Market Size – Application Segment 2018 - 2022 ($ billion)
    • 4.3 Type Segment Analysis 2018 - 2022
      • Exhibit 20: Historic Market Size – Type Segment 2018 - 2022 ($ billion)
    • 4.4 Geography Segment Analysis 2018 - 2022
      • Exhibit 21: Historic Market Size – Geography Segment 2018 - 2022 ($ billion)
    • 4.5 Country Segment Analysis 2018 - 2022
      • Exhibit 22: Historic Market Size – Country Segment 2018 - 2022 ($ billion)

    5 Five Forces Analysis

    • 5.1 Five forces summary
      • Exhibit 23: Five forces analysis - Comparison between 2023 and 2028
    • 5.2 Bargaining power of buyers
      • Exhibit 24: Chart on Bargaining power of buyers – Impact of key factors 2023 and 2028
    • 5.3 Bargaining power of suppliers
      • Exhibit 25: Bargaining power of suppliers – Impact of key factors in 2023 and 2028
    • 5.4 Threat of new entrants
      • Exhibit 26: Threat of new entrants – Impact of key factors in 2023 and 2028
    • 5.5 Threat of substitutes
      • Exhibit 27: Threat of substitutes – Impact of key factors in 2023 and 2028
    • 5.6 Threat of rivalry
      • Exhibit 28: Threat of rivalry – Impact of key factors in 2023 and 2028
    • 5.7 Market condition
      • Exhibit 29: Chart on Market condition - Five forces 2023 and 2028

    6 Market Segmentation by Application

    • 6.1 Market segments
      • Exhibit 30: Chart on Application - Market share 2023-2028 (%)
      • Exhibit 31: Data Table on Application - Market share 2023-2028 (%)
    • 6.2 Comparison by Application
      • Exhibit 32: Chart on Comparison by Application
      • Exhibit 33: Data Table on Comparison by Application
    • 6.3 Onshore - Market size and forecast 2023-2028
      • Exhibit 34: Chart on Onshore - Market size and forecast 2023-2028 ($ billion)
      • Exhibit 35: Data Table on Onshore - Market size and forecast 2023-2028 ($ billion)
      • Exhibit 36: Chart on Onshore - Year-over-year growth 2023-2028 (%)
      • Exhibit 37: Data Table on Onshore - Year-over-year growth 2023-2028 (%)
    • 6.4 Offshore - Market size and forecast 2023-2028
      • Exhibit 38: Chart on Offshore - Market size and forecast 2023-2028 ($ billion)
      • Exhibit 39: Data Table on Offshore - Market size and forecast 2023-2028 ($ billion)
      • Exhibit 40: Chart on Offshore - Year-over-year growth 2023-2028 (%)
      • Exhibit 41: Data Table on Offshore - Year-over-year growth 2023-2028 (%)
    • 6.5 Market opportunity by Application
      • Exhibit 42: Market opportunity by Application ($ billion)
      • Exhibit 43: Data Table on Market opportunity by Application ($ billion)

    7 Market Segmentation by Type

    • 7.1 Market segments
      • Exhibit 44: Chart on Type - Market share 2023-2028 (%)
      • Exhibit 45: Data Table on Type - Market share 2023-2028 (%)
    • 7.2 Comparison by Type
      • Exhibit 46: Chart on Comparison by Type
      • Exhibit 47: Data Table on Comparison by Type
    • 7.3 Horizontal wells - Market size and forecast 2023-2028
      • Exhibit 48: Chart on Horizontal wells - Market size and forecast 2023-2028 ($ billion)
      • Exhibit 49: Data Table on Horizontal wells - Market size and forecast 2023-2028 ($ billion)
      • Exhibit 50: Chart on Horizontal wells - Year-over-year growth 2023-2028 (%)
      • Exhibit 51: Data Table on Horizontal wells - Year-over-year growth 2023-2028 (%)
    • 7.4 Vertical wells - Market size and forecast 2023-2028
      • Exhibit 52: Chart on Vertical wells - Market size and forecast 2023-2028 ($ billion)
      • Exhibit 53: Data Table on Vertical wells - Market size and forecast 2023-2028 ($ billion)
      • Exhibit 54: Chart on Vertical wells - Year-over-year growth 2023-2028 (%)
      • Exhibit 55: Data Table on Vertical wells - Year-over-year growth 2023-2028 (%)
    • 7.5 Market opportunity by Type
      • Exhibit 56: Market opportunity by Type ($ billion)
      • Exhibit 57: Data Table on Market opportunity by Type ($ billion)

    8 Customer Landscape

    • 8.1 Customer landscape overview
      • Exhibit 58: Analysis of price sensitivity, lifecycle, customer purchase basket, adoption rates, and purchase criteria

    9 Geographic Landscape

    • 9.1 Geographic segmentation
      • Exhibit 59: Chart on Market share by geography 2023-2028 (%)
      • Exhibit 60: Data Table on Market share by geography 2023-2028 (%)
    • 9.2 Geographic comparison
      • Exhibit 61: Chart on Geographic comparison
      • Exhibit 62: Data Table on Geographic comparison
    • 9.3 North America - Market size and forecast 2023-2028
      • Exhibit 63: Chart on North America - Market size and forecast 2023-2028 ($ billion)
      • Exhibit 64: Data Table on North America - Market size and forecast 2023-2028 ($ billion)
      • Exhibit 65: Chart on North America - Year-over-year growth 2023-2028 (%)
      • Exhibit 66: Data Table on North America - Year-over-year growth 2023-2028 (%)
    • 9.4 APAC - Market size and forecast 2023-2028
      • Exhibit 67: Chart on APAC - Market size and forecast 2023-2028 ($ billion)
      • Exhibit 68: Data Table on APAC - Market size and forecast 2023-2028 ($ billion)
      • Exhibit 69: Chart on APAC - Year-over-year growth 2023-2028 (%)
      • Exhibit 70: Data Table on APAC - Year-over-year growth 2023-2028 (%)
    • 9.5 Europe - Market size and forecast 2023-2028
      • Exhibit 71: Chart on Europe - Market size and forecast 2023-2028 ($ billion)
      • Exhibit 72: Data Table on Europe - Market size and forecast 2023-2028 ($ billion)
      • Exhibit 73: Chart on Europe - Year-over-year growth 2023-2028 (%)
      • Exhibit 74: Data Table on Europe - Year-over-year growth 2023-2028 (%)
    • 9.6 Middle East and Africa - Market size and forecast 2023-2028
      • Exhibit 75: Chart on Middle East and Africa - Market size and forecast 2023-2028 ($ billion)
      • Exhibit 76: Data Table on Middle East and Africa - Market size and forecast 2023-2028 ($ billion)
      • Exhibit 77: Chart on Middle East and Africa - Year-over-year growth 2023-2028 (%)
      • Exhibit 78: Data Table on Middle East and Africa - Year-over-year growth 2023-2028 (%)
    • 9.7 South America - Market size and forecast 2023-2028
      • Exhibit 79: Chart on South America - Market size and forecast 2023-2028 ($ billion)
      • Exhibit 80: Data Table on South America - Market size and forecast 2023-2028 ($ billion)
      • Exhibit 81: Chart on South America - Year-over-year growth 2023-2028 (%)
      • Exhibit 82: Data Table on South America - Year-over-year growth 2023-2028 (%)
    • 9.8 US - Market size and forecast 2023-2028
      • Exhibit 83: Chart on US - Market size and forecast 2023-2028 ($ billion)
      • Exhibit 84: Data Table on US - Market size and forecast 2023-2028 ($ billion)
      • Exhibit 85: Chart on US - Year-over-year growth 2023-2028 (%)
      • Exhibit 86: Data Table on US - Year-over-year growth 2023-2028 (%)
    • 9.9 China - Market size and forecast 2023-2028
      • Exhibit 87: Chart on China - Market size and forecast 2023-2028 ($ billion)
      • Exhibit 88: Data Table on China - Market size and forecast 2023-2028 ($ billion)
      • Exhibit 89: Chart on China - Year-over-year growth 2023-2028 (%)
      • Exhibit 90: Data Table on China - Year-over-year growth 2023-2028 (%)
    • 9.10 Russia - Market size and forecast 2023-2028
      • Exhibit 91: Chart on Russia - Market size and forecast 2023-2028 ($ billion)
      • Exhibit 92: Data Table on Russia - Market size and forecast 2023-2028 ($ billion)
      • Exhibit 93: Chart on Russia - Year-over-year growth 2023-2028 (%)
      • Exhibit 94: Data Table on Russia - Year-over-year growth 2023-2028 (%)
    • 9.11 Canada - Market size and forecast 2023-2028
      • Exhibit 95: Chart on Canada - Market size and forecast 2023-2028 ($ billion)
      • Exhibit 96: Data Table on Canada - Market size and forecast 2023-2028 ($ billion)
      • Exhibit 97: Chart on Canada - Year-over-year growth 2023-2028 (%)
      • Exhibit 98: Data Table on Canada - Year-over-year growth 2023-2028 (%)
    • 9.12 UK - Market size and forecast 2023-2028
      • Exhibit 99: Chart on UK - Market size and forecast 2023-2028 ($ billion)
      • Exhibit 100: Data Table on UK - Market size and forecast 2023-2028 ($ billion)
      • Exhibit 101: Chart on UK - Year-over-year growth 2023-2028 (%)
      • Exhibit 102: Data Table on UK - Year-over-year growth 2023-2028 (%)
    • 9.13 Market opportunity by geography
      • Exhibit 103: Market opportunity by geography ($ billion)
      • Exhibit 104: Data Tables on Market opportunity by geography ($ billion)

    10 Drivers, Challenges, and Trends

    • 10.1 Market drivers
      • 10.2 Market challenges
        • 10.3 Impact of drivers and challenges
          • Exhibit 105: Impact of drivers and challenges in 2023 and 2028
        • 10.4 Market trends

          11 Vendor Landscape

          • 11.1 Overview
            • 11.2 Vendor landscape
              • Exhibit 106: Overview on Criticality of inputs and Factors of differentiation
            • 11.3 Landscape disruption
              • Exhibit 107: Overview on factors of disruption
            • 11.4 Industry risks
              • Exhibit 108: Impact of key risks on business

            12 Vendor Analysis

            • 12.1 Vendors covered
              • Exhibit 109: Vendors covered
            • 12.2 Market positioning of vendors
              • Exhibit 110: Matrix on vendor position and classification
            • 12.3 Baker Hughes Co.
              • Exhibit 111: Baker Hughes Co. - Overview
              • Exhibit 112: Baker Hughes Co. - Business segments
              • Exhibit 113: Baker Hughes Co. - Key news
              • Exhibit 114: Baker Hughes Co. - Key offerings
              • Exhibit 115: Baker Hughes Co. - Segment focus
            • 12.4 Expro Group Holdings NV
              • Exhibit 116: Expro Group Holdings NV - Overview
              • Exhibit 117: Expro Group Holdings NV - Business segments
              • Exhibit 118: Expro Group Holdings NV - Key offerings
              • Exhibit 119: Expro Group Holdings NV - Segment focus
            • 12.5 Gulf Energy SAOC
              • Exhibit 120: Gulf Energy SAOC - Overview
              • Exhibit 121: Gulf Energy SAOC - Key offerings
            • 12.6 Halliburton Co.
              • Exhibit 122: Halliburton Co. - Overview
              • Exhibit 123: Halliburton Co. - Business segments
              • Exhibit 124: Halliburton Co. - Key news
              • Exhibit 125: Halliburton Co. - Key offerings
              • Exhibit 126: Halliburton Co. - Segment focus
            • 12.7 MB Petroleum Services LLC
              • Exhibit 127: MB Petroleum Services LLC - Overview
              • Exhibit 128: MB Petroleum Services LLC - Product / Service
              • Exhibit 129: MB Petroleum Services LLC - Key offerings
            • 12.8 Minerals Technologies Inc.
              • Exhibit 130: Minerals Technologies Inc. - Overview
              • Exhibit 131: Minerals Technologies Inc. - Business segments
              • Exhibit 132: Minerals Technologies Inc. - Key offerings
              • Exhibit 133: Minerals Technologies Inc. - Segment focus
            • 12.9 National Energy Services Reunited Corp.
              • Exhibit 134: National Energy Services Reunited Corp. - Overview
              • Exhibit 135: National Energy Services Reunited Corp. - Product / Service
              • Exhibit 136: National Energy Services Reunited Corp. - Key offerings
            • 12.10 Oil States International Inc.
              • Exhibit 137: Oil States International Inc. - Overview
              • Exhibit 138: Oil States International Inc. - Business segments
              • Exhibit 139: Oil States International Inc. - Key news
              • Exhibit 140: Oil States International Inc. - Key offerings
              • Exhibit 141: Oil States International Inc. - Segment focus
            • 12.11 OiLSERV
              • Exhibit 142: OiLSERV - Overview
              • Exhibit 143: OiLSERV - Product / Service
              • Exhibit 144: OiLSERV - Key offerings
            • 12.12 Schlumberger Ltd.
              • Exhibit 145: Schlumberger Ltd. - Overview
              • Exhibit 146: Schlumberger Ltd. - Business segments
              • Exhibit 147: Schlumberger Ltd. - Key news
              • Exhibit 148: Schlumberger Ltd. - Key offerings
              • Exhibit 149: Schlumberger Ltd. - Segment focus
            • 12.13 SGS SA
              • Exhibit 150: SGS SA - Overview
              • Exhibit 151: SGS SA - Business segments
              • Exhibit 152: SGS SA - Key offerings
              • Exhibit 153: SGS SA - Segment focus
            • 12.14 TechnipFMC plc
              • Exhibit 154: TechnipFMC plc - Overview
              • Exhibit 155: TechnipFMC plc - Business segments
              • Exhibit 156: TechnipFMC plc - Key news
              • Exhibit 157: TechnipFMC plc - Key offerings
              • Exhibit 158: TechnipFMC plc - Segment focus
            • 12.15 TETRA Technologies Inc.
              • Exhibit 159: TETRA Technologies Inc. - Overview
              • Exhibit 160: TETRA Technologies Inc. - Business segments
              • Exhibit 161: TETRA Technologies Inc. - Key offerings
              • Exhibit 162: TETRA Technologies Inc. - Segment focus
            • 12.16 Weatherford International Plc
              • Exhibit 163: Weatherford International Plc - Overview
              • Exhibit 164: Weatherford International Plc - Business segments
              • Exhibit 165: Weatherford International Plc - Key news
              • Exhibit 166: Weatherford International Plc - Key offerings
              • Exhibit 167: Weatherford International Plc - Segment focus
            • 12.17 WellMax Oilfield Technologies Pvt. Ltd.
              • Exhibit 168: WellMax Oilfield Technologies Pvt. Ltd. - Overview
              • Exhibit 169: WellMax Oilfield Technologies Pvt. Ltd. - Key offerings

            13 Appendix

            • 13.1 Scope of the report
              • 13.2 Inclusions and exclusions checklist
                • Exhibit 170: Inclusions checklist
                • Exhibit 171: Exclusions checklist
              • 13.3 Currency conversion rates for US$
                • Exhibit 172: Currency conversion rates for US$
              • 13.4 Research methodology
                • Exhibit 173: Research methodology
                • Exhibit 174: Validation techniques employed for market sizing
                • Exhibit 175: Information sources
              • 13.5 List of abbreviations
                • Exhibit 176: List of abbreviations

              Research Methodology

              Technavio presents a detailed picture of the market by way of study, synthesis, and summation of data from multiple sources. The analysts have presented the various facets of the market with a particular focus on identifying the key industry influencers. The data thus presented is comprehensive, reliable, and the result of extensive research, both primary and secondary.

              INFORMATION SOURCES

              Primary sources

              • Manufacturers and suppliers
              • Channel partners
              • Industry experts
              • Strategic decision makers

              Secondary sources

              • Industry journals and periodicals
              • Government data
              • Financial reports of key industry players
              • Historical data
              • Press releases

              DATA ANALYSIS

              Data Synthesis

              • Collation of data
              • Estimation of key figures
              • Analysis of derived insights

              Data Validation

              • Triangulation with data models
              • Reference against proprietary databases
              • Corroboration with industry experts

              REPORT WRITING

              Qualitative

              • Market drivers
              • Market challenges
              • Market trends
              • Five forces analysis

              Quantitative

              • Market size and forecast
              • Market segmentation
              • Geographical insights
              • Competitive landscape

              Interested in this report?

              Get your sample now to see our research methodology and insights!

              Download Now

              Frequently Asked Questions

              Well Testing Services market growth will increase by $ 2.69 bn during 2024-2028.

              The Well Testing Services market is expected to grow at a CAGR of 6.69% during 2024-2028.

              Well Testing Services market is segmented by Application( Onshore, Offshore) Type( Horizontal wells, Vertical wells, Europe, MEA, South America)

              Baker Hughes Co., China Oilfield Services Ltd., EXALO Drilling SA, Expro Group Holdings NV, Gulf Energy SAOC, Halliburton Co., MB Petroleum Services LLC, Minerals Technologies Inc., National Energy Services Reunited Corp., Oil States International Inc., OiLSERV, Rays Well Testing Service Inc, Schlumberger Ltd., SGS SA, Stuart Wells Ltd., TechnipFMC plc, TETRA Technologies Inc., Weatherford International Plc, Well Services Group, WellMax Oilfield Technologies Pvt. Ltd. are a few of the key vendors in the Well Testing Services market.

              North America will register the highest growth rate of 29% among the other regions. Therefore, the Well Testing Services market in North America is expected to garner significant business opportunities for the vendors during the forecast period.

              US, Canada, China, Russia, UK

              • Rise in deepwater and ultra-deepwater E and P projectsVendors in oil and gas upstream sectors have been extracting oil and natural gas from onshore wells for many years. Offshore wells are also popular sources of oil and gas E and P. In offshore E and P is the driving factor this market.
              • oil and gas companies are shifting their focus from shallow waters to deepwater and ultra-deepwater resources due to the presence of large is the driving factor this market.
              • untapped reserves. The production of oil is the driving factor this market.
              • particularly in the subsea environment is the driving factor this market.
              • is more expensive than in the conventional offshore environment. Furthermore is the driving factor this market.
              • data acquisition and drilling in offshore locations is also more challenging than in onshore locations owing to the harsh environment. Offshore operations face extreme weather conditions is the driving factor this market.
              • corrosive saltwater exposure is the driving factor this market.
              • and complex logistics. The dynamic nature of the sea necessitates specialized equipment and technology is the driving factor this market.
              • often resulting in higher costs and technical complexity. Additionally is the driving factor this market.
              • drilling in deep-sea environments involves greater depths and pressures is the driving factor this market.
              • demanding sophisticated techniques.  The depletion of easy-to-extract oil resources has resulted in an increase in the cost of hydrocarbon acquisition is the driving factor this market.
              • along with the geographical displacement of drilling operations. Thus is the driving factor this market.
              • with the depletion of resources in easily accessible locations is the driving factor this market.
              • such as onshore wells is the driving factor this market.
              • E and P companies are looking for less explored areas. As a result is the driving factor this market.
              • the number of offshore drilling projects is increasing. In addition is the driving factor this market.
              • the economics of offshore drilling is becoming feasible with the increase in crude oil prices.  The offshore oil and gas investments are expected to grow at a rapid pace during the forecast period is the driving factor this market.
              • owing to the rising demand for oil and gas across North America. As per the US EIA is the driving factor this market.
              • global offshore deepwater oil production will increase by 2.7 million barrels per day (mbpd) between 2017 and 2040. Offshore investments reach approximately $155 billion by the end of 2022 from $145 billion in 2021. Offshore projects will also provide ample opportunities for contractors. For instance is the driving factor this market.
              • the North Platte project of TotalEnergies enters the final stage of its tender process. Similarly is the driving factor this market.
              • in June 2023 is the driving factor this market.
              • Woodside announced an investment of $7.2 billion in the development of Mexicos deepwater oil project. Mexican deepwater offshore oil production will begin with the Trion oil field is the driving factor this market.
              • a joint venture with the state-owned Petroleos Mexicanos oil business. The above-mentioned projects involve tapping into offshore reserves located in deep and ultra-deep waters is the driving factor this market.
              • presenting unique technical challenges. Well testing services play a crucial role in assessing reservoir characteristics is the driving factor this market.
              • flow rates is the driving factor this market.
              • and overall is the driving factor this market.
              • well performance in such environments. The need for accurate data and insights in challenging offshore conditions enhances the demand for specialized well testing services is the driving factor this market.
              • which will contribute to the growth of the global well testing services market during the forecast period. is the driving factor this market.

              The Well Testing Services market vendors should focus on grabbing business opportunities from the Onshore segment as it accounted for the largest market share in the base year.