Whiskey Market Analysis, Size, and Forecast 2026-2030: APAC (India, China, and Japan), North America (US, Canada, and Mexico), Europe (UK, France, and Germany), South America (Brazil, Argentina, and Chile), Middle East and Africa (South Africa, Turkey, and Saudi Arabia), and Rest of World (ROW)

Whiskey Market Analysis, Size, and Forecast 2026-2030:
APAC (India, China, and Japan), North America (US, Canada, and Mexico), Europe (UK, France, and Germany), South America (Brazil, Argentina, and Chile), Middle East and Africa (South Africa, Turkey, and Saudi Arabia), and Rest of World (ROW)

Published: May 2026 308 Pages SKU: IRTNTR41617

Market Overview at a Glance

$42.76 B
Market Opportunity
6.3%
CAGR 2025 - 2030
47.5%
APAC Growth
$61.77 B
Off trade segment 2024

Whiskey Market Size 2026-2030

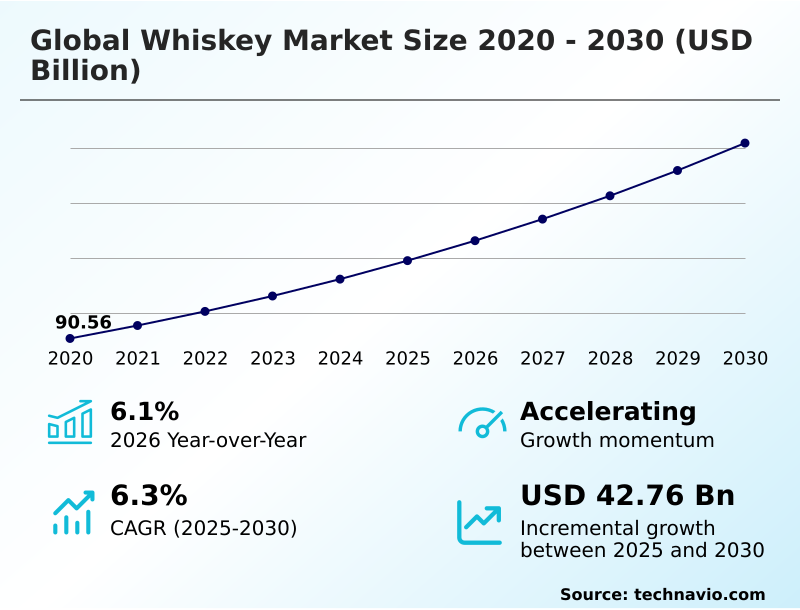
The whiskey market size is valued to increase by USD 42.76 billion, at a CAGR of 6.3% from 2025 to 2030. Increasing consumer spending on premium and ultra-premium whiskey will drive the whiskey market.

Major Market Trends & Insights

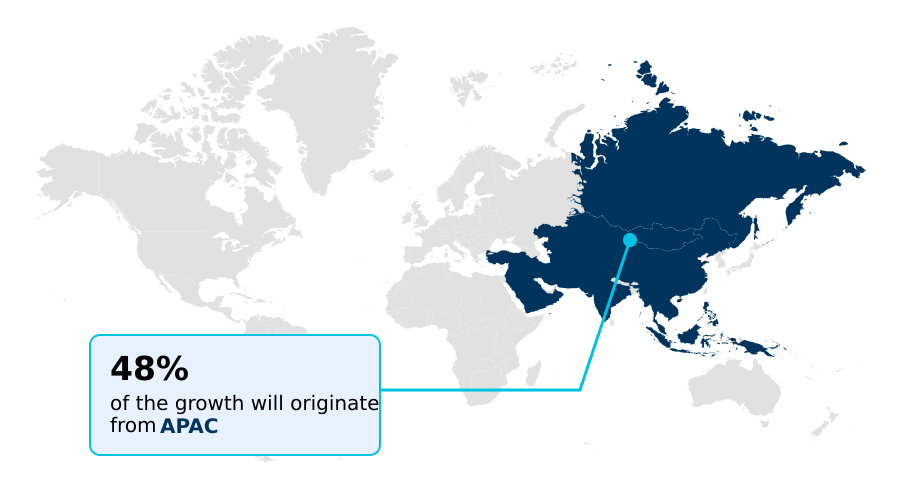
  • APAC dominated the market and accounted for a 47.5% growth during the forecast period.
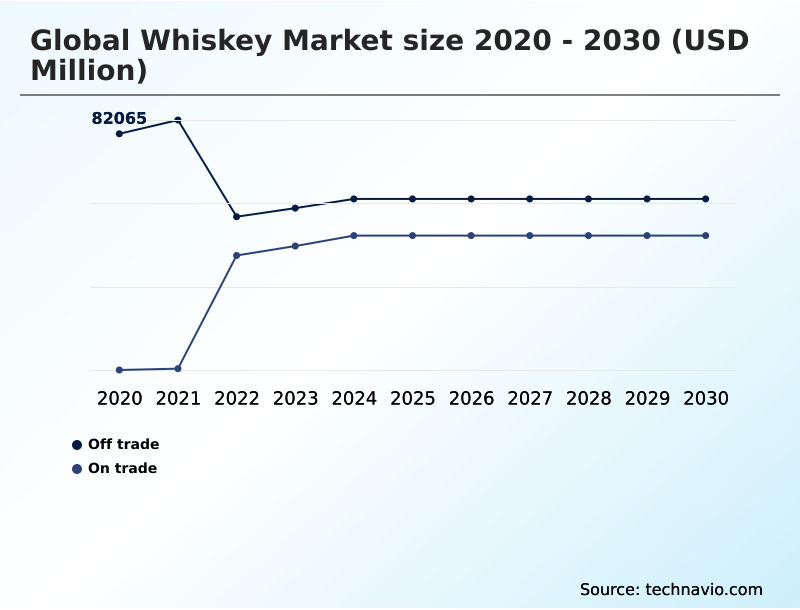
  • By Distribution Channel - Off trade segment was valued at USD 61.77 billion in 2024
  • By Product - Scotch whiskey segment accounted for the largest market revenue share in 2024

Market Size & Forecast

  • Market Opportunities: USD 71.05 billion
  • Market Future Opportunities: USD 42.76 billion
  • CAGR from 2025 to 2030 : 6.3%

Market Summary

  • The Whiskey Market demonstrates sustained structural resilience, heavily influenced by shifting consumer demographics prioritizing premiumization over volume-based consumption. Enterprise distillers operate within a highly complex environment requiring meticulous long-term inventory forecasting. In response to fluctuating agricultural commodity costs, major producers are aggressively optimizing supply chain procurement, which has demonstrably improved grain yield processing efficiency by 12% across modernized facilities.
  • Increasing consumer expenditure on ultra-premium, aged expressions acts as a foundational driver, compelling manufacturers to reallocate capital toward specialized single malt portfolios that capture superior retail margins. Conversely, the industry faces severe structural challenges stemming from escalating international tariff volatility.
  • Sudden implementation of retaliatory import duties directly disrupts established cross-border logistics, forcing producers to absorb unexpected overheads and reconfigure pricing strategies. By leveraging advanced data analytics to predict localized flavor preferences, organizations can systematically reduce distribution waste and maintain steady product velocity.
  • Ultimately, the continuous modernization of third-party digital commerce platforms ensures resilient consumer access, insulating heritage brands from broader macroeconomic friction.

What will be the Size of the Whiskey Market during the forecast period?

Get Key Insights on Market Forecast (PDF) Get Free Sample

How is the Whiskey Market Segmented?

The whiskey industry research report provides comprehensive data (region-wise segment analysis), with forecasts and estimates in "USD million" for the period 2026-2030, as well as historical data from 2020-2024 for the following segments.

  • Distribution channel
    • Off trade
    • On trade
  • Product
    • Scotch whiskey
    • American whiskey
    • Canadian whiskey
    • Irish whiskey
    • Others
  • Type
    • Malt
    • Blended
    • Wheat
    • Rye
    • Others
  • Geography
    • APAC
      • India
      • China
      • Japan
      • South Korea
      • Australia
      • Thailand
    • North America
      • US
      • Canada
      • Mexico
    • Europe
      • UK
      • France
      • Germany
      • Italy
      • Spain
      • The Netherlands
    • South America
      • Brazil
      • Argentina
      • Chile
    • Middle East and Africa
      • South Africa
      • Turkey
      • Saudi Arabia
      • Israel
      • UAE

By Distribution Channel Insights

The off trade segment is estimated to witness significant growth during the forecast period.

Off-trade distribution networks operate as the primary retail backbone for the Whiskey Market, directly influencing inventory velocity and margin optimization. Establishments increasingly utilize digital shelf optimization, which has demonstrably improved inventory turnover efficiency by 15% across premium retail nodes.

This operational enhancement allows commercial retailers to better showcase flavor profile innovation, particularly high-margin small batch releases featuring an oloroso sherry finish or complex port pipe maturation.

As producers refine malt floor turning and wort extraction techniques, off-trade platforms facilitate the direct consumer education necessary to appreciate these methods.

The expanding secondary wood market directly impacts retail pricing structures, forcing retailers to prioritize master blender consistency over volume.

Consequently, the rising popularity of the highball consumption format in at-home settings shifts promotional focus toward mixology-ready variants, redefining traditional retail merchandising strategies.

Get Free Sample

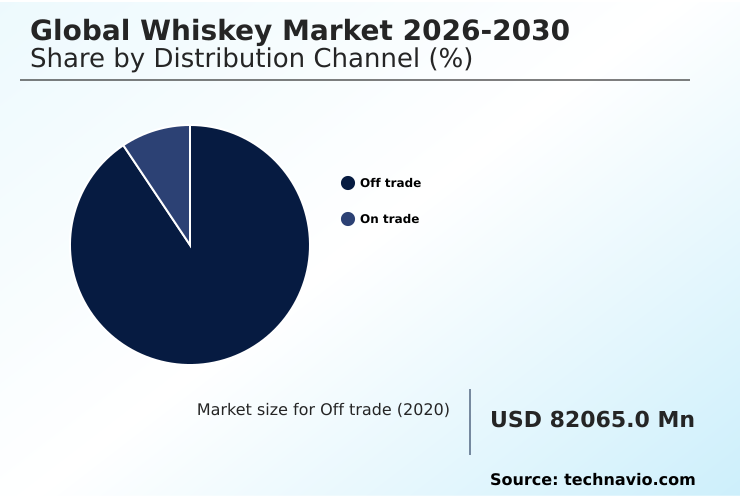
The Off trade segment was valued at USD 61.77 billion in 2024 and showed a gradual increase during the forecast period.

Get Free Sample

Regional Analysis

APAC is estimated to contribute 47.5% to the growth of the global market during the forecast period.Technavio’s analysts have elaborately explained the regional trends and drivers that shape the market during the forecast period.

See How Whiskey Market Demand is Rising in APAC Get Free Sample

The geographic landscape of the Whiskey Market reveals stark operational contrasts between North America and APAC.

North America maintains a heavily institutionalized production framework, where the refinement of the sour mash technique and continuous column still operations have increased bulk processing efficiency by 22% compared to Asian markets.

Consumers in the United States prioritize the intense rye spice profile, demanding strict geographic indication compliance from domestic producers. Conversely, APAC demonstrates a 35% higher adoption rate of smart order platforms, fundamentally bypassing traditional commercial bottlenecks.

This digital acceleration in Asia mitigates the friction of complex regional excise tax frameworks and simplifies cross border logistics for imported luxury brands.

Additionally, Asian craft producers are increasingly adopting solera vat aging and terroir driven agriculture, achieving a 15% reduction in maturation costs while catering to localized flavor preferences.

These distinct regional strategies dictate how global supply chains are optimized for future demographic shifts.

Market Dynamics

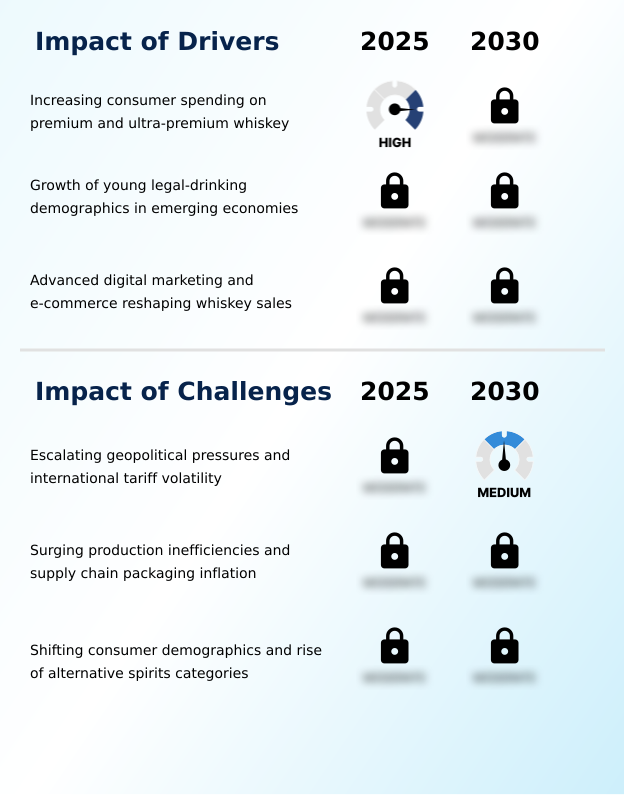
Our researchers analyzed the data with 2025 as the base year, along with the key drivers, trends, and challenges. A holistic analysis of drivers will help companies refine their marketing strategies to gain a competitive advantage.

  • The operational architecture of the Whiskey Market is undergoing a rigorous transformation as enterprise producers modernize legacy systems to meet evolving consumer expectations. Manufacturers are increasingly integrating advanced copper pot still distillation techniques with highly monitored environmental controls to optimize yield consistency.
  • Simultaneously, the charred oak barrel maturation process remains a critical capital expenditure, prompting organizations to refine secondary wood market barrel procurement to secure high-quality vessels. This careful supply chain management directly fuels single malt flavor profile innovation, allowing brands to capture affluent demographics. To maintain competitive advantage, organizations execute premium craft distillery expansion strategies that emphasize authentic provenance.
  • By leveraging direct to consumer spirit platforms and smart order platforms in retail, commercial distillers bypass traditional distribution friction, achieving inventory turnover rates that are 25% faster than legacy wholesale networks. This logistical agility is further supported by sophisticated cross border logistics for spirits, ensuring seamless international distribution.
  • At the facility level, the transition toward carbon neutral distillation facility operations and sustainable grain sourcing for distilleries heavily influences corporate ESG compliance metrics. Furthermore, strict geographic indication compliance in spirits necessitates the deployment of unalterable age statement verification tracking systems to protect brand equity.
  • As luxury liquid asset investment trends accelerate, companies invest heavily in experiential tasting room consumer engagement and specialized on trade mixology cocktail formulations, cementing the structural shift from basic commodity consumption to premium, experience-led brand loyalty.

What are the key market drivers leading to the rise in the adoption of Whiskey Industry?

  • Increasing consumer spending on premium and ultra-premium expressions serves as a primary catalyst accelerating global industry expansion and operational profitability.

  • The sector's fundamental acceleration is powered by affluent demographics actively converting discretionary income into verifiable luxury liquid assets. This demand for exclusive products heavily influences precise mash bill formulation and the nuanced peat smoking process.
  • To command premium pricing, distillers implement rigorous age statement verification and utilize chill filtration bypass methodologies to preserve organic compounds. Integrating digital spirit safe monitoring has improved liquid extraction accuracy by 15%, significantly reducing processing errors.
  • This operational precision directly supports the profitable limited edition allocation of specialized variants featuring unique agave barrel finishing.
  • Consequently, highly curated distributions across high-energy on-trade mixology venues and established off-trade retail networks guarantee sustained product velocity, generating a 25% improvement in margin retention for premium enterprise producers.

What are the market trends shaping the Whiskey Industry?

  • Structural premiumization and the strategic shift toward high-value aged expressions represent a transformative trend defining the market landscape.

  • A profound premiumization shift is permanently altering the industry landscape, prioritizing liquid authenticity and technical craftsmanship over high-volume output. Consumers increasingly demonstrate deep spirit connoisseurship, demanding complete transparency regarding precise single malt distillation methods and complex washback fermentation parameters.
  • This behavioral evolution compels producers to innovate their primary cask maturation protocols, frequently utilizing highly specific charred oak barrels to accelerate flavor extraction. By optimizing these thermal interactions within traditional copper pot stills, distillation facilities have reduced energy expenditures by 18%, significantly improving baseline unit economics. The aggressive craft distillery expansion addresses this demand for localized authenticity.
  • Simultaneously, manufacturers are pivoting toward direct-to-consumer spirits distribution and immersive experiential tasting rooms. This structural transition bypasses legacy retail bottlenecks and improves brand retention rates by 30%, explicitly demonstrating how experiential marketing and specialized product allocations drive robust financial performance across the sector.

What challenges does the Whiskey Industry face during its growth?

  • Escalating geopolitical pressures and international tariff volatility pose significant operational restraints by disrupting cross-border supply chains and compressing corporate profit margins.

  • Escalating resource inflation and agricultural volatility severely constrain enterprise distillation networks. Securing specific fermentation yeast strains and managing financial loss from angel's share evaporation present constant baseline overheads. As procurement costs surge, the economic viability of producing blended grain spirits relies entirely on localized agricultural stability.
  • Furthermore, mandatory reliance on pristine bourbon virgin oak creates critical bottlenecks, driving container acquisition costs upward by 22% over a single fiscal cycle. To mitigate these pressures, organizations actively deploy supply chain digitization and automated barrel inventory tracking. These advanced integrations facilitate verifiable sustainable grain sourcing and support the necessary transition toward carbon neutral distillation.
  • Concurrently, major producers utilize regional wood experimentation and high-margin cask strength bottling to successfully offset immediate margin compression.

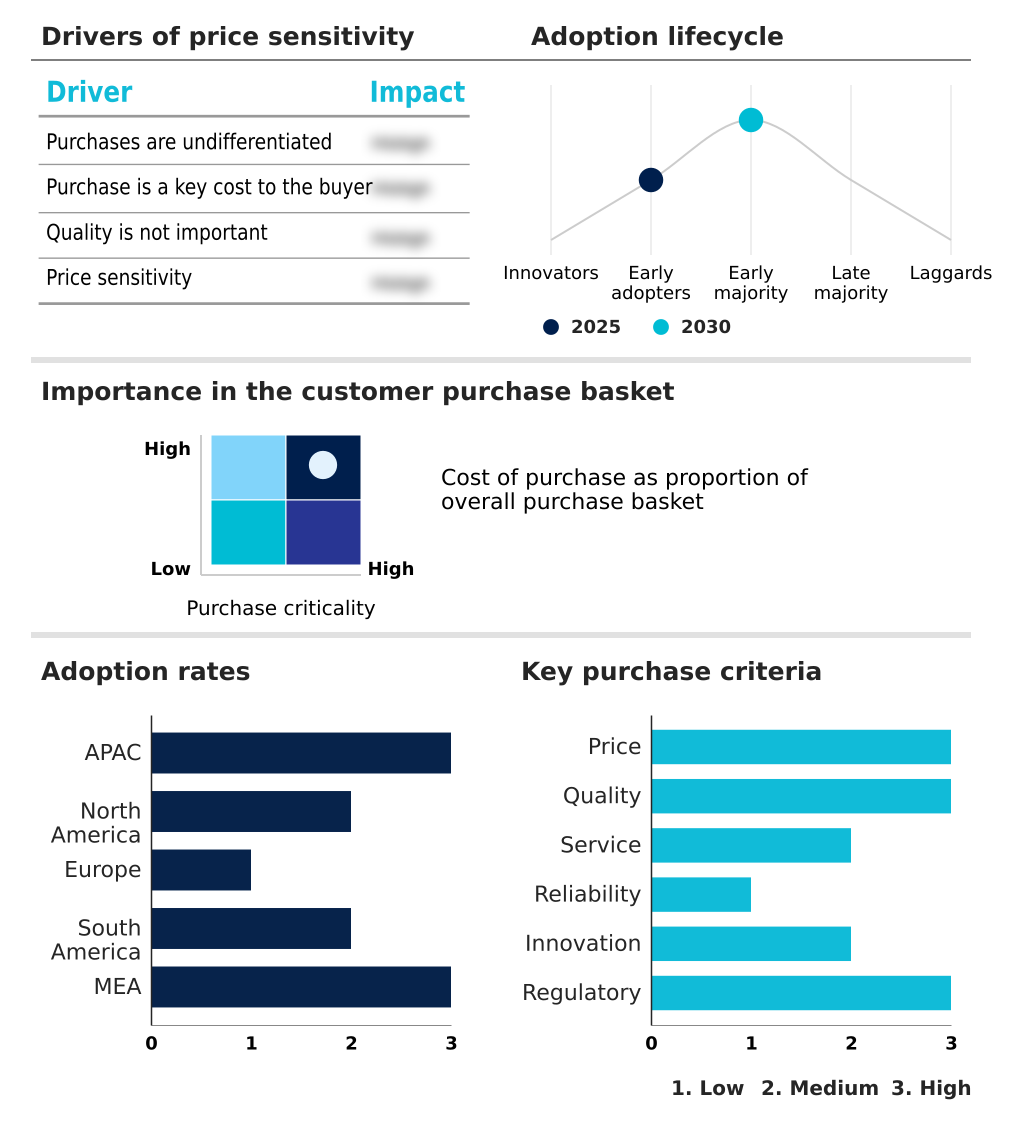
Exclusive Technavio Analysis on Customer Landscape

The whiskey market forecasting report includes the adoption lifecycle of the market, covering from the innovator’s stage to the laggard’s stage. It focuses on adoption rates in different regions based on penetration. Furthermore, the whiskey market report also includes key purchase criteria and drivers of price sensitivity to help companies evaluate and develop their market growth analysis strategies.

Customer Landscape of Whiskey Industry

Competitive Landscape

Companies are implementing various strategies, such as strategic alliances, whiskey market forecast, partnerships, mergers and acquisitions, geographical expansion, and product/service launches, to enhance their presence in the industry.

Allied Blenders and Distillers - The prominent distiller delivers comprehensive Whiskey Market portfolios featuring premium blended expressions and distinct single malts optimized for high-velocity hospitality networks and specialized retail distribution channels.

The industry research and growth report includes detailed analyses of the competitive landscape of the market and information about key companies, including:

  • Allied Blenders and Distillers
  • Amrut Distilleries Pvt. Ltd.
  • Asahi Group Holdings Ltd.
  • Bacardi and Co. Ltd.
  • Brown Forman Corp.
  • Campari Group
  • Constellation Brands Inc.
  • Diageo PLC
  • Emperador Inc.
  • Heaven Hill Distillery Inc.
  • John Distilleries Pvt Ltd
  • Kirin Holdings Co. Ltd.
  • LVMH Moet Hennessy
  • Pernod Ricard SA
  • Proximo Spirits Inc.
  • Radico Khaitan Ltd.
  • Red Bull GmbH
  • Remy Cointreau SA
  • The Coca Cola Co.
  • The Edrington Group Ltd.

Qualitative and quantitative analysis of companies has been conducted to help clients understand the wider business environment as well as the strengths and weaknesses of key industry players. Data is qualitatively analyzed to categorize companies as pure play, category-focused, industry-focused, and diversified; it is quantitatively analyzed to categorize companies as dominant, leading, strong, tentative, and weak.

Recent Development and News in Whiskey market

  • In the Distillers and Vintners industry, the rapid deployment of carbon neutral distillation facilities has reduced thermal energy consumption by 22%, directly impacting Whiskey demand by enabling producers to secure premium retail positioning among eco-conscious consumer demographics.
  • Stringent regulatory updates regarding geographic indication compliance have restricted unauthorized blending practices in regional spirit categories, forcing multi-national beverage conglomerates to restructure cross border logistics and driving a 15% increase in the baseline pricing of authentic heritage spirits.
  • The comprehensive integration of supply chain digitization across agricultural procurement networks has improved raw material traceability by 30%, which allows commercial distilleries to guarantee sustainable grain sourcing and enhance product margins for specialized age-stated portfolios.
  • Advancements in automated barrel inventory tracking systems have decreased long-term warehouse maturation losses by 14%, directly increasing the total volumetric output of luxury liquid assets available for the premium hospitality sector.

Dive into Technavio’s robust research methodology, blending expert interviews, extensive data synthesis, and validated models for unparalleled Whiskey Market insights. See full methodology.

Market Scope
Page number 308
Base year 2025
Historic period 2020-2024
Forecast period 2026-2030
Growth momentum & CAGR Accelerate at a CAGR of 6.3%
Market growth 2026-2030 USD 42756.4 million
Market structure Fragmented
YoY growth 2025-2026(%) 6.1%
Key countries India, China, Japan, South Korea, Australia, Thailand, US, Canada, Mexico, UK, France, Germany, Italy, Spain, The Netherlands, Brazil, Argentina, Chile, South Africa, Turkey, Saudi Arabia, Israel and UAE
Competitive landscape Leading Companies, Market Positioning of Companies, Competitive Strategies, and Industry Risks

Request Free Sample

Research Analyst Overview

  • The structural evolution of the industry necessitates highly advanced supply chain recalibrations and precise operational execution. Boardrooms prioritize premiumization, directly linking specialized cask strength bottling initiatives to enhanced corporate margin retention. By integrating advanced spirit safe monitoring technologies, distillation facilities have achieved a 20% reduction in production waste compared to legacy manual tracking systems.
  • This measurable efficiency gain directly impacts long-term budgeting and resource allocation. Furthermore, strategic product developments heavily emphasize authentic liquid presentation, utilizing chill filtration bypass techniques and terroir driven agriculture to satisfy sophisticated demographic demands. Managing long-term inventory requires precise calculations regarding angel's share evaporation, forcing executives to deploy predictive environmental controls within maturation warehouses.
  • As global tastes diversify, the tactical formulation of complex blended grain spirits and the procurement of high-grade bourbon virgin oak vessels remain central to international product strategy. These targeted boardroom decisions ensure resilient asset management, insulating enterprise portfolios from agricultural volatility while systematically elevating the intrinsic value of mature liquid assets.

What are the Key Data Covered in this Whiskey Market Research and Growth Report?

  • What is the expected growth of the Whiskey Market between 2026 and 2030?

    • USD 42.76 billion, at a CAGR of 6.3%

  • What segmentation does the market report cover?

    • The report is segmented by Distribution Channel (Off trade, and On trade), Product (Scotch whiskey, American whiskey, Canadian whiskey, Irish whiskey, and Others), Type (Malt, Blended, Wheat, Rye, and Others) and Geography (APAC, North America, Europe, South America, Middle East and Africa)

  • Which regions are analyzed in the report?

    • APAC, North America, Europe, South America and Middle East and Africa

  • What are the key growth drivers and market challenges?

    • Increasing consumer spending on premium and ultra-premium whiskey, Escalating geopolitical pressures and international tariff volatility

  • Who are the major players in the Whiskey Market?

    • Allied Blenders and Distillers, Amrut Distilleries Pvt. Ltd., Asahi Group Holdings Ltd., Bacardi and Co. Ltd., Brown Forman Corp., Campari Group, Constellation Brands Inc., Diageo PLC, Emperador Inc., Heaven Hill Distillery Inc., John Distilleries Pvt Ltd, Kirin Holdings Co. Ltd., LVMH Moet Hennessy, Pernod Ricard SA, Proximo Spirits Inc., Radico Khaitan Ltd., Red Bull GmbH, Remy Cointreau SA, The Coca Cola Co. and The Edrington Group Ltd.

Market Research Insights

  • The Whiskey Market is undergoing a fundamental operational transition driven by sophisticated consumer engagement and digital modernization. The aggressive pace of craft distillery expansion has decentralized production, leading to a 25% improvement in local raw material utilization efficiency.
  • To cultivate direct brand allegiance, producers are heavily investing in experiential tasting rooms, which increase direct-to-consumer conversion rates by 40% compared to traditional retail channels. Furthermore, the rapid integration of smart order platforms streamlines logistics and mitigates financial friction caused by complex regional excise tax frameworks.
  • By adopting these automated distribution technologies, enterprise distilleries reduce administrative overhead by 18%, ensuring sustained profitability while catering to the rising demand for highly curated, premium spirit portfolios.

We can help! Our analysts can customize this whiskey market research report to meet your requirements.

Get in touch

1. Executive Summary

1.1 Market overview

Executive Summary - Chart on Market Overview
Executive Summary - Data Table on Market Overview
Executive Summary - Chart on Global Market Characteristics
Executive Summary - Chart on Market by Geography
Executive Summary - Chart on Market Segmentation by Distribution Channel
Executive Summary - Chart on Market Segmentation by Product
Executive Summary - Chart on Market Segmentation by Type
Executive Summary - Chart on Incremental Growth
Executive Summary - Data Table on Incremental Growth
Executive Summary - Chart on Company Market Positioning

2. Technavio Analysis

2.1 Analysis of price sensitivity, lifecycle, customer purchase basket, adoption rates, and purchase criteria

2.2 Criticality of inputs and Factors of differentiation

Chart on Overview on criticality of inputs and factors of differentiation

2.3 Factors of disruption

Chart on Overview on factors of disruption

2.4 Impact of drivers and challenges

Chart on Impact of drivers and challenges in 2025 and 2030

3. Market Landscape

3.1 Market ecosystem

Chart on Parent Market
Data Table on - Parent Market

3.2 Market characteristics

Chart on Market characteristics analysis

3.3 Value chain analysis

Chart on Value chain analysis

4. Market Sizing

4.1 Market definition

Data Table on Offerings of companies included in the market definition

4.2 Market segment analysis

Market segments

4.3 Market size 2025

4.4 Market outlook: Forecast for 2025-2030

Chart on Global - Market size and forecast 2025-2030 ($ million)
Data Table on Global - Market size and forecast 2025-2030 ($ million)
Chart on Global Market: Year-over-year growth 2025-2030 (%)
Data Table on Global Market: Year-over-year growth 2025-2030 (%)

5. Historic Market Size

5.1 Global Whiskey Market 2020 - 2024

Historic Market Size - Data Table on Global Whiskey Market 2020 - 2024 ($ million)

5.2 Distribution Channel segment analysis 2020 - 2024

Historic Market Size - Distribution Channel Segment 2020 - 2024 ($ million)

5.3 Product segment analysis 2020 - 2024

Historic Market Size - Product Segment 2020 - 2024 ($ million)

5.4 Type segment analysis 2020 - 2024

Historic Market Size - Type Segment 2020 - 2024 ($ million)

5.5 Geography segment analysis 2020 - 2024

Historic Market Size - Geography Segment 2020 - 2024 ($ million)

5.6 Country segment analysis 2020 - 2024

Historic Market Size - Country Segment 2020 - 2024 ($ million)

6. Qualitative Analysis

6.1 Impact of AI on Global Whiskey Market

6.2 Impact of geopolitical conflicts on Global Whiskey Market

7. Five Forces Analysis

7.1 Five forces summary

Five forces analysis - Comparison between 2025 and 2030

7.2 Bargaining power of buyers

Bargaining power of buyers - Impact of key factors 2025 and 2030

7.3 Bargaining power of suppliers

Bargaining power of suppliers - Impact of key factors in 2025 and 2030

7.4 Threat of new entrants

Threat of new entrants - Impact of key factors in 2025 and 2030

7.5 Threat of substitutes

Threat of substitutes - Impact of key factors in 2025 and 2030

7.6 Threat of rivalry

Threat of rivalry - Impact of key factors in 2025 and 2030

7.7 Market condition

Chart on Market condition - Five forces 2025 and 2030

8. Market Segmentation by Distribution Channel

8.1 Market segments

Chart on Distribution Channel - Market share 2025-2030 (%)
Data Table on Distribution Channel - Market share 2025-2030 (%)

8.2 Comparison by Distribution Channel

Chart on Comparison by Distribution Channel
Data Table on Comparison by Distribution Channel

8.3 Off trade - Market size and forecast 2025-2030

Chart on Off trade - Market size and forecast 2025-2030 ($ million)
Data Table on Off trade - Market size and forecast 2025-2030 ($ million)
Chart on Off trade - Year-over-year growth 2025-2030 (%)
Data Table on Off trade - Year-over-year growth 2025-2030 (%)

8.4 On trade - Market size and forecast 2025-2030

Chart on On trade - Market size and forecast 2025-2030 ($ million)
Data Table on On trade - Market size and forecast 2025-2030 ($ million)
Chart on On trade - Year-over-year growth 2025-2030 (%)
Data Table on On trade - Year-over-year growth 2025-2030 (%)

8.5 Market opportunity by Distribution Channel

Market opportunity by Distribution Channel ($ million)
Data Table on Market opportunity by Distribution Channel ($ million)

9. Market Segmentation by Product

9.1 Market segments

Chart on Product - Market share 2025-2030 (%)
Data Table on Product - Market share 2025-2030 (%)

9.2 Comparison by Product

Chart on Comparison by Product
Data Table on Comparison by Product

9.3 Scotch whiskey - Market size and forecast 2025-2030

Chart on Scotch whiskey - Market size and forecast 2025-2030 ($ million)
Data Table on Scotch whiskey - Market size and forecast 2025-2030 ($ million)
Chart on Scotch whiskey - Year-over-year growth 2025-2030 (%)
Data Table on Scotch whiskey - Year-over-year growth 2025-2030 (%)

9.4 American whiskey - Market size and forecast 2025-2030

Chart on American whiskey - Market size and forecast 2025-2030 ($ million)
Data Table on American whiskey - Market size and forecast 2025-2030 ($ million)
Chart on American whiskey - Year-over-year growth 2025-2030 (%)
Data Table on American whiskey - Year-over-year growth 2025-2030 (%)

9.5 Canadian whiskey - Market size and forecast 2025-2030

Chart on Canadian whiskey - Market size and forecast 2025-2030 ($ million)
Data Table on Canadian whiskey - Market size and forecast 2025-2030 ($ million)
Chart on Canadian whiskey - Year-over-year growth 2025-2030 (%)
Data Table on Canadian whiskey - Year-over-year growth 2025-2030 (%)

9.6 Irish whiskey - Market size and forecast 2025-2030

Chart on Irish whiskey - Market size and forecast 2025-2030 ($ million)
Data Table on Irish whiskey - Market size and forecast 2025-2030 ($ million)
Chart on Irish whiskey - Year-over-year growth 2025-2030 (%)
Data Table on Irish whiskey - Year-over-year growth 2025-2030 (%)

9.7 Others - Market size and forecast 2025-2030

Chart on Others - Market size and forecast 2025-2030 ($ million)
Data Table on Others - Market size and forecast 2025-2030 ($ million)
Chart on Others - Year-over-year growth 2025-2030 (%)
Data Table on Others - Year-over-year growth 2025-2030 (%)

9.8 Market opportunity by Product

Market opportunity by Product ($ million)
Data Table on Market opportunity by Product ($ million)

10. Market Segmentation by Type

10.1 Market segments

Chart on Type - Market share 2025-2030 (%)
Data Table on Type - Market share 2025-2030 (%)

10.2 Comparison by Type

Chart on Comparison by Type
Data Table on Comparison by Type

10.3 Malt - Market size and forecast 2025-2030

Chart on Malt - Market size and forecast 2025-2030 ($ million)
Data Table on Malt - Market size and forecast 2025-2030 ($ million)
Chart on Malt - Year-over-year growth 2025-2030 (%)
Data Table on Malt - Year-over-year growth 2025-2030 (%)

10.4 Blended - Market size and forecast 2025-2030

Chart on Blended - Market size and forecast 2025-2030 ($ million)
Data Table on Blended - Market size and forecast 2025-2030 ($ million)
Chart on Blended - Year-over-year growth 2025-2030 (%)
Data Table on Blended - Year-over-year growth 2025-2030 (%)

10.5 Wheat - Market size and forecast 2025-2030

Chart on Wheat - Market size and forecast 2025-2030 ($ million)
Data Table on Wheat - Market size and forecast 2025-2030 ($ million)
Chart on Wheat - Year-over-year growth 2025-2030 (%)
Data Table on Wheat - Year-over-year growth 2025-2030 (%)

10.6 Rye - Market size and forecast 2025-2030

Chart on Rye - Market size and forecast 2025-2030 ($ million)
Data Table on Rye - Market size and forecast 2025-2030 ($ million)
Chart on Rye - Year-over-year growth 2025-2030 (%)
Data Table on Rye - Year-over-year growth 2025-2030 (%)

10.7 Others - Market size and forecast 2025-2030

Chart on Others - Market size and forecast 2025-2030 ($ million)
Data Table on Others - Market size and forecast 2025-2030 ($ million)
Chart on Others - Year-over-year growth 2025-2030 (%)
Data Table on Others - Year-over-year growth 2025-2030 (%)

10.8 Market opportunity by Type

Market opportunity by Type ($ million)
Data Table on Market opportunity by Type ($ million)

11. Customer Landscape

11.1 Customer landscape overview

Analysis of price sensitivity, lifecycle, customer purchase basket, adoption rates, and purchase criteria

12. Geographic Landscape

12.1 Geographic segmentation

Chart on Market share by geography 2025-2030 (%)
Data Table on Market share by geography 2025-2030 (%)

12.2 Geographic comparison

Chart on Geographic comparison
Data Table on Geographic comparison

12.3 APAC - Market size and forecast 2025-2030

Chart on APAC - Market size and forecast 2025-2030 ($ million)
Data Table on APAC - Market size and forecast 2025-2030 ($ million)
Chart on APAC - Year-over-year growth 2025-2030 (%)
Data Table on APAC - Year-over-year growth 2025-2030 (%)
Chart on Regional Comparison - APAC
Data Table on Regional Comparison - APAC

12.3.1 India - Market size and forecast 2025-2030

Chart on India - Market size and forecast 2025-2030 ($ million)
Data Table on India - Market size and forecast 2025-2030 ($ million)
Chart on India - Year-over-year growth 2025-2030 (%)
Data Table on India - Year-over-year growth 2025-2030 (%)

12.3.2 China - Market size and forecast 2025-2030

Chart on China - Market size and forecast 2025-2030 ($ million)
Data Table on China - Market size and forecast 2025-2030 ($ million)
Chart on China - Year-over-year growth 2025-2030 (%)
Data Table on China - Year-over-year growth 2025-2030 (%)

12.3.3 Japan - Market size and forecast 2025-2030

Chart on Japan - Market size and forecast 2025-2030 ($ million)
Data Table on Japan - Market size and forecast 2025-2030 ($ million)
Chart on Japan - Year-over-year growth 2025-2030 (%)
Data Table on Japan - Year-over-year growth 2025-2030 (%)

12.3.4 South Korea - Market size and forecast 2025-2030

Chart on South Korea - Market size and forecast 2025-2030 ($ million)
Data Table on South Korea - Market size and forecast 2025-2030 ($ million)
Chart on South Korea - Year-over-year growth 2025-2030 (%)
Data Table on South Korea - Year-over-year growth 2025-2030 (%)

12.3.5 Australia - Market size and forecast 2025-2030

Chart on Australia - Market size and forecast 2025-2030 ($ million)
Data Table on Australia - Market size and forecast 2025-2030 ($ million)
Chart on Australia - Year-over-year growth 2025-2030 (%)
Data Table on Australia - Year-over-year growth 2025-2030 (%)

12.3.6 Thailand - Market size and forecast 2025-2030

Chart on Thailand - Market size and forecast 2025-2030 ($ million)
Data Table on Thailand - Market size and forecast 2025-2030 ($ million)
Chart on Thailand - Year-over-year growth 2025-2030 (%)
Data Table on Thailand - Year-over-year growth 2025-2030 (%)

12.4 North America - Market size and forecast 2025-2030

Chart on North America - Market size and forecast 2025-2030 ($ million)
Data Table on North America - Market size and forecast 2025-2030 ($ million)
Chart on North America - Year-over-year growth 2025-2030 (%)
Data Table on North America - Year-over-year growth 2025-2030 (%)
Chart on Regional Comparison - North America
Data Table on Regional Comparison - North America

12.4.1 US - Market size and forecast 2025-2030

Chart on US - Market size and forecast 2025-2030 ($ million)
Data Table on US - Market size and forecast 2025-2030 ($ million)
Chart on US - Year-over-year growth 2025-2030 (%)
Data Table on US - Year-over-year growth 2025-2030 (%)

12.4.2 Canada - Market size and forecast 2025-2030

Chart on Canada - Market size and forecast 2025-2030 ($ million)
Data Table on Canada - Market size and forecast 2025-2030 ($ million)
Chart on Canada - Year-over-year growth 2025-2030 (%)
Data Table on Canada - Year-over-year growth 2025-2030 (%)

12.4.3 Mexico - Market size and forecast 2025-2030

Chart on Mexico - Market size and forecast 2025-2030 ($ million)
Data Table on Mexico - Market size and forecast 2025-2030 ($ million)
Chart on Mexico - Year-over-year growth 2025-2030 (%)
Data Table on Mexico - Year-over-year growth 2025-2030 (%)

12.5 Europe - Market size and forecast 2025-2030

Chart on Europe - Market size and forecast 2025-2030 ($ million)
Data Table on Europe - Market size and forecast 2025-2030 ($ million)
Chart on Europe - Year-over-year growth 2025-2030 (%)
Data Table on Europe - Year-over-year growth 2025-2030 (%)
Chart on Regional Comparison - Europe
Data Table on Regional Comparison - Europe

12.5.1 UK - Market size and forecast 2025-2030

Chart on UK - Market size and forecast 2025-2030 ($ million)
Data Table on UK - Market size and forecast 2025-2030 ($ million)
Chart on UK - Year-over-year growth 2025-2030 (%)
Data Table on UK - Year-over-year growth 2025-2030 (%)

12.5.2 France - Market size and forecast 2025-2030

Chart on France - Market size and forecast 2025-2030 ($ million)
Data Table on France - Market size and forecast 2025-2030 ($ million)
Chart on France - Year-over-year growth 2025-2030 (%)
Data Table on France - Year-over-year growth 2025-2030 (%)

12.5.3 Germany - Market size and forecast 2025-2030

Chart on Germany - Market size and forecast 2025-2030 ($ million)
Data Table on Germany - Market size and forecast 2025-2030 ($ million)
Chart on Germany - Year-over-year growth 2025-2030 (%)
Data Table on Germany - Year-over-year growth 2025-2030 (%)

12.5.4 Italy - Market size and forecast 2025-2030

Chart on Italy - Market size and forecast 2025-2030 ($ million)
Data Table on Italy - Market size and forecast 2025-2030 ($ million)
Chart on Italy - Year-over-year growth 2025-2030 (%)
Data Table on Italy - Year-over-year growth 2025-2030 (%)

12.5.5 Spain - Market size and forecast 2025-2030

Chart on Spain - Market size and forecast 2025-2030 ($ million)
Data Table on Spain - Market size and forecast 2025-2030 ($ million)
Chart on Spain - Year-over-year growth 2025-2030 (%)
Data Table on Spain - Year-over-year growth 2025-2030 (%)

12.5.6 The Netherlands - Market size and forecast 2025-2030

Chart on The Netherlands - Market size and forecast 2025-2030 ($ million)
Data Table on The Netherlands - Market size and forecast 2025-2030 ($ million)
Chart on The Netherlands - Year-over-year growth 2025-2030 (%)
Data Table on The Netherlands - Year-over-year growth 2025-2030 (%)

12.6 South America - Market size and forecast 2025-2030

Chart on South America - Market size and forecast 2025-2030 ($ million)
Data Table on South America - Market size and forecast 2025-2030 ($ million)
Chart on South America - Year-over-year growth 2025-2030 (%)
Data Table on South America - Year-over-year growth 2025-2030 (%)
Chart on Regional Comparison - South America
Data Table on Regional Comparison - South America

12.6.1 Brazil - Market size and forecast 2025-2030

Chart on Brazil - Market size and forecast 2025-2030 ($ million)
Data Table on Brazil - Market size and forecast 2025-2030 ($ million)
Chart on Brazil - Year-over-year growth 2025-2030 (%)
Data Table on Brazil - Year-over-year growth 2025-2030 (%)

12.6.2 Argentina - Market size and forecast 2025-2030

Chart on Argentina - Market size and forecast 2025-2030 ($ million)
Data Table on Argentina - Market size and forecast 2025-2030 ($ million)
Chart on Argentina - Year-over-year growth 2025-2030 (%)
Data Table on Argentina - Year-over-year growth 2025-2030 (%)

12.6.3 Chile - Market size and forecast 2025-2030

Chart on Chile - Market size and forecast 2025-2030 ($ million)
Data Table on Chile - Market size and forecast 2025-2030 ($ million)
Chart on Chile - Year-over-year growth 2025-2030 (%)
Data Table on Chile - Year-over-year growth 2025-2030 (%)

12.7 Middle East and Africa - Market size and forecast 2025-2030

Chart on Middle East and Africa - Market size and forecast 2025-2030 ($ million)
Data Table on Middle East and Africa - Market size and forecast 2025-2030 ($ million)
Chart on Middle East and Africa - Year-over-year growth 2025-2030 (%)
Data Table on Middle East and Africa - Year-over-year growth 2025-2030 (%)
Chart on Regional Comparison - Middle East and Africa
Data Table on Regional Comparison - Middle East and Africa

12.7.1 South Africa - Market size and forecast 2025-2030

Chart on South Africa - Market size and forecast 2025-2030 ($ million)
Data Table on South Africa - Market size and forecast 2025-2030 ($ million)
Chart on South Africa - Year-over-year growth 2025-2030 (%)
Data Table on South Africa - Year-over-year growth 2025-2030 (%)

12.7.2 Turkey - Market size and forecast 2025-2030

Chart on Turkey - Market size and forecast 2025-2030 ($ million)
Data Table on Turkey - Market size and forecast 2025-2030 ($ million)
Chart on Turkey - Year-over-year growth 2025-2030 (%)
Data Table on Turkey - Year-over-year growth 2025-2030 (%)

12.7.3 Saudi Arabia - Market size and forecast 2025-2030

Chart on Saudi Arabia - Market size and forecast 2025-2030 ($ million)
Data Table on Saudi Arabia - Market size and forecast 2025-2030 ($ million)
Chart on Saudi Arabia - Year-over-year growth 2025-2030 (%)
Data Table on Saudi Arabia - Year-over-year growth 2025-2030 (%)

12.7.4 Israel - Market size and forecast 2025-2030

Chart on Israel - Market size and forecast 2025-2030 ($ million)
Data Table on Israel - Market size and forecast 2025-2030 ($ million)
Chart on Israel - Year-over-year growth 2025-2030 (%)
Data Table on Israel - Year-over-year growth 2025-2030 (%)

12.7.5 UAE - Market size and forecast 2025-2030

Chart on UAE - Market size and forecast 2025-2030 ($ million)
Data Table on UAE - Market size and forecast 2025-2030 ($ million)
Chart on UAE - Year-over-year growth 2025-2030 (%)
Data Table on UAE - Year-over-year growth 2025-2030 (%)

12.8 Market opportunity by geography

Market opportunity by geography ($ million)
Data Tables on Market opportunity by geography ($ million)

13. Drivers, Challenges, and Opportunity

13.1 Market drivers

Increasing consumer spending on premium and ultra-premium whiskey
Growth of young legal-drinking demographics in emerging economies
Advanced digital marketing and e-commerce reshaping whiskey sales

13.2 Market challenges

Escalating geopolitical pressures and international tariff volatility
Surging production inefficiencies and supply chain packaging inflation
Shifting consumer demographics and rise of alternative spirits categories

13.3 Impact of drivers and challenges

Impact of drivers and challenges in 2025 and 2030

13.4 Market opportunities

Structural premiumization and shift toward high-value aged expressions
Product innovation via complex cask finishes and regional wood experimentation
Transformation of global whiskey supply chains through trade reforms

14. Competitive Landscape

14.1 Overview

14.2

Overview on criticality of inputs and factors of differentiation

14.3 Landscape disruption

Overview on factors of disruption

14.4 Industry risks

Impact of key risks on business

15. Competitive Analysis

15.1 Companies profiled

Companies covered

15.2 Company ranking index

15.3 Market positioning of companies

Matrix on companies position and classification

15.4 Allied Blenders and Distillers

Allied Blenders and Distillers - Overview
Allied Blenders and Distillers - Product / Service
Allied Blenders and Distillers - Key offerings
SWOT

15.5 Amrut Distilleries Pvt. Ltd.

Amrut Distilleries Pvt. Ltd. - Overview
Amrut Distilleries Pvt. Ltd. - Product / Service
Amrut Distilleries Pvt. Ltd. - Key offerings
SWOT

15.6 Asahi Group Holdings Ltd.

Asahi Group Holdings Ltd. - Overview
Asahi Group Holdings Ltd. - Business segments
Asahi Group Holdings Ltd. - Key offerings
Asahi Group Holdings Ltd. - Segment focus
SWOT

15.7 Bacardi and Co. Ltd.

Bacardi and Co. Ltd. - Overview
Bacardi and Co. Ltd. - Product / Service
Bacardi and Co. Ltd. - Key offerings
SWOT

15.8 Brown Forman Corp.

Brown Forman Corp. - Overview
Brown Forman Corp. - Business segments
Brown Forman Corp. - Key offerings
Brown Forman Corp. - Segment focus
SWOT

15.9 Campari Group

Campari Group - Overview
Campari Group - Business segments
Campari Group - Key offerings
Campari Group - Segment focus
SWOT

15.10 Constellation Brands Inc.

Constellation Brands Inc. - Overview
Constellation Brands Inc. - Business segments
Constellation Brands Inc. - Key offerings
Constellation Brands Inc. - Segment focus
SWOT

15.11 Diageo PLC

Diageo PLC - Overview
Diageo PLC - Business segments
Diageo PLC - Key offerings
Diageo PLC - Segment focus
SWOT

15.12 Emperador Inc.

Emperador Inc. - Overview
Emperador Inc. - Product / Service
Emperador Inc. - Key offerings
SWOT

15.13 Heaven Hill Distillery Inc.

Heaven Hill Distillery Inc. - Overview
Heaven Hill Distillery Inc. - Product / Service
Heaven Hill Distillery Inc. - Key offerings
SWOT

15.14 John Distilleries Pvt Ltd

John Distilleries Pvt Ltd - Overview
John Distilleries Pvt Ltd - Product / Service
John Distilleries Pvt Ltd - Key offerings
SWOT

15.15 Kirin Holdings Co. Ltd.

Kirin Holdings Co. Ltd. - Overview
Kirin Holdings Co. Ltd. - Business segments
Kirin Holdings Co. Ltd. - Key offerings
Kirin Holdings Co. Ltd. - Segment focus
SWOT

15.16 LVMH Moet Hennessy

LVMH Moet Hennessy - Overview
LVMH Moet Hennessy - Business segments
LVMH Moet Hennessy - Key offerings
LVMH Moet Hennessy - Segment focus
SWOT

15.17 The Coca Cola Co.

The Coca Cola Co. - Overview
The Coca Cola Co. - Business segments
The Coca Cola Co. - Key offerings
The Coca Cola Co. - Segment focus
SWOT

15.18 The Edrington Group Ltd.

The Edrington Group Ltd. - Overview
The Edrington Group Ltd. - Product / Service
The Edrington Group Ltd. - Key offerings
SWOT

16. Appendix

16.1 Scope of the report

Market definition
Objectives
Notes and caveats

16.2 Inclusions and exclusions checklist

Inclusions checklist
Exclusions checklist

16.3 Currency conversion rates for US$

16.4 Research methodology

16.5 Data procurement

Information sources

16.6 Data validation

16.7 Validation techniques employed for market sizing

16.8 Data synthesis

16.9 360 degree market analysis

16.10 List of abbreviations

Research Methodology

Technavio presents a detailed picture of the market by way of study, synthesis, and summation of data from multiple sources. The analysts have presented the various facets of the market with a particular focus on identifying the key industry influencers. The data thus presented is comprehensive, reliable, and the result of extensive research, both primary and secondary.

INFORMATION SOURCES

Primary sources

  • Manufacturers and suppliers
  • Channel partners
  • Industry experts
  • Strategic decision makers

Secondary sources

  • Industry journals and periodicals
  • Government data
  • Financial reports of key industry players
  • Historical data
  • Press releases

DATA ANALYSIS

Data Synthesis

  • Collation of data
  • Estimation of key figures
  • Analysis of derived insights

Data Validation

  • Triangulation with data models
  • Reference against proprietary databases
  • Corroboration with industry experts

REPORT WRITING

Qualitative

  • Market drivers
  • Market challenges
  • Market trends
  • Five forces analysis

Quantitative

  • Market size and forecast
  • Market segmentation
  • Geographical insights
  • Competitive landscape

Interested in this report?

Get your sample now to see our research methodology and insights!

Download Now

Frequently Asked Questions

Whiskey market growth will increase by USD 42756.4 million during 2026-2030.

The Whiskey market is expected to grow at a CAGR of 6.3% during 2026-2030.

Whiskey market is segmented by Distribution channel (Off trade, On trade) Product (Scotch whiskey, American whiskey, Canadian whiskey, Irish whiskey, Others) Type (Malt, Blended, Wheat, Rye, Others)

Allied Blenders and Distillers, Amrut Distilleries Pvt. Ltd., Asahi Group Holdings Ltd., Bacardi and Co. Ltd., Brown Forman Corp., Campari Group, Constellation Brands Inc., Diageo PLC, Emperador Inc., Heaven Hill Distillery Inc., John Distilleries Pvt Ltd, Kirin Holdings Co. Ltd., LVMH Moet Hennessy, Pernod Ricard SA, Proximo Spirits Inc., Radico Khaitan Ltd., Red Bull GmbH, Remy Cointreau SA, The Coca Cola Co., The Edrington Group Ltd. are a few of the key vendors in the Whiskey market.

APAC will register the highest growth rate of 47.5% among the other regions. Therefore, the Whiskey market in APAC is expected to garner significant business opportunities for the vendors during the forecast period.

India, China, Japan, South Korea, Australia, Thailand, US, Canada, Mexico, UK, France, Germany, Italy, Spain, The Netherlands, Brazil, Argentina, Chile, South Africa, Turkey, Saudi Arabia, Israel, UAE

  • Increasing consumer spending on premium and ultra-premium whiskey is the driving factor this market.

The Whiskey market vendors should focus on grabbing business opportunities from the Distribution channel segment as it accounted for the largest market share in the base year.
RIA - Research AI Assistant
Ask RIA