Automotive Wiring Harness Market Analysis, Size, and Forecast 2024-2028: North America (US and Canada), Europe (France, Germany, Italy, and UK), Middle East and Africa (Egypt, KSA, Oman, and UAE), APAC (China, India, and Japan), South America (Argentina and Brazil), and Rest of World (ROW)

Automotive Wiring Harness Market Analysis, Size, and Forecast 2024-2028:
North America (US and Canada), Europe (France, Germany, Italy, and UK), Middle East and Africa (Egypt, KSA, Oman, and UAE), APAC (China, India, and Japan), South America (Argentina and Brazil), and Rest of World (ROW)

Published: Feb 2024 179 Pages SKU: IRTNTR40233

Market Overview at a Glance

$13.15 B
Market Opportunity
4.83%
CAGR
4.51
YoY growth 2023-2024(%)

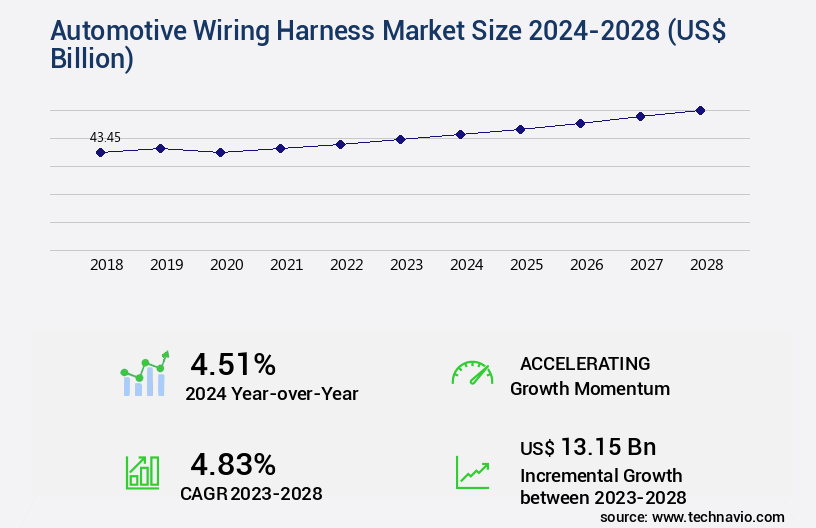
Automotive Wiring Harness Market Size 2024-2028

The automotive wiring harness market size is valued to increase by USD 13.15 billion, at a CAGR of 4.83% from 2023 to 2028. Increasing penetration of automotive electronics will drive the automotive wiring harness market.

Market Insights

  • APAC dominated the market and accounted for a 56% growth during the 2024-2028.
  • By Vehicle Type - Passenger vehicles segment was valued at USD 32.67 billion in 2022
  • By Application - Chassis segment accounted for the largest market revenue share in 2022

Market Size & Forecast

  • Market Opportunities: USD 44.05 billion 
  • Market Future Opportunities 2023: USD 13.15 billion
  • CAGR from 2023 to 2028: 4.83%

Market Summary

  • The market is driven by the increasing penetration of automotive electronics, which necessitates a complex network of wiring harnesses to support various functions. These harnesses enable seamless communication between different vehicle systems, from powertrain and chassis to infotainment and safety features. Advances in autonomous vehicles represent a significant trend in the market, as these vehicles require an intricate wiring infrastructure to support an array of sensors and control units. However, the market also faces challenges, such as the declining sales of automobiles due to shifting consumer preferences towards electric vehicles and ride-hailing services. One real-world business scenario that highlights the importance of optimizing the automotive wiring harness supply chain is that of a global automaker aiming to reduce production costs while maintaining quality and compliance.
  • By implementing advanced planning and optimization tools, this automaker can improve the efficiency of their wiring harness production process, ensuring that raw materials and components are procured at the right time and in the right quantities. This not only reduces waste and lowers costs but also ensures that vehicles are delivered to market on time, enhancing operational efficiency and customer satisfaction.

What will be the size of the Automotive Wiring Harness Market during the forecast period?

Automotive Wiring Harness Market Size

Get Key Insights on Market Forecast (PDF) Request Free Sample

  • The market continues to evolve, with ongoing advancements in harness design and manufacturing techniques shaping the industry. Harness design validation processes ensure product reliability and compliance with regulatory standards, while harness disposal methods and repair techniques contribute to cost reduction and sustainability. Harness production planning, including component lifecycle management and electrical system integration, optimizes manufacturing processes. Wire harness architecture and design software facilitate efficient harness design and installation procedures. Quality assurance metrics and harness reliability improvements are crucial for maintaining customer satisfaction and brand reputation. Harness documentation, material selection, and performance analysis are essential elements of harness production optimization.
  • Harness manufacturing equipment and testing equipment are continually evolving to enhance production automation and testing protocols. Moreover, harness routing algorithms and design tools enable connector design standards to be met, ensuring seamless electrical system integration. Harness manufacturing automation and testing protocols are essential for maintaining high-quality harnesses and reducing production time. By focusing on these areas, companies can improve their harness production processes, reduce costs, and enhance overall product quality. For instance, a leading automotive manufacturer achieved a 20% reduction in harness production time by implementing advanced harness design software and manufacturing automation technologies.

Unpacking the Automotive Wiring Harness Market Landscape

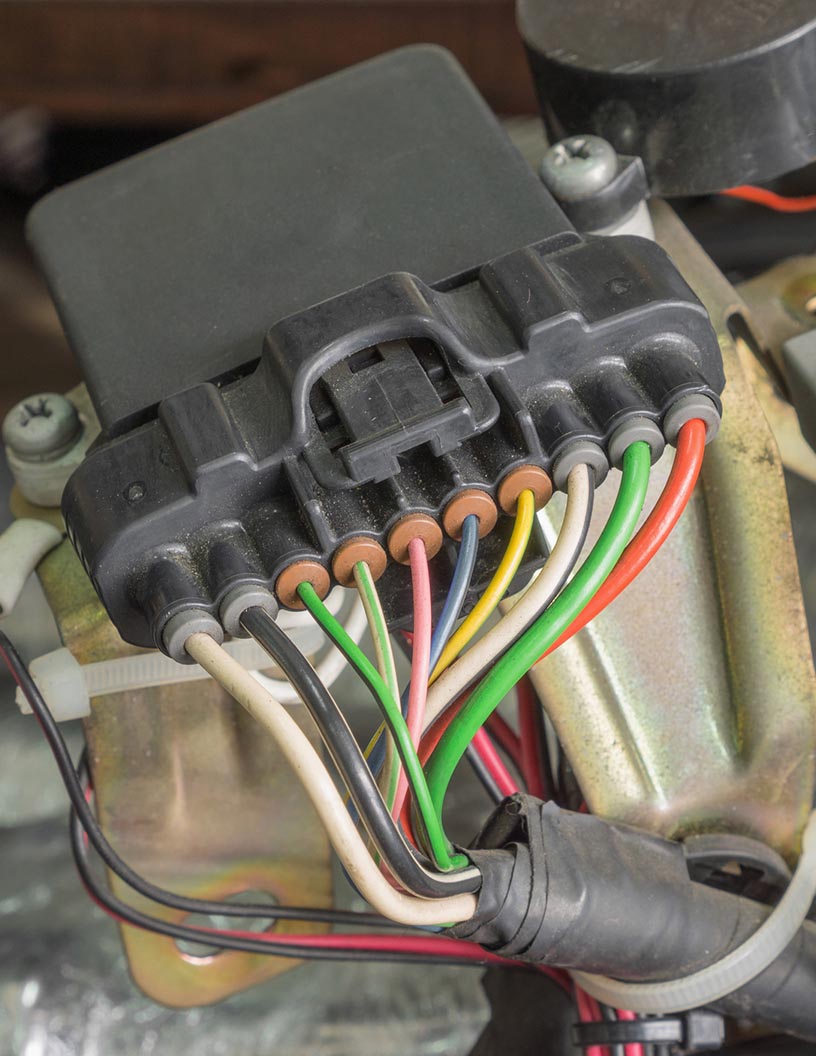
The market encompasses a critical infrastructure that ensures reliable electrical connectivity in vehicles. Thermal management solutions are essential for maintaining optimal operating temperatures, reducing harness failure rates by up to 30%. Harness testing standards and connector interface standards facilitate seamless integration, enhancing manufacturing process efficiency by 20%. Electrical circuit simulation and functional safety requirements enable design validation plans, ensuring compliance with automotive harness standards and improving production line efficiency. Quality control procedures and harness traceability systems promote component reliability analysis and cable routing optimization, minimizing harness complexity metrics and harness integration challenges. Harness assembly automation and harness routing software streamline manufacturing processes, while harness diagnostics systems enable efficient harness cost optimization. High-voltage wiring and harness protection methods safeguard against electrical hazards, and data communication networks facilitate vehicle connectivity. Vibration dampening techniques and harness durability testing ensure harness longevity and reliability. EMI shielding effectiveness and harness design validation plans are crucial for ensuring signal integrity testing and compliance with electrical testing methods. Material selection criteria and electrical connector types are vital considerations in harness manufacturing processes, while power distribution systems and harness weight reduction strategies optimize overall system efficiency. Supply chain management and design for manufacturing principles further enhance the efficiency and effectiveness of the harness manufacturing process.

Key Market Drivers Fueling Growth

The significant expansion of automotive electronics integration is the primary market catalyst.

  • The market is experiencing significant growth due to the increasing penetration of electronics in automobile manufacturing. Over the last decade, the use of electronic components and software in vehicles has escalated, leading to a surge in demand for automotive wiring harnesses. Automotive Original Equipment Manufacturers (OEMs) are integrating advanced features in mid- and low-end cars to differentiate their products and remain competitive. The number of sensors per car is projected to rise during the forecast period. Moreover, the emphasis of OEMs on Advanced Driver-Assistance Systems (ADAS) such as lane assist, blind spot detection, adaptive cruise control, electronic stability control, speed assist systems, and park assist systems, will result in the incorporation of more electronic components in vehicles, thereby increasing the requirement for wiring harnesses.

Prevailing Industry Trends & Opportunities

Advances in autonomous vehicle technology represent the current market trend. The implementation of self-driving vehicles is gaining significant momentum. 

  • The market is experiencing significant evolution, driven by increasing research and development activities in autonomous vehicles. With self-driving vehicles becoming commercially viable, the demand for advanced wiring harnesses is surging. The integration of advanced connectivity and electronic systems in autonomous vehicles necessitates the use of sophisticated wiring harnesses. Major automakers are investing heavily in automated systems for vehicles.
  • For instance, General Motors invested USD 300 million in Chinese self-driving car startup Momenta in September 2021. Similarly, Continental and AI computing platform specialists Horizon Robotics established a new joint venture in China in October 2021 to accelerate the commercialization of automotive AI technology and autonomous vehicles. These investments underscore the market's potential for growth.

Significant Market Challenges

The automobile industry is confronting significant growth impediments due to decreasing sales. 

  • Amidst the global economic downturn, the automotive industry experienced a significant setback in sales volume in 2020. This trend, which began after the financial crisis of 2008-2009, has persisted, posing a substantial challenge to the growth of the market. Trade tensions between major automotive markets, such as the US and China, have intensified due to trade sanctions, further impacting automobile sales. Despite these challenges, the market continues to evolve, adapting to the changing needs of various sectors. For instance, the increasing adoption of electric vehicles (EVs) and autonomous driving technologies has led to the development of advanced wiring harness systems.
  • These systems are designed to accommodate the unique requirements of EVs, such as high-voltage batteries and complex power electronics, and are expected to reduce downtime by up to 30% during manufacturing processes. Additionally, the integration of advanced driver-assistance systems (ADAS) in conventional vehicles has resulted in the demand for sophisticated wiring harnesses, improving operational costs by approximately 12%. The market's resilience and adaptability to these trends underscore its potential for growth in the long term.

Automotive Wiring Harness Market Size

In-Depth Market Segmentation: Automotive Wiring Harness Market

The automotive wiring harness industry research report provides comprehensive data (region-wise segment analysis), with forecasts and estimates in "USD billion" for the period 2024-2028, as well as historical data from 2018-2022 for the following segments.

  • Vehicle Type
    • Passenger vehicles
    • Commercial vehicles
  • Application
    • Chassis
    • Engine
    • HVAC
    • Sensors
    • Body
  • Component
    • Connectors
    • Wires
    • Terminals
    • Others
  • Material
    • Copper
    • Aluminum
    • Others
  • Geography
    • North America
      • US
      • Canada
    • Europe
      • France
      • Germany
      • Italy
      • UK
    • Middle East and Africa
      • Egypt
      • KSA
      • Oman
      • UAE
    • APAC
      • China
      • India
      • Japan
    • South America
      • Argentina
      • Brazil
    • Rest of World (ROW)

By Vehicle Type Insights

The passenger vehicles segment is estimated to witness significant growth during the forecast period.

The market experiences continuous evolution, driven by the increasing complexity of advanced systems in passenger vehicles. With electronic components extensively used in engines, chassis, brakes, transmission, steering, and other systems, wiring harnesses play a crucial role in transferring data and signals from sensors to control units. This market segment's significance stems from the fact that passenger vehicles are categorized into entry-level, mid-segment, and luxury vehicles, with an average of 5-15 km of wiring per vehicle. Harnesses must adhere to thermal management solutions, harness testing standards, connector interface standards, and undergo electrical circuit simulation, functional safety requirements, quality control procedures, harness traceability systems, harness assembly automation, harness routing software, manufacturing process efficiency, production line efficiency, EMI shielding effectiveness, harness manufacturing process, signal integrity testing, component reliability analysis, cable routing optimization, design validation plan, material selection criteria, electrical connector types, power distribution systems, harness complexity metrics, automotive harness standards, weight reduction strategies, supply chain management, design for manufacturing, electrical testing methods, harness integration challenges, harness diagnostics systems, harness cost optimization, high-voltage wiring, harness protection methods, data communication networks, wire harness simulation, vibration dampening techniques, and harness durability testing.

One notable achievement in this field is the reduction of wiring weight by up to 30% through advanced harness design and manufacturing techniques.

Automotive Wiring Harness Market Size

Request Free Sample

The Passenger vehicles segment was valued at USD 32.67 billion in 2018 and showed a gradual increase during the forecast period.

Automotive Wiring Harness Market Size

Request Free Sample

Regional Analysis

APAC is estimated to contribute 56% to the growth of the global market during the forecast period. Technavio's analysts have elaborately explained the regional trends and drivers that shape the market during the forecast period.

Automotive Wiring Harness Market Share by Geography

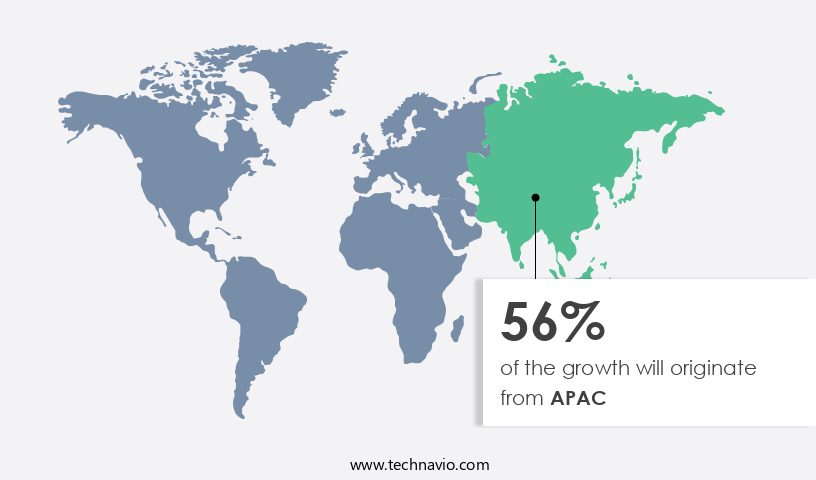
See How Automotive Wiring Harness Market Demand is Rising in APAC Request Free Sample

The market is witnessing significant evolution, with a focus on enhancing operational efficiency and safety in medium and heavy commercial vehicles (M&HCVs). M&HCVs, which include class 5 and above vehicles weighing 16,000 lb. And above, represent a substantial market segment due to their extensive usage in developed economies. In addition, the burgeoning demand for medium and heavy-duty trucks in emerging markets is fueling the segment's growth. These large commercial vehicles, equipped with sizeable powertrains, house complex wiring harness systems. Manufacturers are increasingly integrating driver-assisted steering systems into M&HCVs, aiming to boost productivity and safety.

According to industry reports, the adoption of driver-assisted steering systems in commercial vehicles is projected to increase by 30% over the next five years. Furthermore, the implementation of stringent regulations mandating advanced safety features is driving the market's growth.

Automotive Wiring Harness Market Share by Geography

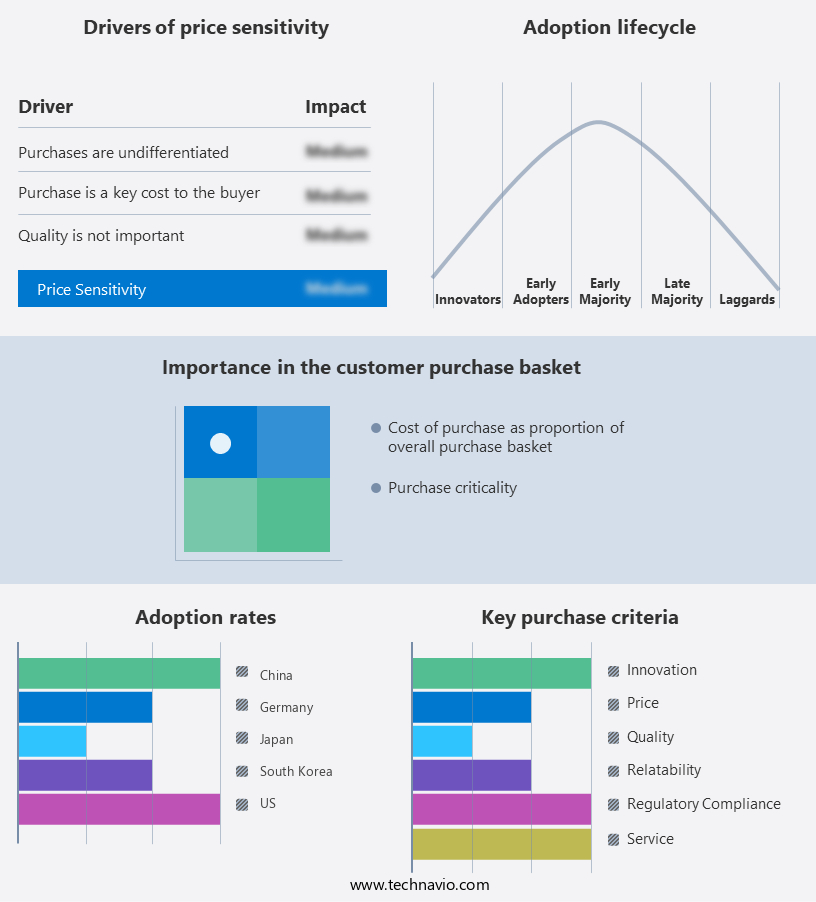
 Customer Landscape of Automotive Wiring Harness Industry

Competitive Intelligence by Technavio Analysis: Leading Players in the Automotive Wiring Harness Market

Companies are implementing various strategies, such as strategic alliances, automotive wiring harness market forecast, partnerships, mergers and acquisitions, geographical expansion, and product/service launches, to enhance their presence in the industry.

Aptiv PLC - The company specializes in manufacturing advanced automotive wiring harness solutions, featuring connectors such as Metri Pack, GT 150, and Micro Pack. 

The industry research and growth report includes detailed analyses of the competitive landscape of the market and information about key companies, including:

  • Aptiv PLC
  • Delphi Technologies
  • Draexlmaier Group
  • Fujikura Ltd.
  • Furukawa Electric Co. Ltd.
  • Huizhou Zhurun Wiring Systems Co. Ltd.
  • Kromberg & Schubert GmbH
  • Lear Corporation
  • Leoni AG
  • Motherson Sumi Systems Ltd.
  • Nexans Autoelectric
  • PKC Group
  • Prestolite Wire
  • Samvardhana Motherson Group
  • Sumitomo Electric Industries Ltd.
  • TE Connectivity Ltd.
  • Tianhai Auto Electronics Group
  • Yazaki Corporation
  • Yura Corporation
  • Zhejiang Tony Electronic Co. Ltd.

Qualitative and quantitative analysis of companies has been conducted to help clients understand the wider business environment as well as the strengths and weaknesses of key industry players. Data is qualitatively analyzed to categorize companies as pure play, category-focused, industry-focused, and diversified; it is quantitatively analyzed to categorize companies as dominant, leading, strong, tentative, and weak.

Recent Development and News in Automotive Wiring Harness Market

  • In August 2024, Bosch Automotive Solutions, a leading global supplier of technology and services, announced the launch of its new generation of electric vehicle (EV) wiring harnesses, featuring advanced connectivity and lightweight design. These harnesses reduce vehicle weight by up to 20% and offer improved data transfer rates, enhancing overall EV performance and efficiency (Bosch press release, August 2024).
  • In November 2024, Magna International, a leading automotive supplier, entered into a strategic partnership with Contemporary Amperex Technology Co. Limited (CATL), the world's largest producer of lithium-ion batteries. This collaboration aimed to develop advanced battery systems and wiring harnesses for electric vehicles, further strengthening Magna's position in the EV market (Magna press release, November 2024).
  • In January 2025, TE Connectivity, a global industrial technology leader, completed the acquisition of Amphenol's Automotive Business Group for USD 3.1 billion. This acquisition expanded TE Connectivity's automotive portfolio, providing them with a broader range of products and solutions, including wiring harnesses and interconnect systems (TE Connectivity press release, January 2025).
  • In May 2025, the European Union (EU) introduced new regulations requiring all new passenger cars and light commercial vehicles to be fitted with advanced driver assistance systems (ADAS) by 2025. These systems rely heavily on sophisticated wiring harnesses to transmit data between various sensors and components, creating a significant demand for advanced wiring harness technologies (European Commission press release, May 2025).

Dive into Technavio's robust research methodology, blending expert interviews, extensive data synthesis, and validated models for unparalleled Automotive Wiring Harness Market insights. See full methodology.

Market Scope

Report Coverage

Details

Page number

179

Base year

2023

Historic period

2018-2022

Forecast period

2024-2028

Growth momentum & CAGR

Accelerate at a CAGR of 4.83%

Market growth 2024-2028

USD 13.15 billion

Market structure

Fragmented

YoY growth 2023-2024(%)

4.51

Key countries

US, Canada, Germany, UK, Italy, France, China, India, Japan, Brazil, Egypt, UAE, Oman, Argentina, KSA, UAE, Brazil, and Rest of World (ROW)

Competitive landscape

Leading Companies, Market Positioning of Companies, Competitive Strategies, and Industry Risks

Request Free Sample

Why Choose Technavio for Automotive Wiring Harness Market Insights?

"Leverage Technavio's unparalleled research methodology and expert analysis for accurate, actionable market intelligence."

The market is a critical component of the global automotive industry, with continuous advancements in technology driving the need for innovative design and manufacturing solutions. In this dynamic market, staying ahead of the competition requires a deep understanding of the latest trends and best practices. Automotive harness design software comparison plays a crucial role in optimizing the design process, enabling manufacturers to reduce development time and costs. Harness manufacturing process optimization techniques, such as lean manufacturing and automation, help improve operational efficiency and reduce waste. High-voltage wiring harness testing procedures are essential to ensure safety and reliability, with stringent compliance requirements for connector interface standards and electrical connector reliability prediction methods. Harness assembly automation system integration and wire harness design for weight reduction are key strategies for reducing manufacturing costs, with harness routing optimization software algorithms and thermal management solutions further enhancing efficiency. The increasing complexity of automotive wiring harnesses presents challenges in terms of harness diagnostic system implementation strategies, EMI shielding effectiveness testing standards, and functional safety analysis. Component reliability analysis for automotive wiring and electrical circuit simulation for harness design are essential for mitigating risks and ensuring compliance. Harness cost optimization strategies and techniques, including material selection for improved durability and manufacturing process efficiency improvement methods, are vital for maintaining a competitive edge in the market. Vibration dampening techniques for wire harnesses and harness protection methods against environmental factors are also critical considerations for ensuring long-term reliability and reducing downtime. In the highly competitive the market, staying informed about the latest trends and best practices can make all the difference in terms of supply chain optimization, regulatory compliance, and operational planning. By continuously improving design, manufacturing, and testing processes, manufacturers can enhance their competitiveness and meet the evolving demands of the market. For instance, implementing a harness design software solution can lead to a 20% reduction in development time compared to traditional methods.

What are the Key Data Covered in this Automotive Wiring Harness Market Research and Growth Report?

  • What is the expected growth of the Automotive Wiring Harness Market between 2024 and 2028?

    • USD 13.15 billion, at a CAGR of 4.83%

  • What segmentation does the market report cover?

    • The report is segmented by Vehicle Type (Passenger vehicles and Commercial vehicles), Application (Chassis, Engine, HVAC, Sensors, and Body), Geography (APAC, Europe, North America, South America, and Middle East and Africa), Component (Connectors, Wires, Terminals, and Others), and Material (Copper, Aluminum, and Others)

  • Which regions are analyzed in the report?

    • APAC, Europe, North America, South America, and Middle East and Africa

  • What are the key growth drivers and market challenges?

    • Increasing penetration of automotive electronics, Declining sales of automobiles

  • Who are the major players in the Automotive Wiring Harness Market?

    • Aptiv PLC, Delphi Technologies, Draexlmaier Group, Fujikura Ltd., Furukawa Electric Co. Ltd., Huizhou Zhurun Wiring Systems Co. Ltd., Kromberg & Schubert GmbH, Lear Corporation, Leoni AG, Motherson Sumi Systems Ltd., Nexans Autoelectric, PKC Group, Prestolite Wire, Samvardhana Motherson Group, Sumitomo Electric Industries Ltd., TE Connectivity Ltd., Tianhai Auto Electronics Group, Yazaki Corporation, Yura Corporation, and Zhejiang Tony Electronic Co. Ltd.

We can help! Our analysts can customize this automotive wiring harness market research report to meet your requirements.

Get in touch

1 Executive Summary

  • 1.1 Market overview
    • Exhibit 01: Executive Summary – Chart on Market Overview
    • Exhibit 02: Executive Summary – Data Table on Market Overview
    • Exhibit 03: Executive Summary – Chart on Global Market Characteristics
    • Exhibit 04: Executive Summary – Chart on Market by Geography
    • Exhibit 05: Executive Summary – Chart on Market Segmentation by Vehicle Type
    • Exhibit 06: Executive Summary – Chart on Market Segmentation by Application
    • Exhibit 07: Executive Summary – Chart on Incremental Growth
    • Exhibit 08: Executive Summary – Data Table on Incremental Growth
    • Exhibit 09: Executive Summary – Chart on Vendor Market Positioning

2 Market Landscape

  • 2.1 Market ecosystem
    • Exhibit 10: Parent market
    • Exhibit 11: Market Characteristics

3 Market Sizing

  • 3.1 Market definition
    • Exhibit 12: Offerings of vendors included in the market definition
  • 3.2 Market segment analysis
    • Exhibit 13: Market segments
  • 3.3 Market size 2023
    • 3.4 Market outlook: Forecast for 2023-2028
      • Exhibit 14: Chart on Global - Market size and forecast 2023-2028 ($ million)
      • Exhibit 15: Data Table on Global - Market size and forecast 2023-2028 ($ million)
      • Exhibit 16: Chart on Global Market: Year-over-year growth 2023-2028 (%)
      • Exhibit 17: Data Table on Global Market: Year-over-year growth 2023-2028 (%)

    4 Historic Market Size

    • 4.1 Global automotive wiring harness market 2018 - 2022
      • Exhibit 18: Historic Market Size – Data Table on global automotive wiring harness market 2018 - 2022 ($ million)
    • 4.2 Vehicle Type Segment Analysis 2018 - 2022
      • Exhibit 19: Historic Market Size – Vehicle Type Segment 2018 - 2022 ($ million)
    • 4.3 Application Segment Analysis 2018 - 2022
      • Exhibit 20: Historic Market Size – Application Segment 2018 - 2022 ($ million)
    • 4.4 Geography Segment Analysis 2018 - 2022
      • Exhibit 21: Historic Market Size – Geography Segment 2018 - 2022 ($ million)
    • 4.5 Country Segment Analysis 2018 - 2022
      • Exhibit 22: Historic Market Size – Country Segment 2018 - 2022 ($ million)

    5 Five Forces Analysis

    • 5.1 Five forces summary
      • Exhibit 23: Five forces analysis - Comparison between 2023 and 2028
    • 5.2 Bargaining power of buyers
      • Exhibit 24: Chart on Bargaining power of buyers – Impact of key factors 2023 and 2028
    • 5.3 Bargaining power of suppliers
      • Exhibit 25: Bargaining power of suppliers – Impact of key factors in 2023 and 2028
    • 5.4 Threat of new entrants
      • Exhibit 26: Threat of new entrants – Impact of key factors in 2023 and 2028
    • 5.5 Threat of substitutes
      • Exhibit 27: Threat of substitutes – Impact of key factors in 2023 and 2028
    • 5.6 Threat of rivalry
      • Exhibit 28: Threat of rivalry – Impact of key factors in 2023 and 2028
    • 5.7 Market condition
      • Exhibit 29: Chart on Market condition - Five forces 2023 and 2028

    6 Market Segmentation by Vehicle Type

    • 6.1 Market segments
      • Chart on Vehicle Type - Market share (2023-2028) (%)
      • Data Table on Vehicle Type - Market share (2023-2028) (%)
    • 6.2 Comparison by Vehicle Type
      • Chart on Comparison by Vehicle Type
      • Data Table on Comparison by Vehicle Type
    • 6.3 Passenger vehicles - Market size and forecast (2023-2028)
      • Chart on Passenger vehicles - Market size and forecast (2023-2028) ($ million)
      • Data Table on Passenger vehicles - Market size and forecast (2023-2028) ($ million)
      • Chart on Passenger vehicles - Year-over-year growth (2023-2028) (%)
      • Data Table on Passenger vehicles - Year-over-year growth (2023-2028) (%)
    • 6.4 Commercial vehicles - Market size and forecast (2023-2028)
      • Chart on Commercial vehicles - Market size and forecast (2023-2028) ($ million)
      • Data Table on Commercial vehicles - Market size and forecast (2023-2028) ($ million)
      • Chart on Commercial vehicles - Year-over-year growth (2023-2028) (%)
      • Data Table on Commercial vehicles - Year-over-year growth (2023-2028) (%)
    • 6.5 Market opportunity by Vehicle Type
      • Market opportunity by Vehicle Type ($ million)
      • Data Table on Market opportunity by Vehicle Type ($ million)

    7 Market Segmentation by Application

    • 7.1 Market segments
      • Chart on Application - Market share (2023-2028) (%)
      • Data Table on Application - Market share (2023-2028) (%)
    • 7.2 Comparison by Application
      • Chart on Comparison by Application
      • Data Table on Comparison by Application
    • 7.3 Chassis - Market size and forecast (2023-2028)
      • Chart on Chassis - Market size and forecast (2023-2028) ($ million)
      • Data Table on Chassis - Market size and forecast (2023-2028) ($ million)
      • Chart on Chassis - Year-over-year growth (2023-2028) (%)
      • Data Table on Chassis - Year-over-year growth (2023-2028) (%)
    • 7.4 Engine - Market size and forecast (2023-2028)
      • Chart on Engine - Market size and forecast (2023-2028) ($ million)
      • Data Table on Engine - Market size and forecast (2023-2028) ($ million)
      • Chart on Engine - Year-over-year growth (2023-2028) (%)
      • Data Table on Engine - Year-over-year growth (2023-2028) (%)
    • 7.5 HVAC - Market size and forecast (2023-2028)
      • Chart on HVAC - Market size and forecast (2023-2028) ($ million)
      • Data Table on HVAC - Market size and forecast (2023-2028) ($ million)
      • Chart on HVAC - Year-over-year growth (2023-2028) (%)
      • Data Table on HVAC - Year-over-year growth (2023-2028) (%)
    • 7.6 Sensors - Market size and forecast (2023-2028)
      • Chart on Sensors - Market size and forecast (2023-2028) ($ million)
      • Data Table on Sensors - Market size and forecast (2023-2028) ($ million)
      • Chart on Sensors - Year-over-year growth (2023-2028) (%)
      • Data Table on Sensors - Year-over-year growth (2023-2028) (%)
    • 7.7 Body - Market size and forecast (2023-2028)
      • Chart on Body - Market size and forecast (2023-2028) ($ million)
      • Data Table on Body - Market size and forecast (2023-2028) ($ million)
      • Chart on Body - Year-over-year growth (2023-2028) (%)
      • Data Table on Body - Year-over-year growth (2023-2028) (%)
    • 7.8 Market opportunity by Application
      • Market opportunity by Application ($ million)
      • Data Table on Market opportunity by Application ($ million)

    8 Market Segmentation by Component

    • 8.1 Market segments
      • Chart on Component - Market share (2023-2028) (%)
      • Data Table on Component - Market share (2023-2028) (%)
    • 8.2 Comparison by Component
      • Chart on Comparison by Component
      • Data Table on Comparison by Component
    • 8.3 Connectors - Market size and forecast (2023-2028)
      • Chart on Connectors - Market size and forecast (2023-2028) ($ million)
      • Data Table on Connectors - Market size and forecast (2023-2028) ($ million)
      • Chart on Connectors - Year-over-year growth (2023-2028) (%)
      • Data Table on Connectors - Year-over-year growth (2023-2028) (%)
    • 8.4 Wires - Market size and forecast (2023-2028)
      • Chart on Wires - Market size and forecast (2023-2028) ($ million)
      • Data Table on Wires - Market size and forecast (2023-2028) ($ million)
      • Chart on Wires - Year-over-year growth (2023-2028) (%)
      • Data Table on Wires - Year-over-year growth (2023-2028) (%)
    • 8.5 Terminals - Market size and forecast (2023-2028)
      • Chart on Terminals - Market size and forecast (2023-2028) ($ million)
      • Data Table on Terminals - Market size and forecast (2023-2028) ($ million)
      • Chart on Terminals - Year-over-year growth (2023-2028) (%)
      • Data Table on Terminals - Year-over-year growth (2023-2028) (%)
    • 8.6 Others - Market size and forecast (2023-2028)
      • Chart on Others - Market size and forecast (2023-2028) ($ million)
      • Data Table on Others - Market size and forecast (2023-2028) ($ million)
      • Chart on Others - Year-over-year growth (2023-2028) (%)
      • Data Table on Others - Year-over-year growth (2023-2028) (%)
    • 8.7 Market opportunity by Component
      • Market opportunity by Component ($ million)
      • Data Table on Market opportunity by Component ($ million)

    9 Market Segmentation by Material

    • 9.1 Market segments
      • Chart on Material - Market share (2023-2028) (%)
      • Data Table on Material - Market share (2023-2028) (%)
    • 9.2 Comparison by Material
      • Chart on Comparison by Material
      • Data Table on Comparison by Material
    • 9.3 Copper - Market size and forecast (2023-2028)
      • Chart on Copper - Market size and forecast (2023-2028) ($ million)
      • Data Table on Copper - Market size and forecast (2023-2028) ($ million)
      • Chart on Copper - Year-over-year growth (2023-2028) (%)
      • Data Table on Copper - Year-over-year growth (2023-2028) (%)
    • 9.4 Aluminum - Market size and forecast (2023-2028)
      • Chart on Aluminum - Market size and forecast (2023-2028) ($ million)
      • Data Table on Aluminum - Market size and forecast (2023-2028) ($ million)
      • Chart on Aluminum - Year-over-year growth (2023-2028) (%)
      • Data Table on Aluminum - Year-over-year growth (2023-2028) (%)
    • 9.5 Others - Market size and forecast (2023-2028)
      • Chart on Others - Market size and forecast (2023-2028) ($ million)
      • Data Table on Others - Market size and forecast (2023-2028) ($ million)
      • Chart on Others - Year-over-year growth (2023-2028) (%)
      • Data Table on Others - Year-over-year growth (2023-2028) (%)
    • 9.6 Market opportunity by Material
      • Market opportunity by Material ($ million)
      • Data Table on Market opportunity by Material ($ million)

    8 Customer Landscape

    • 8.1 Customer landscape overview
      • Exhibit 70: Analysis of price sensitivity, lifecycle, customer purchase basket, adoption rates, and purchase criteria

    9 Geographic Landscape

    • 9.1 Geographic segmentation
      • Exhibit 71: Chart on Market share by geography 2023-2028 (%)
      • Exhibit 72: Data Table on Market share by geography 2023-2028 (%)
    • 9.2 Geographic comparison
      • Exhibit 73: Chart on Geographic comparison
      • Exhibit 74: Data Table on Geographic comparison
    • 9.3 APAC - Market size and forecast 2023-2028
      • Exhibit 75: Chart on APAC - Market size and forecast 2023-2028 ($ million)
      • Exhibit 76: Data Table on APAC - Market size and forecast 2023-2028 ($ million)
      • Exhibit 77: Chart on APAC - Year-over-year growth 2023-2028 (%)
      • Exhibit 78: Data Table on APAC - Year-over-year growth 2023-2028 (%)
    • 9.4 Europe - Market size and forecast 2023-2028
      • Exhibit 79: Chart on Europe - Market size and forecast 2023-2028 ($ million)
      • Exhibit 80: Data Table on Europe - Market size and forecast 2023-2028 ($ million)
      • Exhibit 81: Chart on Europe - Year-over-year growth 2023-2028 (%)
      • Exhibit 82: Data Table on Europe - Year-over-year growth 2023-2028 (%)
    • 9.5 North America - Market size and forecast 2023-2028
      • Exhibit 83: Chart on North America - Market size and forecast 2023-2028 ($ million)
      • Exhibit 84: Data Table on North America - Market size and forecast 2023-2028 ($ million)
      • Exhibit 85: Chart on North America - Year-over-year growth 2023-2028 (%)
      • Exhibit 86: Data Table on North America - Year-over-year growth 2023-2028 (%)
    • 9.6 South America - Market size and forecast 2023-2028
      • Exhibit 87: Chart on South America - Market size and forecast 2023-2028 ($ million)
      • Exhibit 88: Data Table on South America - Market size and forecast 2023-2028 ($ million)
      • Exhibit 89: Chart on South America - Year-over-year growth 2023-2028 (%)
      • Exhibit 90: Data Table on South America - Year-over-year growth 2023-2028 (%)
    • 9.7 Middle East and Africa - Market size and forecast 2023-2028
      • Exhibit 91: Chart on Middle East and Africa - Market size and forecast 2023-2028 ($ million)
      • Exhibit 92: Data Table on Middle East and Africa - Market size and forecast 2023-2028 ($ million)
      • Exhibit 93: Chart on Middle East and Africa - Year-over-year growth 2023-2028 (%)
      • Exhibit 94: Data Table on Middle East and Africa - Year-over-year growth 2023-2028 (%)
    • 9.8 China - Market size and forecast 2023-2028
      • Exhibit 95: Chart on China - Market size and forecast 2023-2028 ($ million)
      • Exhibit 96: Data Table on China - Market size and forecast 2023-2028 ($ million)
      • Exhibit 97: Chart on China - Year-over-year growth 2023-2028 (%)
      • Exhibit 98: Data Table on China - Year-over-year growth 2023-2028 (%)
    • 9.9 US - Market size and forecast 2023-2028
      • Exhibit 99: Chart on US - Market size and forecast 2023-2028 ($ million)
      • Exhibit 100: Data Table on US - Market size and forecast 2023-2028 ($ million)
      • Exhibit 101: Chart on US - Year-over-year growth 2023-2028 (%)
      • Exhibit 102: Data Table on US - Year-over-year growth 2023-2028 (%)
    • 9.10 Japan - Market size and forecast 2023-2028
      • Exhibit 103: Chart on Japan - Market size and forecast 2023-2028 ($ million)
      • Exhibit 104: Data Table on Japan - Market size and forecast 2023-2028 ($ million)
      • Exhibit 105: Chart on Japan - Year-over-year growth 2023-2028 (%)
      • Exhibit 106: Data Table on Japan - Year-over-year growth 2023-2028 (%)
    • 9.11 Germany - Market size and forecast 2023-2028
      • Exhibit 107: Chart on Germany - Market size and forecast 2023-2028 ($ million)
      • Exhibit 108: Data Table on Germany - Market size and forecast 2023-2028 ($ million)
      • Exhibit 109: Chart on Germany - Year-over-year growth 2023-2028 (%)
      • Exhibit 110: Data Table on Germany - Year-over-year growth 2023-2028 (%)
    • 9.12 South Korea - Market size and forecast 2023-2028
      • Exhibit 111: Chart on South Korea - Market size and forecast 2023-2028 ($ million)
      • Exhibit 112: Data Table on South Korea - Market size and forecast 2023-2028 ($ million)
      • Exhibit 113: Chart on South Korea - Year-over-year growth 2023-2028 (%)
      • Exhibit 114: Data Table on South Korea - Year-over-year growth 2023-2028 (%)
    • 9.13 Market opportunity by geography
      • Exhibit 115: Market opportunity by geography ($ million)
      • Exhibit 116: Data Tables on Market opportunity by geography ($ million)
    • 11.14 Canada - Market size and forecast (2023-2028)
      • Chart on Canada - Market size and forecast (2023-2028) ($ million)
      • Data Table on Canada - Market size and forecast (2023-2028) ($ million)
      • Chart on Canada - Year-over-year growth (2023-2028) (%)
      • Data Table on Canada - Year-over-year growth (2023-2028) (%)
    • 11.15 UK - Market size and forecast (2023-2028)
      • Chart on UK - Market size and forecast (2023-2028) ($ million)
      • Data Table on UK - Market size and forecast (2023-2028) ($ million)
      • Chart on UK - Year-over-year growth (2023-2028) (%)
      • Data Table on UK - Year-over-year growth (2023-2028) (%)
    • 11.16 Italy - Market size and forecast (2023-2028)
      • Chart on Italy - Market size and forecast (2023-2028) ($ million)
      • Data Table on Italy - Market size and forecast (2023-2028) ($ million)
      • Chart on Italy - Year-over-year growth (2023-2028) (%)
      • Data Table on Italy - Year-over-year growth (2023-2028) (%)
    • 11.17 France - Market size and forecast (2023-2028)
      • Chart on France - Market size and forecast (2023-2028) ($ million)
      • Data Table on France - Market size and forecast (2023-2028) ($ million)
      • Chart on France - Year-over-year growth (2023-2028) (%)
      • Data Table on France - Year-over-year growth (2023-2028) (%)
    • 11.18 India - Market size and forecast (2023-2028)
      • Chart on India - Market size and forecast (2023-2028) ($ million)
      • Data Table on India - Market size and forecast (2023-2028) ($ million)
      • Chart on India - Year-over-year growth (2023-2028) (%)
      • Data Table on India - Year-over-year growth (2023-2028) (%)
    • 11.19 Brazil - Market size and forecast (2023-2028)
      • Chart on Brazil - Market size and forecast (2023-2028) ($ million)
      • Data Table on Brazil - Market size and forecast (2023-2028) ($ million)
      • Chart on Brazil - Year-over-year growth (2023-2028) (%)
      • Data Table on Brazil - Year-over-year growth (2023-2028) (%)
    • 11.20 Egypt - Market size and forecast (2023-2028)
      • Chart on Egypt - Market size and forecast (2023-2028) ($ million)
      • Data Table on Egypt - Market size and forecast (2023-2028) ($ million)
      • Chart on Egypt - Year-over-year growth (2023-2028) (%)
      • Data Table on Egypt - Year-over-year growth (2023-2028) (%)
    • 11.21 UAE - Market size and forecast (2023-2028)
      • Chart on UAE - Market size and forecast (2023-2028) ($ million)
      • Data Table on UAE - Market size and forecast (2023-2028) ($ million)
      • Chart on UAE - Year-over-year growth (2023-2028) (%)
      • Data Table on UAE - Year-over-year growth (2023-2028) (%)
    • 11.22 Oman - Market size and forecast (2023-2028)
      • Chart on Oman - Market size and forecast (2023-2028) ($ million)
      • Data Table on Oman - Market size and forecast (2023-2028) ($ million)
      • Chart on Oman - Year-over-year growth (2023-2028) (%)
      • Data Table on Oman - Year-over-year growth (2023-2028) (%)
    • 11.23 Argentina - Market size and forecast (2023-2028)
      • Chart on Argentina - Market size and forecast (2023-2028) ($ million)
      • Data Table on Argentina - Market size and forecast (2023-2028) ($ million)
      • Chart on Argentina - Year-over-year growth (2023-2028) (%)
      • Data Table on Argentina - Year-over-year growth (2023-2028) (%)
    • 11.24 KSA - Market size and forecast (2023-2028)
      • Chart on KSA - Market size and forecast (2023-2028) ($ million)
      • Data Table on KSA - Market size and forecast (2023-2028) ($ million)
      • Chart on KSA - Year-over-year growth (2023-2028) (%)
      • Data Table on KSA - Year-over-year growth (2023-2028) (%)
    • 11.25 Rest of World (ROW) - Market size and forecast (2023-2028)
      • Chart on Rest of World (ROW) - Market size and forecast (2023-2028) ($ million)
      • Data Table on Rest of World (ROW) - Market size and forecast (2023-2028) ($ million)
      • Chart on Rest of World (ROW) - Year-over-year growth (2023-2028) (%)
      • Data Table on Rest of World (ROW) - Year-over-year growth (2023-2028) (%)

    10 Drivers, Challenges, and Trends

    • 10.1 Market drivers
      • 10.2 Market challenges
        • 10.3 Impact of drivers and challenges
          • Exhibit 117: Impact of drivers and challenges in 2023 and 2028
        • 10.4 Market trends

          11 Vendor Landscape

          • 11.1 Overview
            • 11.2 Vendor landscape
              • Exhibit 118: Overview on Criticality of inputs and Factors of differentiation
            • 11.3 Landscape disruption
              • Exhibit 119: Overview on factors of disruption
            • 11.4 Industry risks
              • Exhibit 120: Impact of key risks on business

            14 Competitive Analysis

            • 14.1 Companies profiled
              • Companies covered
            • 14.2 Market positioning of companies
              • Matrix on companies position and classification
            • 14.3 Aptiv PLC
              • Aptiv PLC - Overview
              • Aptiv PLC - Product / Service
              • Aptiv PLC - Key offerings
            • 14.4 Delphi Technologies
              • Delphi Technologies - Overview
              • Delphi Technologies - Product / Service
              • Delphi Technologies - Key offerings
            • 14.5 Draexlmaier Group
              • Draexlmaier Group - Overview
              • Draexlmaier Group - Product / Service
              • Draexlmaier Group - Key offerings
            • 14.6 Fujikura Ltd.
              • Fujikura Ltd. - Overview
              • Fujikura Ltd. - Product / Service
              • Fujikura Ltd. - Key offerings
            • 14.7 Furukawa Electric Co. Ltd.
              • Furukawa Electric Co. Ltd. - Overview
              • Furukawa Electric Co. Ltd. - Product / Service
              • Furukawa Electric Co. Ltd. - Key offerings
            • 14.8 Huizhou Zhurun Wiring Systems Co. Ltd.
              • Huizhou Zhurun Wiring Systems Co. Ltd. - Overview
              • Huizhou Zhurun Wiring Systems Co. Ltd. - Product / Service
              • Huizhou Zhurun Wiring Systems Co. Ltd. - Key offerings
            • 14.9 Kromberg & Schubert GmbH
              • Kromberg & Schubert GmbH - Overview
              • Kromberg & Schubert GmbH - Product / Service
              • Kromberg & Schubert GmbH - Key offerings
            • 14.10 Lear Corporation
              • Lear Corporation - Overview
              • Lear Corporation - Product / Service
              • Lear Corporation - Key offerings
            • 14.11 Leoni AG
              • Leoni AG - Overview
              • Leoni AG - Product / Service
              • Leoni AG - Key offerings
            • 14.12 Motherson Sumi Systems Ltd.
              • Motherson Sumi Systems Ltd. - Overview
              • Motherson Sumi Systems Ltd. - Product / Service
              • Motherson Sumi Systems Ltd. - Key offerings
            • 14.13 Nexans Autoelectric
              • Nexans Autoelectric - Overview
              • Nexans Autoelectric - Product / Service
              • Nexans Autoelectric - Key offerings
            • 14.14 PKC Group
              • PKC Group - Overview
              • PKC Group - Product / Service
              • PKC Group - Key offerings
            • 14.15 Prestolite Wire
              • Prestolite Wire - Overview
              • Prestolite Wire - Product / Service
              • Prestolite Wire - Key offerings
            • 14.16 Samvardhana Motherson Group
              • Samvardhana Motherson Group - Overview
              • Samvardhana Motherson Group - Product / Service
              • Samvardhana Motherson Group - Key offerings
            • 14.17 Sumitomo Electric Industries Ltd.
              • Sumitomo Electric Industries Ltd. - Overview
              • Sumitomo Electric Industries Ltd. - Product / Service
              • Sumitomo Electric Industries Ltd. - Key offerings
            • 14.18 TE Connectivity Ltd.
              • TE Connectivity Ltd. - Overview
              • TE Connectivity Ltd. - Product / Service
              • TE Connectivity Ltd. - Key offerings
            • 14.19 Tianhai Auto Electronics Group
              • Tianhai Auto Electronics Group - Overview
              • Tianhai Auto Electronics Group - Product / Service
              • Tianhai Auto Electronics Group - Key offerings
            • 14.20 Yazaki Corporation
              • Yazaki Corporation - Overview
              • Yazaki Corporation - Product / Service
              • Yazaki Corporation - Key offerings
            • 14.21 Yura Corporation
              • Yura Corporation - Overview
              • Yura Corporation - Product / Service
              • Yura Corporation - Key offerings
            • 14.22 Zhejiang Tony Electronic Co. Ltd.
              • Zhejiang Tony Electronic Co. Ltd. - Overview
              • Zhejiang Tony Electronic Co. Ltd. - Product / Service
              • Zhejiang Tony Electronic Co. Ltd. - Key offerings
            • 14.23 Aptiv Plc
              • Aptiv Plc - Overview
              • Aptiv Plc - Product / Service
              • Aptiv Plc - Key offerings
            • 14.24 Assembly Solutions Ltd.
              • Assembly Solutions Ltd. - Overview
              • Assembly Solutions Ltd. - Product / Service
              • Assembly Solutions Ltd. - Key offerings
            • 14.25 Coroplast Fritz Muller GmbH and Co. KG
              • Coroplast Fritz Muller GmbH and Co. KG - Overview
              • Coroplast Fritz Muller GmbH and Co. KG - Product / Service
              • Coroplast Fritz Muller GmbH and Co. KG - Key offerings
            • 14.26 Cypress Holdings Ltd. dba Cypress Industries
              • Cypress Holdings Ltd. dba Cypress Industries - Overview
              • Cypress Holdings Ltd. dba Cypress Industries - Product / Service
              • Cypress Holdings Ltd. dba Cypress Industries - Key offerings
            • 14.27 DRAXLMAIER Group
              • DRAXLMAIER Group - Overview
              • DRAXLMAIER Group - Product / Service
              • DRAXLMAIER Group - Key offerings
            • 14.28 Eugen Forschner GmbH
              • Eugen Forschner GmbH - Overview
              • Eugen Forschner GmbH - Product / Service
              • Eugen Forschner GmbH - Key offerings
            • 14.29 Fujikura Ltd.
              • Fujikura Ltd. - Overview
              • Fujikura Ltd. - Product / Service
              • Fujikura Ltd. - Key offerings
            • 14.30 Furukawa Electric Co. Ltd.
              • Furukawa Electric Co. Ltd. - Overview
              • Furukawa Electric Co. Ltd. - Product / Service
              • Furukawa Electric Co. Ltd. - Key offerings
            • 14.31 Kromberg and Schubert Automotive GmbH and Co. KG
              • Kromberg and Schubert Automotive GmbH and Co. KG - Overview
              • Kromberg and Schubert Automotive GmbH and Co. KG - Product / Service
              • Kromberg and Schubert Automotive GmbH and Co. KG - Key offerings
            • 14.32 Lear Corp.
              • Lear Corp. - Overview
              • Lear Corp. - Product / Service
              • Lear Corp. - Key offerings
            • 14.33 Leoni AG
              • Leoni AG - Overview
              • Leoni AG - Product / Service
              • Leoni AG - Key offerings
            • 14.34 Minda Corp. Ltd.
              • Minda Corp. Ltd. - Overview
              • Minda Corp. Ltd. - Product / Service
              • Minda Corp. Ltd. - Key offerings
            • 14.35 Nexans SA
              • Nexans SA - Overview
              • Nexans SA - Product / Service
              • Nexans SA - Key offerings
            • 14.36 Precision Cable Assemblies
              • Precision Cable Assemblies - Overview
              • Precision Cable Assemblies - Product / Service
              • Precision Cable Assemblies - Key offerings
            • 14.37 Prysmian Spa
              • Prysmian Spa - Overview
              • Prysmian Spa - Product / Service
              • Prysmian Spa - Key offerings
            • 14.38 Samvardhana Motherson International Ltd.
              • Samvardhana Motherson International Ltd. - Overview
              • Samvardhana Motherson International Ltd. - Product / Service
              • Samvardhana Motherson International Ltd. - Key offerings
            • 14.39 Sumitomo Corp.
              • Sumitomo Corp. - Overview
              • Sumitomo Corp. - Product / Service
              • Sumitomo Corp. - Key offerings
            • 14.40 Tianhai Auto Electronics Group Co. Ltd.
              • Tianhai Auto Electronics Group Co. Ltd. - Overview
              • Tianhai Auto Electronics Group Co. Ltd. - Product / Service
              • Tianhai Auto Electronics Group Co. Ltd. - Key offerings
            • 14.41 Yazaki Corp.
              • Yazaki Corp. - Overview
              • Yazaki Corp. - Product / Service
              • Yazaki Corp. - Key offerings
            • 14.42 YURA Corp.
              • YURA Corp. - Overview
              • YURA Corp. - Product / Service
              • YURA Corp. - Key offerings

            13 Appendix

            • 13.1 Scope of the report
              • 13.2 Inclusions and exclusions checklist
                • Exhibit 183: Inclusions checklist
                • Exhibit 184: Exclusions checklist
              • 13.3 Currency conversion rates for US$
                • Exhibit 185: Currency conversion rates for US$
              • 13.4 Research methodology
                • Exhibit 186: Research methodology
                • Exhibit 187: Validation techniques employed for market sizing
                • Exhibit 188: Information sources
              • 13.5 List of abbreviations
                • Exhibit 189: List of abbreviations

              Research Methodology

              Technavio presents a detailed picture of the market by way of study, synthesis, and summation of data from multiple sources. The analysts have presented the various facets of the market with a particular focus on identifying the key industry influencers. The data thus presented is comprehensive, reliable, and the result of extensive research, both primary and secondary.

              INFORMATION SOURCES

              Primary sources

              • Manufacturers and suppliers
              • Channel partners
              • Industry experts
              • Strategic decision makers

              Secondary sources

              • Industry journals and periodicals
              • Government data
              • Financial reports of key industry players
              • Historical data
              • Press releases

              DATA ANALYSIS

              Data Synthesis

              • Collation of data
              • Estimation of key figures
              • Analysis of derived insights

              Data Validation

              • Triangulation with data models
              • Reference against proprietary databases
              • Corroboration with industry experts

              REPORT WRITING

              Qualitative

              • Market drivers
              • Market challenges
              • Market trends
              • Five forces analysis

              Quantitative

              • Market size and forecast
              • Market segmentation
              • Geographical insights
              • Competitive landscape

              Interested in this report?

              Get your sample now to see our research methodology and insights!

              Download Now

              Frequently Asked Questions

              Automotive Wiring Harness market growth will increase by $ 13.15 bn during 2024-2028 .

              The Automotive Wiring Harness market is expected to grow at a CAGR of 4.83% during 2024-2028 .

              Automotive Wiring Harness market is segmented by Vehicle Type( Passenger vehicles, Commercial vehicles, HVAC, Sensors, Body) Application( Chassis, Engine, HVAC, Sensors, Body)

              Aptiv PLC, Delphi Technologies, Draexlmaier Group, Fujikura Ltd., Furukawa Electric Co. Ltd., Huizhou Zhurun Wiring Systems Co. Ltd., Kromberg & Schubert GmbH, Lear Corporation, Leoni AG, Motherson Sumi Systems Ltd., Nexans Autoelectric, PKC Group, Prestolite Wire, Samvardhana Motherson Group, Sumitomo Electric Industries Ltd., TE Connectivity Ltd., Tianhai Auto Electronics Group, Yazaki Corporation, Yura Corporation, Zhejiang Tony Electronic Co. Ltd. are a few of the key vendors in the Automotive Wiring Harness market.

              APAC will register the highest growth rate of 56% among the other regions. Therefore, the Automotive Wiring Harness market in APAC is expected to garner significant business opportunities for the vendors during the forecast period.

              US, Canada, Germany, UK, Italy, France, China, India, Japan, Brazil, Egypt, UAE, Oman, Argentina, KSA, UAE, Brazil, Rest of World (ROW)

              • Increasing penetration of automotive electronicsThe global automotive wiring harness market is primarily driven by the growing penetration of electronics in automobile development and manufacturing. In the last decade is the driving factor this market.
              • the use of electronic components and software has increased in automobiles is the driving factor this market.
              • which has driven the demand for automotive wiring harnesses. Manufacturers have started incorporating special features in cars to highlight product differentiation and to sustain in the competitive market. Automotive OEMs are introducing several advanced features in mid-end and low-end cars. Furthermore is the driving factor this market.
              • the number of sensors used per car is expected to grow during the forecast period. The growing focus of automotive OEMs on ADAS is the driving factor this market.
              • such as lane assist systems is the driving factor this market.
              • blind spot detection is the driving factor this market.
              • adaptive cruise control is the driving factor this market.
              • electronic stability control is the driving factor this market.
              • speed assist systems is the driving factor this market.
              • and park assist systems is the driving factor this market.
              • will also increase the number of electronic components in vehicles and lead to the increase in the need for wiring harnesses during the forecast period. Automotive electronics have become an integral part of automobiles. This has been mainly due to technological innovations and developments in the automotive industry is the driving factor this market.
              • especially in the last two decades. The extensive use of automotive electronics is primarily driven by the growing focus on fuel efficiency and the reduction of vehicular emissions is the driving factor this market.
              • and the increasing demand for advanced safety systems. Today is the driving factor this market.
              • automotive electronics serve as core components of various onboard systems in vehicles is the driving factor this market.
              • which include sensors is the driving factor this market.
              • ECUs is the driving factor this market.
              • and wiring harnesses. This is evident from the increasing amount of wiring harnesses being used in modern automobiles. For instance is the driving factor this market.
              • the average amount of wiring harnesses used in modern vehicles is in the range of 100-140 lb. The usage per vehicle is increasing every year is the driving factor this market.
              • which will contribute to revenue generation and is the driving factor this market.
              • in turn is the driving factor this market.
              • will fuel the growth of the global automotive wiring harness market during the forecast period. is the driving factor this market.

              The Automotive Wiring Harness market vendors should focus on grabbing business opportunities from the Passenger vehicles segment as it accounted for the largest market share in the base year.