Wireless Chargers Market Analysis APAC, Europe, North America, South America, Middle East and Africa - US, China, Japan, South Korea, Germany - Size and Forecast 2024-2028

Wireless Chargers Market Analysis APAC, Europe, North America, South America, Middle East and Africa - US, China, Japan, South Korea, Germany - Size and Forecast 2024-2028

Published: Feb 2024 185 Pages SKU: IRTNTR44918

Market Overview at a Glance

$68.42 B
Market Opportunity
23.5%
CAGR
21.89
YoY growth 2023-2024(%)

Wireless Chargers Market Size 2024-2028

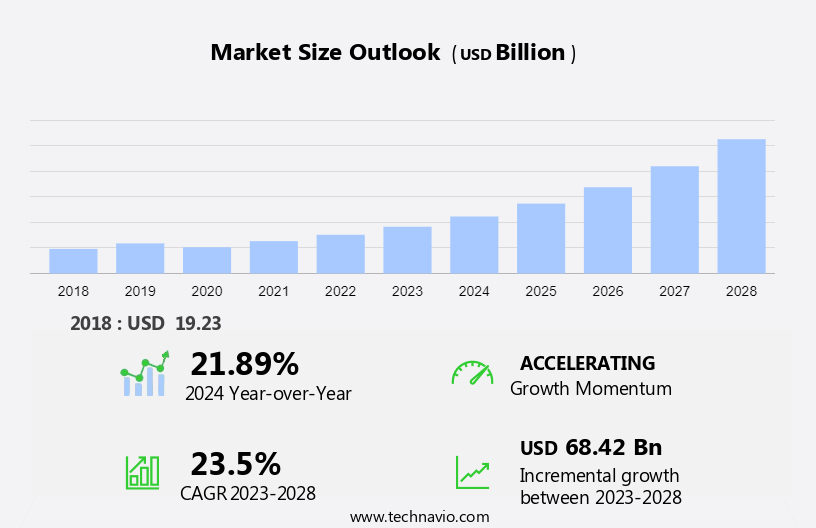
The wireless chargers market size is forecast to increase by USD 68.42 bn at a CAGR of 23.5% between 2023 and 2028.

  • The market is witnessing significant growth due to several key trends. The increasing adoption of artificial intelligence and smart home technologies is driving the demand for wireless charging solutions for various consumer electronics, including smartphones, laptops, tablets, and even industrial robots. Additionally, the rise of Qi standard and over-the-air wireless charging technologies are making charging more convenient and efficient for consumers. However, compatibility issues between different smartphone models and wireless charger standards remain a challenge. Furniture manufacturers are also integrating wireless charging pads into their designs, offering consumers a seamless charging experience at home. Thermal management systems are also being integrated into wireless chargers to ensure safe and efficient charging of batteries in devices such as headphones, smartphones, and laptops.
  • The market is expected to continue growing as wireless charging becomes a standard feature in consumer electronics and logistics companies adopt automation and wireless charging for their operations. Key industries such as automotive and computing are also adopting wireless charging for their digital devices, further expanding the market's reach. The market is also witnessing the emergence of wireless charging solutions for non-traditional devices, such as radio and computer peripherals, making wireless charging an increasingly versatile technology.
  • What will be the Size of the Wireless Chargers Market during the Forecast Period?

    Wireless Chargers Market Size

     Request Free Sample

  • The wireless charging market encompasses various technologies, including inductive, resonant, and radio frequency, catering to diverse industry verticals such as consumer electronics, automotive, healthcare, aerospace & defense, and more. The market's growth is driven by the increasing demand for convenient and contactless charging solutions for devices like smartphones, computer laptops, smartwatches, and electric vehicles (EVs). Inductive charging, the most common wireless charging technology, is widely used in consumer electronics. However, emerging technologies like resonant and long-range charging are gaining traction, offering advantages such as faster charging times and the ability to charge multiple devices simultaneously. Additionally, bi-directional wireless charging, which allows power to flow both ways between a device and a charging pad, is gaining attention In the automotive segment for applications like vehicle-to-grid systems and EV charging infrastructure.
  • Overall, the wireless charging market is expected to grow significantly due to the increasing adoption of wireless charging technology across various industry verticals and the continuous advancements in charging technologies.
  • How is this Wireless Chargers Industry segmented and which is the largest segment?

    The wireless chargers industry research report provides comprehensive data (region-wise segment analysis), with forecasts and estimates in "USD billion" for the period 2024-2028, as well as historical data from 2018-2022 for the following segments.

    • Application
      • Consumer electronics
      • Healthcare
      • Automotive
      • Industrial
      • Defense
    • Technology
      • Inductive
      • Magnetic resonance
      • Radio frequency
      • Microwave
      • Optical beam
    • Geography
      • APAC
        • China
        • Japan
        • South Korea
      • Europe
        • Germany
      • North America
        • US
      • South America
        • Middle East and Africa

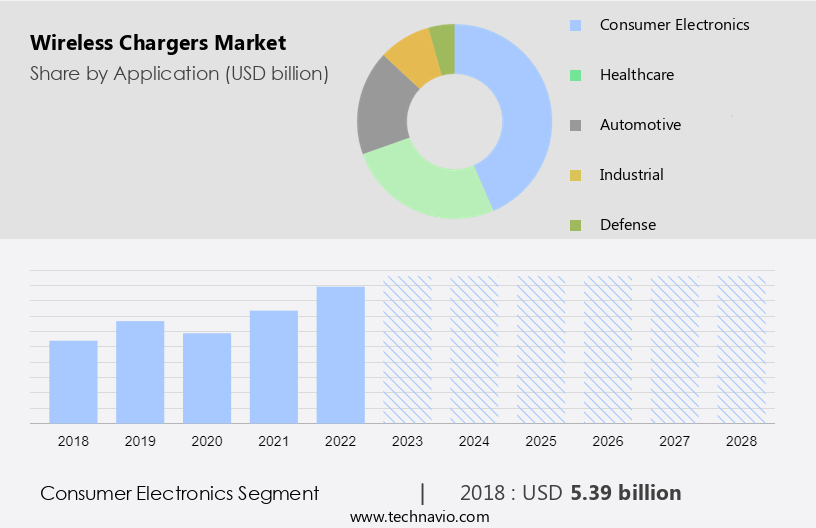
        By Application Insights

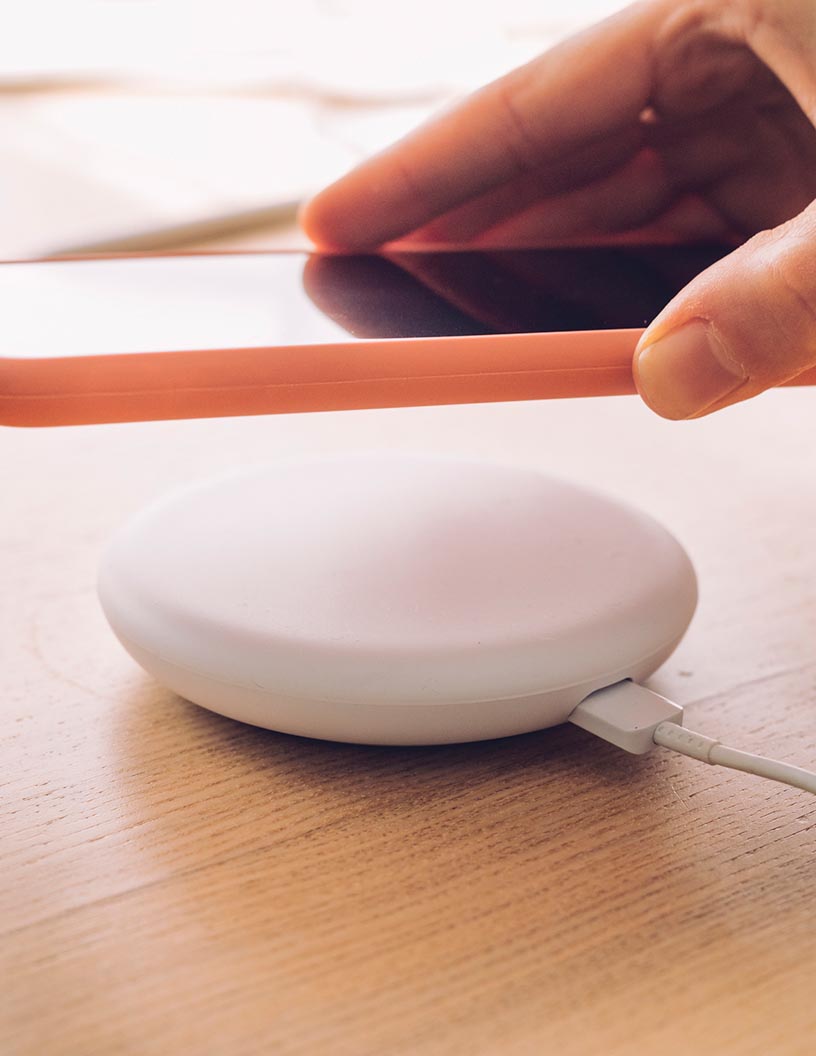
        The consumer electronics segment is estimated to witness significant growth during the forecast period. The market experiences substantial growth, primarily driven by the consumer electronics sector. Devices such as smartphones, tablets, smartwatches, and earbuds are major contributors to this trend, as wireless charging offers a convenient and cable-free charging experience. Notably, smartphones represent a significant portion of the consumer electronics segment embracing wireless charging. Leading manufacturers, including Apple Inc., integrate wireless charging capabilities into their premium models, fueling market expansion. For instance, Apple's MagSafe charging infrastructure on iPhones enables wireless charging without the use of cables. Furthermore, the automotive industry is another key application area for wireless charging technology, with electric vehicles (EVs) and logistics electric vehicles adopting this technology for charging infrastructure.

        Technologies such as inductive, resonant, and radio frequency are employed in wireless charging systems. The consumer electronics and automotive industries are the primary industry verticals, with healthcare, aerospace & defense, and industrial robots also showing potential for growth. Wireless charging technology offers numerous benefits, including eliminating the need for physical wires and reducing carbon emissions, making it a preferred choice for both consumers and industries.

        Wireless Chargers Market Size

        Get a glance at the market report of various segments Request Free Sample

        The Consumer electronics segment was valued at USD 5.39 bn in 2018 and showed a gradual increase during the forecast period.

        Regional Analysis

        APAC is estimated to contribute 46% to the growth of the global market during the forecast period. Technavio’s analysts have elaborately explained the regional trends and drivers that shape the market during the forecast period.

        Wireless Chargers Market Share by Geography

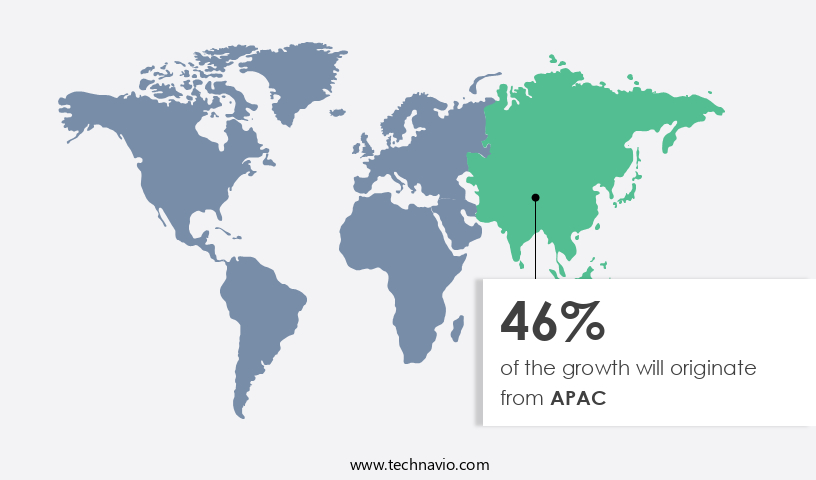
        For more insights on the market size of various regions, Request Free Sample

        The global wireless charging market is experiencing significant growth, driven by the increasing adoption of consumer electronic devices such as smartphones and computer laptops. The automotive industry is also embracing wireless charging technology for electric vehicles (EVs) and logistics electric vehicles. Two primary technologies, inductive and resonant, dominate the market. Inductive technology is widely used for charging small devices like smartphones and hearing aids, while resonant technology is preferred for long-range charging of heavy vehicles and industrial robots. Key market players include SLB Batteries, Halo receiver, and various consumer electronics and automotive companies. The integration of wireless charging with smart home automations and digital platforms like the SmartThings Hub and Qi-based charging stations is further fueling market growth.

        Despite advancements, challenges such as physical wire replacement, cost per unit, and potential technical errors, including short circuits and overheating, must be addressed through thermal management systems and industry standards. The market is expected to expand across various industry verticals, including automotive, healthcare, aerospace & defense, and consumer electronics.

        Market Dynamics

        Our researchers analyzed the data with 2023 as the base year, along with the key drivers, trends, and challenges. A holistic analysis of drivers will help companies refine their marketing strategies to gain a competitive advantage.

        What are the key market drivers leading to the rise In the adoption of market?

        Increasing adoption of Qi standard is the key driver of the market.The wireless charging market is experiencing significant growth due to the increasing popularity of Qi-based charging technology. This standard, adopted by numerous firms globally, enables compatibility between devices and chargers from different manufacturers. The Qi specification is the only requirement for devices and chargers to work together, making it a preferred choice for various consumer electronic devices, including smartphones, computer laptops, electric vehicles (EVs), smartwatches, hearing aids, and more. Key players, such as Apple and Samsung, have integrated Qi technology into their products, expanding its reach and usage. This interoperability advantage is driving the market, allowing for digital connectivity and remote charging solutions in various industry verticals, including consumer electronics, automotive, healthcare, aerospace & defense, and logistics electric vehicles.

        However, it is essential to ensure safety measures, such as thermal management systems and short circuit prevention, to prevent accidents and technical errors. The market consists of two main segments: inductive and radio frequency technology. While inductive technology is widely used for charging small batteries, resonant technology is gaining traction for long-range wireless charging applications in heavy vehicles, industrial robots, and electric cars. The cost per unit for wireless charging technology is expected to decrease as sales of resonant units increase, making it an attractive option for businesses and consumers alike.

        What are the market trends shaping the Wireless Chargers market?

        Increase in adoption of over-the-air wireless charging is the upcoming market trend.Wireless charging technology is evolving beyond traditional inductive methods, with companies exploring long-range options for charging various devices, including Electric Vehicles (EVs) and consumer electronic devices like smartphones, computer laptops, smartwatches, and hearing aids. Over-the-air wireless charging, which converts wireless signals into electricity, is gaining traction as it enables charging without the need for physical contact between the device and the charger. This technology, which can charge devices from a distance, is being developed by firms such as Energous. Their WattUp technology utilizes Radio Frequency (RF) to power multiple devices in order of priority. In the automotive industry, this technology could revolutionize EV infrastructure by eliminating the need for physical electric charging stations and reducing carbon emissions.

        In addition, bi-directional wireless charging is being explored for smart home automations, allowing energy to flow between devices and the grid, enhancing digital connectivity and remote work capabilities. Other technologies, such as resonant and inductive, are also being employed in various industry verticals, including healthcare, aerospace & defense, and automotive, to power devices and heavy vehicles like industrial robots. While these advancements offer numerous benefits, potential challenges include technical errors, overheating, and thermal management systems to prevent short circuits and accidents. Cost per unit and home charging unit sales are crucial factors In the technology analysis of these wireless charging segments.

        What challenges does the market face during its growth?

        Compatibility issues of smartphones with wireless charger standards is a key challenge affecting the industry growth.The wireless charging market encompasses a diverse range of consumer electronic devices, including smartphones, computer laptops, electric vehicles (EVs), smartwatches, hearing aids, and industrial robots. While inductive technology dominates the market, resonant and radio frequency technology are gaining traction due to their long-range charging capabilities. However, the lack of standardization poses a significant challenge. For instance, not all smartphones and tablets, such as Samsung Galaxy S6 and S7, are compatible with Qi-based wireless charging, and iPhones still lack compatibility with most wireless charging standards. This issue hinders the mass adoption of wireless charging In the consumer electronics industry. Moreover, the automotive industry's shift towards electric vehicles (EVs) and the integration of smart home automations with the Internet of Things (IoT) and artificial intelligence (AI) necessitate the development of long-range wireless charging solutions.

        The automotive segment, including logistics electric vehicles, is expected to witness significant growth In the wireless charging market. However, technical errors such as short circuits and overheating, which can lead to accidents, necessitate the implementation of thermal management systems in wireless charging units. The cost per unit for wireless charging units varies depending on the technology and industry vertical, with the inductive segment accounting for the largest market share and the radio frequency segment experiencing significant growth. The market analysis indicates that resonant unit sales are expected to increase as the technology becomes more cost-effective and efficient. The wireless charging market is poised for growth, driven by the increasing demand for digital connectivity, remote work, and the integration of wireless charging technology into various industry verticals, including consumer electronics, automotive, healthcare, aerospace & defense, and industrial applications.

        Exclusive Customer Landscape

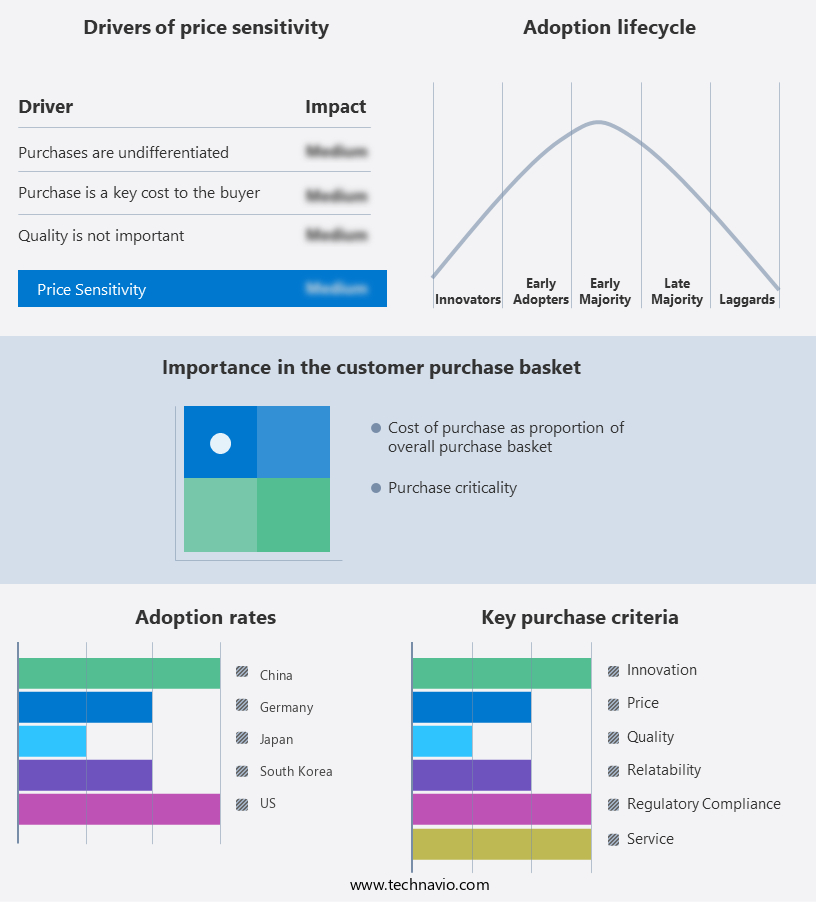
        The wireless chargers market forecasting report includes the adoption lifecycle of the market, covering from the innovator’s stage to the laggard’s stage. It focuses on adoption rates in different regions based on penetration. Furthermore, the wireless chargers market report also includes key purchase criteria and drivers of price sensitivity to help companies evaluate and develop their market growth analysis strategies.

        Wireless Chargers Market Share by Geography

         Customer Landscape

        Key Companies & Market Insights

        Companies are implementing various strategies, such as strategic alliances, wireless chargers market forecast, partnerships, mergers and acquisitions, geographical expansion, and product/service launches, to enhance their presence In the industry.

        Aircharge - The company provides a range of wireless charging solutions, including the Anker MagGo wireless charging station and Anker MagGo wireless charger, as well as the Anker 3 in 1 cube with MagSafe technology. These offerings cater to diverse charging needs, ensuring compatibility with various devices and delivering efficient power transfer. The wireless chargers leverage advanced technologies to provide a convenient and clutter-free charging experience.

        The industry research and growth report includes detailed analyses of the competitive landscape of the market and information about key companies, including:

        • Aircharge
        • AirFuel Alliance
        • Anker Technology UK Ltd.
        • Apple Inc.
        • Belkin International Inc.
        • BEZALEL Inc.
        • Delta Electronics Inc.
        • Energizer Holdings Inc.
        • iOttie Inc.
        • Koninklijke Philips N.V.
        • Mojo Mobility Inc.
        • Murata Manufacturing Co. Ltd.
        • Naztech Technologies
        • Ossia Inc.
        • Powercast Corp.
        • Powermat Technologies Ltd.
        • Qualcomm Inc.
        • Renesas Electronics Corp.
        • Samsung Electronics Co. Ltd.
        • Sony Group Corp.
        • Texas Instruments Inc.
        • WiTricity Corp.
        • ZENS Consumer BV

        Qualitative and quantitative analysis of companies has been conducted to help clients understand the wider business environment as well as the strengths and weaknesses of key industry players. Data is qualitatively analyzed to categorize companies as pure play, category-focused, industry-focused, and diversified; it is quantitatively analyzed to categorize companies as dominant, leading, strong, tentative, and weak.

        Research Analyst Overview

        The wireless charging market encompasses a range of technologies and applications, with inductive, resonant, and radio frequency being the primary methods utilized. Inductive charging, which uses magnetic fields to transfer energy between two objects, has gained significant traction In the consumer electronics industry. This technology is commonly used for charging smartphones, computer laptops, and other small devices. Resonant charging, on the other hand, operates at a higher frequency and can enable longer-range charging. This technology is increasingly being explored for use in electric vehicles (EVs) and industrial applications, such as charging heavy vehicles and powering giant robots. Another emerging trend In the wireless charging market is bi-directional charging, which allows energy to flow both ways between the charger and the device.

        This technology can be particularly beneficial for EVs, as it enables the vehicle to feed excess energy back into the grid during periods of low demand. The infrastructure required for wireless charging varies depending on the technology and application. Inductive charging typically requires a physical pad or mat, while resonant charging may require specialized equipment and antennas. In the automotive industry, wireless charging is being integrated into smart things hubs and SLB batteries to facilitate seamless charging of electric cars and logistics vehicles. The wireless charging market is also being driven by advancements In the Internet of Things (IoT) and digital platforms.

        With the increasing prevalence of smart home automations and wearable devices, the demand for wireless charging solutions is expected to grow. However, there are challenges associated with wireless charging, including the potential for short circuits and accidents. Physical wire-based charging remains a viable alternative, particularly for heavy-duty applications and electric charging stations. Despite these challenges, the wireless charging market is expected to grow significantly In the coming years. The automotive segment is expected to dominate the market, driven by the increasing adoption of electric vehicles. The consumer electronics industry is also expected to contribute significantly to the growth of the market, as the demand for wireless charging solutions for smartphones, laptops, and other devices continues to rise.

        The cost per unit of wireless charging technology is expected to decrease as the technology becomes more widespread and competition increases. This will make wireless charging more accessible to consumers and businesses, further driving market growth. In conclusion, the wireless charging market is a dynamic and growing industry, driven by advancements in technology and the increasing demand for wireless charging solutions in various industries. Inductive, resonant, and radio frequency technologies are the primary methods used, with inductive charging being the most prevalent In the consumer electronics industry and resonant charging being explored for longer-range applications. The automotive segment is expected to dominate the market, driven by the increasing adoption of electric vehicles.

        The challenges associated with wireless charging, such as the potential for short circuits and accidents, are being addressed through advancements in technology and the development of safety features. The cost per unit is expected to decrease, making wireless charging more accessible to consumers and businesses.

        Market Scope

        Report Coverage

        Details

        Page number

        185

        Base year

        2023

        Historic period

        2018-2022

        Forecast period

        2024-2028

        Growth momentum & CAGR

        Accelerate at a CAGR of 23.5%

        Market growth 2024-2028

        USD 68.42 billion

        Market structure

        Fragmented

        YoY growth 2023-2024(%)

        21.89

        Key countries

        US, China, Japan, South Korea, and Germany

        Competitive landscape

        Leading Companies, Market Positioning of Companies, Competitive Strategies, and Industry Risks

        Request Free Sample

        What are the Key Data Covered in this Wireless Chargers Market Research and Growth Report?

        • CAGR of the Wireless Chargers industry during the forecast period
        • Detailed information on factors that will drive the growth and forecasting between 2024 and 2028
        • Precise estimation of the size of the market and its contribution of the industry in focus to the parent market
        • Accurate predictions about upcoming growth and trends and changes in consumer behaviour
        • Growth of the market across APAC, Europe, North America, South America, and Middle East and Africa
        • Thorough analysis of the market’s competitive landscape and detailed information about companies
        • Comprehensive analysis of factors that will challenge the wireless chargers market growth of industry companies

        We can help! Our analysts can customize this wireless chargers market research report to meet your requirements.

        Get in touch


        1 Executive Summary

        • 1.1 Market overview
          • Exhibit 01: Executive Summary – Chart on Market Overview
          • Exhibit 02: Executive Summary – Data Table on Market Overview
          • Exhibit 03: Executive Summary – Chart on Global Market Characteristics
          • Exhibit 04: Executive Summary – Chart on Market by Geography
          • Exhibit 05: Executive Summary – Chart on Market Segmentation by Application
          • Exhibit 06: Executive Summary – Chart on Market Segmentation by Technology
          • Exhibit 07: Executive Summary – Chart on Incremental Growth
          • Exhibit 08: Executive Summary – Data Table on Incremental Growth
          • Exhibit 09: Executive Summary – Chart on Vendor Market Positioning

        2 Market Landscape

        • 2.1 Market ecosystem
          • Exhibit 10: Parent market
          • Exhibit 11: Market Characteristics

        3 Market Sizing

        • 3.1 Market definition
          • Exhibit 12: Offerings of vendors included in the market definition
        • 3.2 Market segment analysis
          • Exhibit 13: Market segments
        • 3.3 Market size 2023
          • 3.4 Market outlook: Forecast for 2023-2028
            • Exhibit 14: Chart on Global - Market size and forecast 2023-2028 ($ billion)
            • Exhibit 15: Data Table on Global - Market size and forecast 2023-2028 ($ billion)
            • Exhibit 16: Chart on Global Market: Year-over-year growth 2023-2028 (%)
            • Exhibit 17: Data Table on Global Market: Year-over-year growth 2023-2028 (%)

          4 Historic Market Size

          • 4.1 Global wireless chargers market 2018 - 2022
            • Exhibit 18: Historic Market Size – Data Table on global wireless chargers market 2018 - 2022 ($ billion)
          • 4.2 Application Segment Analysis 2018 - 2022
            • Exhibit 19: Historic Market Size – Application Segment 2018 - 2022 ($ billion)
          • 4.3 Technology Segment Analysis 2018 - 2022
            • Exhibit 20: Historic Market Size – Technology Segment 2018 - 2022 ($ billion)
          • 4.4 Geography Segment Analysis 2018 - 2022
            • Exhibit 21: Historic Market Size – Geography Segment 2018 - 2022 ($ billion)
          • 4.5 Country Segment Analysis 2018 - 2022
            • Exhibit 22: Historic Market Size – Country Segment 2018 - 2022 ($ billion)

          5 Five Forces Analysis

          • 5.1 Five forces summary
            • Exhibit 23: Five forces analysis - Comparison between 2023 and 2028
          • 5.2 Bargaining power of buyers
            • Exhibit 24: Chart on Bargaining power of buyers – Impact of key factors 2023 and 2028
          • 5.3 Bargaining power of suppliers
            • Exhibit 25: Bargaining power of suppliers – Impact of key factors in 2023 and 2028
          • 5.4 Threat of new entrants
            • Exhibit 26: Threat of new entrants – Impact of key factors in 2023 and 2028
          • 5.5 Threat of substitutes
            • Exhibit 27: Threat of substitutes – Impact of key factors in 2023 and 2028
          • 5.6 Threat of rivalry
            • Exhibit 28: Threat of rivalry – Impact of key factors in 2023 and 2028
          • 5.7 Market condition
            • Exhibit 29: Chart on Market condition - Five forces 2023 and 2028

          6 Market Segmentation by Application

          • 6.1 Market segments
            • Exhibit 30: Chart on Application - Market share 2023-2028 (%)
            • Exhibit 31: Data Table on Application - Market share 2023-2028 (%)
          • 6.2 Comparison by Application
            • Exhibit 32: Chart on Comparison by Application
            • Exhibit 33: Data Table on Comparison by Application
          • 6.3 Consumer electronics - Market size and forecast 2023-2028
            • Exhibit 34: Chart on Consumer electronics - Market size and forecast 2023-2028 ($ billion)
            • Exhibit 35: Data Table on Consumer electronics - Market size and forecast 2023-2028 ($ billion)
            • Exhibit 36: Chart on Consumer electronics - Year-over-year growth 2023-2028 (%)
            • Exhibit 37: Data Table on Consumer electronics - Year-over-year growth 2023-2028 (%)
          • 6.4 Healthcare - Market size and forecast 2023-2028
            • Exhibit 38: Chart on Healthcare - Market size and forecast 2023-2028 ($ billion)
            • Exhibit 39: Data Table on Healthcare - Market size and forecast 2023-2028 ($ billion)
            • Exhibit 40: Chart on Healthcare - Year-over-year growth 2023-2028 (%)
            • Exhibit 41: Data Table on Healthcare - Year-over-year growth 2023-2028 (%)
          • 6.5 Automotive - Market size and forecast 2023-2028
            • Exhibit 42: Chart on Automotive - Market size and forecast 2023-2028 ($ billion)
            • Exhibit 43: Data Table on Automotive - Market size and forecast 2023-2028 ($ billion)
            • Exhibit 44: Chart on Automotive - Year-over-year growth 2023-2028 (%)
            • Exhibit 45: Data Table on Automotive - Year-over-year growth 2023-2028 (%)
          • 6.6 Industrial - Market size and forecast 2023-2028
            • Exhibit 46: Chart on Industrial - Market size and forecast 2023-2028 ($ billion)
            • Exhibit 47: Data Table on Industrial - Market size and forecast 2023-2028 ($ billion)
            • Exhibit 48: Chart on Industrial - Year-over-year growth 2023-2028 (%)
            • Exhibit 49: Data Table on Industrial - Year-over-year growth 2023-2028 (%)
          • 6.7 Defense - Market size and forecast 2023-2028
            • Exhibit 50: Chart on Defense - Market size and forecast 2023-2028 ($ billion)
            • Exhibit 51: Data Table on Defense - Market size and forecast 2023-2028 ($ billion)
            • Exhibit 52: Chart on Defense - Year-over-year growth 2023-2028 (%)
            • Exhibit 53: Data Table on Defense - Year-over-year growth 2023-2028 (%)
          • 6.8 Market opportunity by Application
            • Exhibit 54: Market opportunity by Application ($ billion)
            • Exhibit 55: Data Table on Market opportunity by Application ($ billion)

          7 Market Segmentation by Technology

          • 7.1 Market segments
            • Exhibit 56: Chart on Technology - Market share 2023-2028 (%)
            • Exhibit 57: Data Table on Technology - Market share 2023-2028 (%)
          • 7.2 Comparison by Technology
            • Exhibit 58: Chart on Comparison by Technology
            • Exhibit 59: Data Table on Comparison by Technology
          • 7.3 Inductive - Market size and forecast 2023-2028
            • Exhibit 60: Chart on Inductive - Market size and forecast 2023-2028 ($ billion)
            • Exhibit 61: Data Table on Inductive - Market size and forecast 2023-2028 ($ billion)
            • Exhibit 62: Chart on Inductive - Year-over-year growth 2023-2028 (%)
            • Exhibit 63: Data Table on Inductive - Year-over-year growth 2023-2028 (%)
          • 7.4 Magnetic resonance - Market size and forecast 2023-2028
            • Exhibit 64: Chart on Magnetic resonance - Market size and forecast 2023-2028 ($ billion)
            • Exhibit 65: Data Table on Magnetic resonance - Market size and forecast 2023-2028 ($ billion)
            • Exhibit 66: Chart on Magnetic resonance - Year-over-year growth 2023-2028 (%)
            • Exhibit 67: Data Table on Magnetic resonance - Year-over-year growth 2023-2028 (%)
          • 7.5 Radio frequency - Market size and forecast 2023-2028
            • Exhibit 68: Chart on Radio frequency - Market size and forecast 2023-2028 ($ billion)
            • Exhibit 69: Data Table on Radio frequency - Market size and forecast 2023-2028 ($ billion)
            • Exhibit 70: Chart on Radio frequency - Year-over-year growth 2023-2028 (%)
            • Exhibit 71: Data Table on Radio frequency - Year-over-year growth 2023-2028 (%)
          • 7.6 Microwave - Market size and forecast 2023-2028
            • Exhibit 72: Chart on Microwave - Market size and forecast 2023-2028 ($ billion)
            • Exhibit 73: Data Table on Microwave - Market size and forecast 2023-2028 ($ billion)
            • Exhibit 74: Chart on Microwave - Year-over-year growth 2023-2028 (%)
            • Exhibit 75: Data Table on Microwave - Year-over-year growth 2023-2028 (%)
          • 7.7 Optical beam - Market size and forecast 2023-2028
            • Exhibit 76: Chart on Optical beam - Market size and forecast 2023-2028 ($ billion)
            • Exhibit 77: Data Table on Optical beam - Market size and forecast 2023-2028 ($ billion)
            • Exhibit 78: Chart on Optical beam - Year-over-year growth 2023-2028 (%)
            • Exhibit 79: Data Table on Optical beam - Year-over-year growth 2023-2028 (%)
          • 7.8 Market opportunity by Technology
            • Exhibit 80: Market opportunity by Technology ($ billion)
            • Exhibit 81: Data Table on Market opportunity by Technology ($ billion)

          8 Customer Landscape

          • 8.1 Customer landscape overview
            • Exhibit 82: Analysis of price sensitivity, lifecycle, customer purchase basket, adoption rates, and purchase criteria

          9 Geographic Landscape

          • 9.1 Geographic segmentation
            • Exhibit 83: Chart on Market share by geography 2023-2028 (%)
            • Exhibit 84: Data Table on Market share by geography 2023-2028 (%)
          • 9.2 Geographic comparison
            • Exhibit 85: Chart on Geographic comparison
            • Exhibit 86: Data Table on Geographic comparison
          • 9.3 APAC - Market size and forecast 2023-2028
            • Exhibit 87: Chart on APAC - Market size and forecast 2023-2028 ($ billion)
            • Exhibit 88: Data Table on APAC - Market size and forecast 2023-2028 ($ billion)
            • Exhibit 89: Chart on APAC - Year-over-year growth 2023-2028 (%)
            • Exhibit 90: Data Table on APAC - Year-over-year growth 2023-2028 (%)
          • 9.4 Europe - Market size and forecast 2023-2028
            • Exhibit 91: Chart on Europe - Market size and forecast 2023-2028 ($ billion)
            • Exhibit 92: Data Table on Europe - Market size and forecast 2023-2028 ($ billion)
            • Exhibit 93: Chart on Europe - Year-over-year growth 2023-2028 (%)
            • Exhibit 94: Data Table on Europe - Year-over-year growth 2023-2028 (%)
          • 9.5 North America - Market size and forecast 2023-2028
            • Exhibit 95: Chart on North America - Market size and forecast 2023-2028 ($ billion)
            • Exhibit 96: Data Table on North America - Market size and forecast 2023-2028 ($ billion)
            • Exhibit 97: Chart on North America - Year-over-year growth 2023-2028 (%)
            • Exhibit 98: Data Table on North America - Year-over-year growth 2023-2028 (%)
          • 9.6 South America - Market size and forecast 2023-2028
            • Exhibit 99: Chart on South America - Market size and forecast 2023-2028 ($ billion)
            • Exhibit 100: Data Table on South America - Market size and forecast 2023-2028 ($ billion)
            • Exhibit 101: Chart on South America - Year-over-year growth 2023-2028 (%)
            • Exhibit 102: Data Table on South America - Year-over-year growth 2023-2028 (%)
          • 9.7 Middle East and Africa - Market size and forecast 2023-2028
            • Exhibit 103: Chart on Middle East and Africa - Market size and forecast 2023-2028 ($ billion)
            • Exhibit 104: Data Table on Middle East and Africa - Market size and forecast 2023-2028 ($ billion)
            • Exhibit 105: Chart on Middle East and Africa - Year-over-year growth 2023-2028 (%)
            • Exhibit 106: Data Table on Middle East and Africa - Year-over-year growth 2023-2028 (%)
          • 9.8 US - Market size and forecast 2023-2028
            • Exhibit 107: Chart on US - Market size and forecast 2023-2028 ($ billion)
            • Exhibit 108: Data Table on US - Market size and forecast 2023-2028 ($ billion)
            • Exhibit 109: Chart on US - Year-over-year growth 2023-2028 (%)
            • Exhibit 110: Data Table on US - Year-over-year growth 2023-2028 (%)
          • 9.9 China - Market size and forecast 2023-2028
            • Exhibit 111: Chart on China - Market size and forecast 2023-2028 ($ billion)
            • Exhibit 112: Data Table on China - Market size and forecast 2023-2028 ($ billion)
            • Exhibit 113: Chart on China - Year-over-year growth 2023-2028 (%)
            • Exhibit 114: Data Table on China - Year-over-year growth 2023-2028 (%)
          • 9.10 Japan - Market size and forecast 2023-2028
            • Exhibit 115: Chart on Japan - Market size and forecast 2023-2028 ($ billion)
            • Exhibit 116: Data Table on Japan - Market size and forecast 2023-2028 ($ billion)
            • Exhibit 117: Chart on Japan - Year-over-year growth 2023-2028 (%)
            • Exhibit 118: Data Table on Japan - Year-over-year growth 2023-2028 (%)
          • 9.11 South Korea - Market size and forecast 2023-2028
            • Exhibit 119: Chart on South Korea - Market size and forecast 2023-2028 ($ billion)
            • Exhibit 120: Data Table on South Korea - Market size and forecast 2023-2028 ($ billion)
            • Exhibit 121: Chart on South Korea - Year-over-year growth 2023-2028 (%)
            • Exhibit 122: Data Table on South Korea - Year-over-year growth 2023-2028 (%)
          • 9.12 Germany - Market size and forecast 2023-2028
            • Exhibit 123: Chart on Germany - Market size and forecast 2023-2028 ($ billion)
            • Exhibit 124: Data Table on Germany - Market size and forecast 2023-2028 ($ billion)
            • Exhibit 125: Chart on Germany - Year-over-year growth 2023-2028 (%)
            • Exhibit 126: Data Table on Germany - Year-over-year growth 2023-2028 (%)
          • 9.13 Market opportunity by geography
            • Exhibit 127: Market opportunity by geography ($ billion)
            • Exhibit 128: Data Tables on Market opportunity by geography ($ billion)

          10 Drivers, Challenges, and Trends

          • 10.1 Market drivers
            • 10.2 Market challenges
              • 10.3 Impact of drivers and challenges
                • Exhibit 129: Impact of drivers and challenges in 2023 and 2028
              • 10.4 Market trends

                11 Vendor Landscape

                • 11.1 Overview
                  • 11.2 Vendor landscape
                    • Exhibit 130: Overview on Criticality of inputs and Factors of differentiation
                  • 11.3 Landscape disruption
                    • Exhibit 131: Overview on factors of disruption
                  • 11.4 Industry risks
                    • Exhibit 132: Impact of key risks on business

                  12 Vendor Analysis

                  • 12.1 Vendors covered
                    • Exhibit 133: Vendors covered
                  • 12.2 Market positioning of vendors
                    • Exhibit 134: Matrix on vendor position and classification
                  • 12.3 Anker Technology UK Ltd.
                    • Exhibit 135: Anker Technology UK Ltd. - Overview
                    • Exhibit 136: Anker Technology UK Ltd. - Product / Service
                    • Exhibit 137: Anker Technology UK Ltd. - Key offerings
                  • 12.4 Apple Inc.
                    • Exhibit 138: Apple Inc. - Overview
                    • Exhibit 139: Apple Inc. - Business segments
                    • Exhibit 140: Apple Inc. - Key news
                    • Exhibit 141: Apple Inc. - Key offerings
                    • Exhibit 142: Apple Inc. - Segment focus
                  • 12.5 Belkin International Inc.
                    • Exhibit 143: Belkin International Inc. - Overview
                    • Exhibit 144: Belkin International Inc. - Product / Service
                    • Exhibit 145: Belkin International Inc. - Key news
                    • Exhibit 146: Belkin International Inc. - Key offerings
                  • 12.6 Delta Electronics Inc.
                    • Exhibit 147: Delta Electronics Inc. - Overview
                    • Exhibit 148: Delta Electronics Inc. - Business segments
                    • Exhibit 149: Delta Electronics Inc. - Key offerings
                    • Exhibit 150: Delta Electronics Inc. - Segment focus
                  • 12.7 Energizer Holdings Inc.
                    • Exhibit 151: Energizer Holdings Inc. - Overview
                    • Exhibit 152: Energizer Holdings Inc. - Business segments
                    • Exhibit 153: Energizer Holdings Inc. - Key offerings
                    • Exhibit 154: Energizer Holdings Inc. - Segment focus
                  • 12.8 Koninklijke Philips N.V.
                    • Exhibit 155: Koninklijke Philips N.V. - Overview
                    • Exhibit 156: Koninklijke Philips N.V. - Business segments
                    • Exhibit 157: Koninklijke Philips N.V. - Key news
                    • Exhibit 158: Koninklijke Philips N.V. - Key offerings
                    • Exhibit 159: Koninklijke Philips N.V. - Segment focus
                  • 12.9 Murata Manufacturing Co. Ltd.
                    • Exhibit 160: Murata Manufacturing Co. Ltd. - Overview
                    • Exhibit 161: Murata Manufacturing Co. Ltd. - Business segments
                    • Exhibit 162: Murata Manufacturing Co. Ltd. - Key news
                    • Exhibit 163: Murata Manufacturing Co. Ltd. - Key offerings
                    • Exhibit 164: Murata Manufacturing Co. Ltd. - Segment focus
                  • 12.10 Ossia Inc.
                    • Exhibit 165: Ossia Inc. - Overview
                    • Exhibit 166: Ossia Inc. - Product / Service
                    • Exhibit 167: Ossia Inc. - Key offerings
                  • 12.11 Powermat Technologies Ltd.
                    • Exhibit 168: Powermat Technologies Ltd. - Overview
                    • Exhibit 169: Powermat Technologies Ltd. - Product / Service
                    • Exhibit 170: Powermat Technologies Ltd. - Key news
                    • Exhibit 171: Powermat Technologies Ltd. - Key offerings
                  • 12.12 Qualcomm Inc.
                    • Exhibit 172: Qualcomm Inc. - Overview
                    • Exhibit 173: Qualcomm Inc. - Business segments
                    • Exhibit 174: Qualcomm Inc. - Key news
                    • Exhibit 175: Qualcomm Inc. - Key offerings
                    • Exhibit 176: Qualcomm Inc. - Segment focus
                  • 12.13 Renesas Electronics Corp.
                    • Exhibit 177: Renesas Electronics Corp. - Overview
                    • Exhibit 178: Renesas Electronics Corp. - Business segments
                    • Exhibit 179: Renesas Electronics Corp. - Key news
                    • Exhibit 180: Renesas Electronics Corp. - Key offerings
                    • Exhibit 181: Renesas Electronics Corp. - Segment focus
                  • 12.14 Samsung Electronics Co. Ltd.
                    • Exhibit 182: Samsung Electronics Co. Ltd. - Overview
                    • Exhibit 183: Samsung Electronics Co. Ltd. - Business segments
                    • Exhibit 184: Samsung Electronics Co. Ltd. - Key news
                    • Exhibit 185: Samsung Electronics Co. Ltd. - Key offerings
                    • Exhibit 186: Samsung Electronics Co. Ltd. - Segment focus
                  • 12.15 Sony Group Corp.
                    • Exhibit 187: Sony Group Corp. - Overview
                    • Exhibit 188: Sony Group Corp. - Business segments
                    • Exhibit 189: Sony Group Corp. - Key news
                    • Exhibit 190: Sony Group Corp. - Key offerings
                    • Exhibit 191: Sony Group Corp. - Segment focus
                  • 12.16 Texas Instruments Inc.
                    • Exhibit 192: Texas Instruments Inc. - Overview
                    • Exhibit 193: Texas Instruments Inc. - Business segments
                    • Exhibit 194: Texas Instruments Inc. - Key news
                    • Exhibit 195: Texas Instruments Inc. - Key offerings
                    • Exhibit 196: Texas Instruments Inc. - Segment focus
                  • 12.17 ZENS Consumer BV
                    • Exhibit 197: ZENS Consumer BV - Overview
                    • Exhibit 198: ZENS Consumer BV - Product / Service
                    • Exhibit 199: ZENS Consumer BV - Key offerings

                  13 Appendix

                  • 13.1 Scope of the report
                    • 13.2 Inclusions and exclusions checklist
                      • Exhibit 200: Inclusions checklist
                      • Exhibit 201: Exclusions checklist
                    • 13.3 Currency conversion rates for US$
                      • Exhibit 202: Currency conversion rates for US$
                    • 13.4 Research methodology
                      • Exhibit 203: Research methodology
                      • Exhibit 204: Validation techniques employed for market sizing
                      • Exhibit 205: Information sources
                    • 13.5 List of abbreviations
                      • Exhibit 206: List of abbreviations

                    Research Methodology

                    Technavio presents a detailed picture of the market by way of study, synthesis, and summation of data from multiple sources. The analysts have presented the various facets of the market with a particular focus on identifying the key industry influencers. The data thus presented is comprehensive, reliable, and the result of extensive research, both primary and secondary.

                    INFORMATION SOURCES

                    Primary sources

                    • Manufacturers and suppliers
                    • Channel partners
                    • Industry experts
                    • Strategic decision makers

                    Secondary sources

                    • Industry journals and periodicals
                    • Government data
                    • Financial reports of key industry players
                    • Historical data
                    • Press releases

                    DATA ANALYSIS

                    Data Synthesis

                    • Collation of data
                    • Estimation of key figures
                    • Analysis of derived insights

                    Data Validation

                    • Triangulation with data models
                    • Reference against proprietary databases
                    • Corroboration with industry experts

                    REPORT WRITING

                    Qualitative

                    • Market drivers
                    • Market challenges
                    • Market trends
                    • Five forces analysis

                    Quantitative

                    • Market size and forecast
                    • Market segmentation
                    • Geographical insights
                    • Competitive landscape

                    Interested in this report?

                    Get your sample now to see our research methodology and insights!

                    Download Now

                    Frequently Asked Questions

                    Wireless Chargers market growth will increase by $ 68.42 bn during 2024-2028.

                    The Wireless Chargers market is expected to grow at a CAGR of 23.5% during 2024-2028.

                    Wireless Chargers market is segmented by Application( Consumer electronics, Healthcare, Automotive, Industrial, Defense) Technology( Inductive, Magnetic resonance, Radio frequency, Microwave, Optical beam)

                    Aircharge, AirFuel Alliance, Anker Technology UK Ltd., Apple Inc., Belkin International Inc., BEZALEL Inc., Delta Electronics Inc., Energizer Holdings Inc., iOttie Inc., Koninklijke Philips N.V., Mojo Mobility Inc., Murata Manufacturing Co. Ltd., Naztech Technologies, Ossia Inc., Powercast Corp., Powermat Technologies Ltd., Qualcomm Inc., Renesas Electronics Corp., Samsung Electronics Co. Ltd., Sony Group Corp., Texas Instruments Inc., WiTricity Corp., ZENS Consumer BV are a few of the key vendors in the Wireless Chargers market.

                    APAC will register the highest growth rate of 46% among the other regions. Therefore, the Wireless Chargers market in APAC is expected to garner significant business opportunities for the vendors during the forecast period.

                    US, China, Japan, South Korea, Germany

                    • Increasing adoption of Qi standardThe higher adoption of the Qi standard compared with other standards by several firms across the globe is a key factor driving the market. The advantage of Qi wireless charging technology is that it makes electronic devices and chargers from different manufacturers compatible with each other. The only criterion is that both the device and the charger (receiver and charger) need to fulfill the Qi specification. This standard is the driving factor this market.
                    • therefore is the driving factor this market.
                    • allows every Qi-enabled device to be compatible with every Qi charging transmitter is the driving factor this market.
                    • regardless of the device manufacturer. Several firms is the driving factor this market.
                    • such as Apple and Samsung is the driving factor this market.
                    • have developed products that comply with the Qi standard. As a result is the driving factor this market.
                    • these products can be charged at any Qi charging station. The adoption of the Qi standard by Apple is a major driver for the market. Apple announced its favor for the Qi standard by releasing its products (iPhone X and iPhone 8) to support the standard. With top companies such as Apple adopting the Qi standard over PMA is the driving factor this market.
                    • we can expect more firms to adopt it as well. This is because the consumer electronics market is highly competitive is the driving factor this market.
                    • and firms need to be on par with competitors by providing the newest features. The adoption of the Qi standard by OEMs and ODMs to integrate into their devices has resulted in the adoption of wireless chargers by several other end users. Further is the driving factor this market.
                    • with Apple exclusively supporting Qi is the driving factor this market.
                    • other standards will subsequently decline. Hence is the driving factor this market.
                    • the Qi standard might be the future of wireless charging. Several automobile companies have also integrated Qi wireless chargers into their products. For example is the driving factor this market.
                    • Audi offers an optional universal mobile telephone holder is the driving factor this market.
                    • which supports Qi wireless charging to facilitate convenient charging. BMW also offers a Qi charging option in several of its models. The company offers it as a standard in the M series models and as an option in the rest of the range. The firm offers wireless charging functionality in two different formats. In the first type is the driving factor this market.
                    • a wireless charging pocket is located inside the central console. In the second type is the driving factor this market.
                    • the firm has a wireless charging tray that can be located on the central console or under the armrest of the vehicle. Hence is the driving factor this market.
                    • there has been increasing support for the Qi standard is the driving factor this market.
                    • which we expect will become the common standard for wireless charging. As the Qi standard is widely adopted is the driving factor this market.
                    • we expect an increase in the demand for wireless chargers to rise since these chargers will also operate on this standard. These chargers will be able to support numerous smartphone models is the driving factor this market.
                    • which is the driving factor this market.
                    • in turn is the driving factor this market.
                    • will drive the growth of the global wireless chargers market during the forecast period. is the driving factor this market.

                    The Wireless Chargers market vendors should focus on grabbing business opportunities from the Consumer electronics segment as it accounted for the largest market share in the base year.