Wireless Chipset Market Size 2025-2029
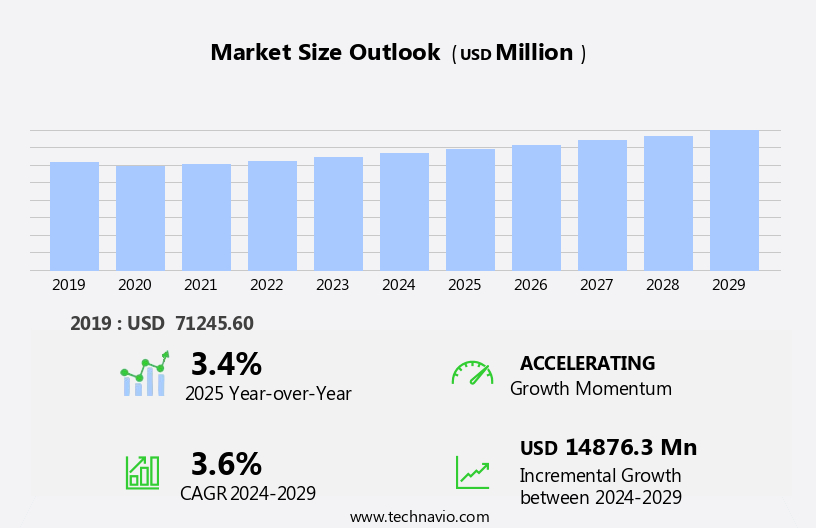
The wireless chipset market size is forecast to increase by USD 14.88 billion at a CAGR of 3.6% between 2024 and 2029.
- The market is experiencing significant growth, driven primarily by the rising demand for smartphones and the increasing adoption of 5G technology. The proliferation of IoT devices and the expansion of wireless connectivity in various industries, such as automotive and healthcare, further fuel market growth. However, the market is not without challenges. Complexities in the manufacturing process, including patterns and functional defects, pose significant hurdles for chipset manufacturers. To capitalize on market opportunities and navigate these challenges effectively, companies must focus on innovation, operational efficiency, and strategic partnerships.
- By investing in research and development to address manufacturing complications and stay ahead of technological advancements, chipset manufacturers can differentiate themselves in a competitive landscape and meet the evolving demands of consumers and industries alike.
What will be the Size of the Wireless Chipset Market during the forecast period?
- The market, a critical component of the expanding Internet of Things (IoT) ecosystem, continues to gain momentum as the demand for connected devices waves across various sectors. The market's sizeable growth can be attributed to the increasing adoption of wireless chipsets in residential, industrial, and commercial sectors. These chipsets enable high-security data transfer, faster processing, and convenient living experiences through Wi-Fi technologies, including 5 GHz bands. In the residential sector, smart home applications, such as voice assistants, smart thermostats, smart lighting, security cameras, and smart appliances, are driving the market's expansion. Meanwhile, in the industrial sector, wireless chipsets are integral to the development of smart buildings, real-time surveillance, and public Wi-Fi hotspots.
- In the commercial sector, high-speed internet connectivity and the integration of voice assistants and other smart technologies are fostering growth. Overall, the market is poised for continued expansion, as the IoT ecosystem continues to evolve and mature.
How is this Wireless Chipset Industry segmented?
The wireless chipset industry research report provides comprehensive data (region-wise segment analysis), with forecasts and estimates in "USD million" for the period 2025-2029, as well as historical data from 2019-2023 for the following segments.
- End-user
- IT and telecom
- Consumer electronics
- Automotive and transportation
- Aerospace and defense
- Others
- Application
- Computers and laptops
- Smartphones and wearable
- Routers
- In-vehicle infotainment systems
- Others
- Type
- Wi-Fi chipsets
- Wireless display/video chipsets
- WiMax chipsets
- LTE chipsets
- ZigBee chipsets
- Geography
- APAC
- Australia
- China
- India
- Japan
- South Korea
- North America
- US
- Canada
- Europe
- France
- Germany
- UK
- Middle East and Africa
- South America
- APAC
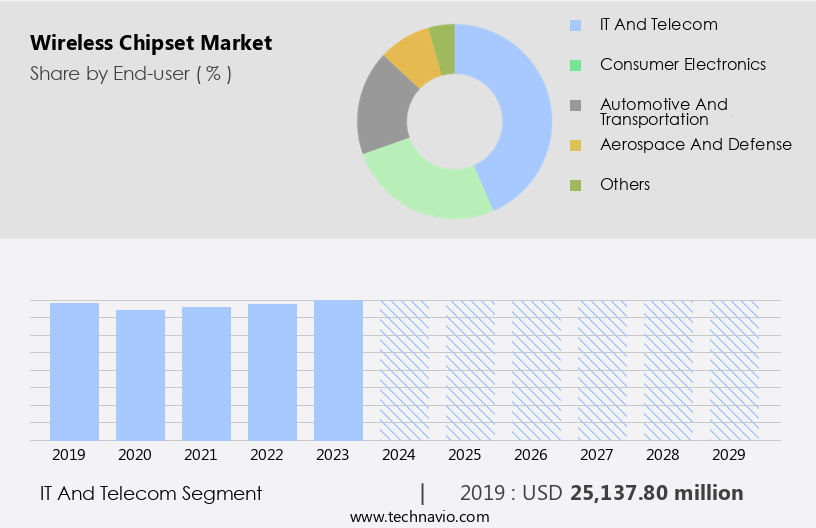
By End-user Insights
The IT and telecom segment is estimated to witness significant growth during the forecast period. The market caters to the IT and telecom sectors, with applications spanning Wi-Fi infrastructure and 5G deployment. In IT, wireless chipsets are vital for advanced networking solutions like Wi-Fi routers, access points, and network interface cards, ensuring high-speed internet connectivity and seamless data transfer within corporate networks. The increasing adoption of cloud computing and the proliferation of connected devices fuel the demand for dependable wireless infrastructure, thereby boosting market growth. In telecom, wireless chipsets are indispensable for the deployment of next-generation communication technologies such as 5G. These chipsets provide high-performance network connectivity, multiple users, and constant bandwidth capacity, making them essential for high-tech smart devices, industrial automation, and wireless technology.
With the advent of Wi-Fi 7 ecosystem, low latency, and increased range, fabrication technologies like silicon-on-insulator (SOI) and TCP/IP stack further enhance wireless chipset capabilities. The market expansion is driven by the growing need for high-speed internet, smart home applications, voice assistants, smart thermostats, and security cameras, among others. Data security and chipset innovation are key focus areas to address potential attack vectors from unsecured devices. Wi-Fi chipsets are integral to various sectors, including consumer electronics, wearable tech, commercial applications, residential applications, and public hotspots, offering data transfer solutions for Wi-Fi technologies, mobile networks, and Wi-Fi hotspot solutions.
Communication service providers and network operators rely on these chipsets to provide 5G internet services, 5G smartphones, and 5G subscriptions, ensuring real-time data penetration and network performance.
Get a glance at the market report of share of various segments Request Free Sample
The IT and telecom segment was valued at USD 25.14 billion in 2019 and showed a gradual increase during the forecast period.
Regional Analysis
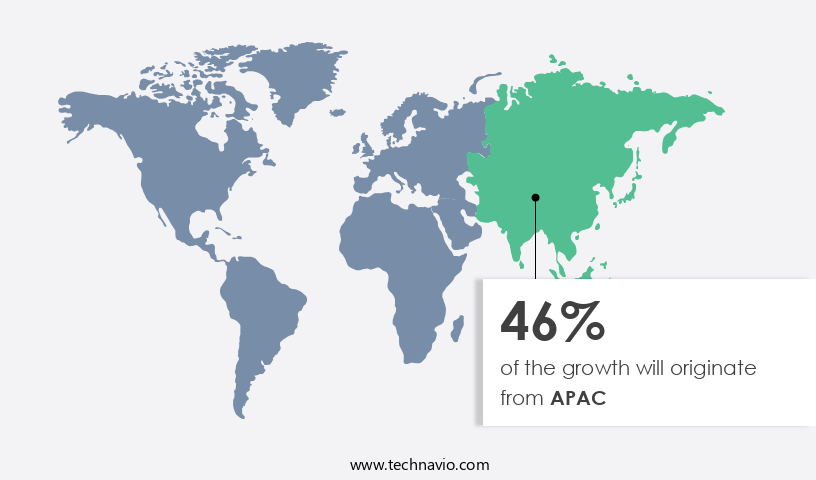
APAC is estimated to contribute 46% to the growth of the global market during the forecast period.Technavio's analysts have elaborately explained the regional trends and drivers that shape the market during the forecast period.
For more insights on the market size of various regions, Request Free Sample
The market is experiencing significant growth in the Asia Pacific (APAC) region due to the investment of major semiconductor foundries, including Taiwan Semiconductor Manufacturing, United Microelectronics, Samsung, and Semiconductor Manufacturing International. APAC's attractive combination of low labor costs, vast market potential, and favorable government policies is driving this growth. As the largest consumer of semiconductor devices, APAC contributes over 50% of the industry's total revenue, largely due to the presence of prominent players in consumer electronics and mobile devices, such as Samsung, Toshiba, and Panasonic. Wireless chipsets play a crucial role in enabling high-performance network connectivity for various sectors, including industrial, residential, and commercial.
In the industrial sector, wireless chipsets facilitate industrial Wi-Fi applications, ensuring constant bandwidth capacity for multiple users and real-time communication. In the residential sector, Wi-Fi chipsets enable smart buildings and home applications, such as voice assistants, smart thermostats, and security cameras. In the commercial sector, Wi-Fi chipsets support high-tech smart devices, real-time data penetration, and open-source software, enhancing communication and collaboration tools. The Wi-Fi chipset market is also expanding in the context of the Internet of Things (IoT), with applications in consumer electronics, wearable tech, and commercial applications. Wi-Fi chipsets enable seamless connectivity for devices, ensuring compatibility with various network protocols and data security.
With the increasing deployment of 5G networks, Wi-Fi chipsets will play a vital role in enhancing network performance and device integration. The market is a critical component of the semiconductor industry, driving innovation and growth in various sectors. Its role in enabling high-speed internet, real-time communication, and device integration is essential for the proliferation of smart devices, IoT applications, and 5G networks. The APAC region, with its attractive business environment and market potential, is expected to lead the growth in the market during the forecast period.
Market Dynamics
Our researchers analyzed the data with 2024 as the base year, along with the key drivers, trends, and challenges. A holistic analysis of drivers will help companies refine their marketing strategies to gain a competitive advantage.
What are the key market drivers leading to the rise in the adoption of Wireless Chipset Industry?
- Rise in demand for smartphones is the key driver of the market. The market has experienced significant growth due to the increasing sales of smartphones, particularly in emerging markets such as India and China. In 2024, more than 1.20 billion units of smartphones were shipped, surpassing the 1.10 billion units sold in 2023. This trend can be attributed to the availability of affordable smartphones and the rising number of mobile broadband subscribers and Internet users.
- The growth of regional companies introducing tablets in their respective markets has also contributed to the increase in smartphone sales. As a result, the demand for wireless chipsets, a crucial component of smartphones, is expected to increase, leading to market expansion during the forecast period. The IT sector is also embracing wireless chipsets to enhance collaboration tools and improve network reliability. The use of wireless modules and network protocols is enabling real-time data penetration and data security, making wireless chipsets an essential component of modern business operations. The market is expected to continue growing as the demand for wireless connectivity solutions increases.
What are the market trends shaping the Wireless Chipset Industry?
- Increasing adoption of 5G technology is the upcoming market trend. The market is experiencing substantial growth due to the adoption of 5G technology. This advanced wireless technology offers faster speeds, lower latency, and increased network capacity compared to previous generations. The demand for compatible chipsets to power devices that utilize 5G technology is driving market expansion. Furthermore, the Internet of Things (IoT) ecosystem is expanding rapidly, and 5G technology plays a vital role in supporting the connectivity needs of IoT devices.
- Wireless chipsets facilitate efficient communication and data transfer between IoT devices, enabling applications such as smart homes, industrial automation, connected cars, and smart cities. The integration of 5G technology and wireless chipsets is expected to revolutionize various industries and create new opportunities for market growth. Wireless chipsets are also being used in various commercial applications, such as public hotspots in coffee shops, sports stadiums, retail stores, and commercial complexes. Communication service providers and network operators are investing in Wi-Fi technologies to offer 5G internet services, 5G smartphones, and 5G subscriptions to their customers.
What challenges does the Wireless Chipset Industry face during its growth?
- Complications of patterns and functional defects in manufacturing process is a key challenge affecting the industry growth. The market necessitates substantial investments in research and development to keep up with the latest technology standards and specifications. These costs include expenses for testing, equipment, and fabrication facilities.
- New technologies, such as 5G and Wi-Fi 6, necessitate even more significant investments due to their demanding requirements. The continuous evolution of wireless technology necessitates ongoing research and development efforts to ensure compatibility, efficiency, and performance. These expenses can act as a barrier to entry for new market participants and limit the expansion of existing companies. The IT sector is also embracing wireless chipsets to enhance collaboration tools and improve network reliability. The use of wireless modules and network protocols is enabling real-time data penetration and data security, making wireless chipsets an essential component of modern business operations. The market is expected to continue growing as the demand for wireless connectivity solutions increases.
Exclusive Customer Landscape
The wireless chipset market forecasting report includes the adoption lifecycle of the market, covering from the innovator's stage to the laggard's stage. It focuses on adoption rates in different regions based on penetration. Furthermore, the wireless chipset market report also includes key purchase criteria and drivers of price sensitivity to help companies evaluate and develop their market growth analysis strategies.

Customer Landscape
Key Companies & Market Insights
Companies are implementing various strategies, such as strategic alliances, wireless chipset market forecast, partnerships, mergers and acquisitions, geographical expansion, and product/service launches, to enhance their presence in the industry.
Accton Technology Corp. - The company offers wireless chipsets such as AR9580 Wi-Fi 5 module, the AR9535 Wi-Fi 4 module, and the AR9331 Wi-Fi 3 module.
The industry research and growth report includes detailed analyses of the competitive landscape of the market and information about key companies, including:
- Accton Technology Corp.
- ALE International
- ASUSTeK Computer Inc.
- Broadcom Inc.
- Cisco Systems Inc.
- EDIMAX Technology Co. Ltd.
- Huawei Technologies Co. Ltd.
- Infineon Technologies AG
- Intel Corp.
- Juniper Networks Inc.
- MediaTek Inc.
- Microchip Technology Inc.
- NXP Semiconductors NV
- ON Semiconductor Corp.
- Qualcomm Inc.
- Samsung Electronics Co. Ltd.
- Skyworks Solutions Inc.
- Sony Group Corp.
- STMicroelectronics NV
- Texas Instruments Inc.
Qualitative and quantitative analysis of companies has been conducted to help clients understand the wider business environment as well as the strengths and weaknesses of key industry players. Data is qualitatively analyzed to categorize companies as pure play, category-focused, industry-focused, and diversified; it is quantitatively analyzed to categorize companies as dominant, leading, strong, tentative, and weak.
Research Analyst Overview
The market is witnessing significant growth as the demand for high-performance network connectivity increases across various sectors. The Internet of Things (IoT) is driving the expansion of this market, with residential, industrial, and commercial sectors adopting smart buildings and connected devices in large numbers. The industrial sector is leveraging wireless chipsets to enhance industrial automation and improve production efficiency. The need for constant bandwidth capacity and dependable communication in industrial Wi-Fi applications necessitates the use of advanced fabrication technologies such as Silicon-on-Insulator (SOI) and high-performance TCP/IP stacks. In the commercial sector, wireless chipsets are being integrated into various high-tech smart devices, including wearable tech, commercial applications, and WLAN infrastructure.
The increasing deployment of 5G networks and the proliferation of Wi-Fi hotspot solutions are also contributing to the growth of this market. The consumer electronics industry is another significant contributor to the market. With the rise of smart home applications, voice assistants, smart thermostats, smart lighting, and security cameras, there is a growing demand for wireless chipsets that offer increased range, low latency, and power efficiency. The Wi-Fi 7 ecosystem is gaining traction, with its ability to support multiple users and data-heavy services such as 4K TVs, gaming consoles, and high-speed internet. The use of MU-MIMO Wi-Fi chipsets and open-source software is enabling faster data transfer and improved network performance.
The market is driven by various factors, including the increasing number of connected devices, the need for low latency and high-speed internet, and the adoption of advanced technologies such as AR and VR. The market is also witnessing innovation in chipset design, with a focus on power efficiency, device synchronization, and chipset compatibility. The International Telecommunication Union (ITU) is playing a crucial role in standardizing Wi-Fi network technology and ensuring interoperability among various companies. The market is experiencing growth, driven by the increasing adoption of wireless technology across various sectors. The demand for high-performance network connectivity, low latency, and dependable communication is fueling the growth of this market. With the continued innovation in wireless chipset technology and the increasing deployment of 5G networks, the future looks promising for this market.
|
Market Scope |
|
|
Report Coverage |
Details |
|
Page number |
252 |
|
Base year |
2024 |
|
Historic period |
2019-2023 |
|
Forecast period |
2025-2029 |
|
Growth momentum & CAGR |
Accelerate at a CAGR of 3.6% |
|
Market growth 2025-2029 |
USD 14.87 Billion |
|
Market structure |
Fragmented |
|
YoY growth 2024-2025(%) |
3.4 |
|
Key countries |
US, China, Japan, India, Canada, UK, South Korea, Germany, France, and Australia |
|
Competitive landscape |
Leading Companies, Market Positioning of Companies, Competitive Strategies, and Industry Risks |
What are the Key Data Covered in this Wireless Chipset Market Research and Growth Report?
- CAGR of the Wireless Chipset industry during the forecast period
- Detailed information on factors that will drive the growth and forecasting between 2025 and 2029
- Precise estimation of the size of the market and its contribution of the industry in focus to the parent market
- Accurate predictions about upcoming growth and trends and changes in consumer behaviour
- Growth of the market across APAC, North America, Europe, Middle East and Africa, and South America
- Thorough analysis of the market's competitive landscape and detailed information about companies
- Comprehensive analysis of factors that will challenge the wireless chipset market growth and forecasting
We can help! Our analysts can customize this wireless chipset market research report to meet your requirements.
 RIA -
RIA - 
