Wireline Services Market Size 2024-2028
The wireline services market size is forecast to increase by USD 2.76 billion at a CAGR of 4.77% between 2023 and 2028. The market is experiencing significant growth due to the increasing demand for hydrocarbon exploration and production in offshore basins and onshore regions. With the discovery of new hydrocarbon reservoirs, the need for cabling in oil and gas fracking companies has escalated. However, the market is also facing challenges such as the decommissioning stage of mature fields and fluctuating prices of crude oil. In response, the market is witnessing advancements in technologies like sensors for improved data collection and analysis in both the cased holes and open-hole segments. The offshore segment is expected to dominate the market due to the vast exploration activities in deep-water areas.

The market plays a significant role in the oil production industry, particularly in the context of maturing oilfields. This market encompasses various services, including electric lines, slacklines, and both cased-hole and open-hole applications. Electric lines and slacklines are essential components of wireline services, which facilitate the transmission of electrical signals and data to and from wellbore sensors. These services are employed for well logging purposes, enabling oil well operators to gather critical data for assessing reservoir characteristics, production performance, and well integrity. In the oil production sector, wireline services are utilized extensively in both onshore and offshore applications.
Moreover, offshore applications, in particular, necessitate the use of specialized equipment and expertise to ensure efficient and safe operations. Field development activity and oilfield reserves are key drivers for the wireline market. Exploration projects, both onshore and offshore, rely on wireline services for gathering data during the drilling and completion phases. In the context of shale gas production and crude oil extraction, wireline services are indispensable for assessing reservoir characteristics and optimizing production. Cased-hole and open-hole applications are the primary categories of wireline services in oil production.
Furthermore, cased-hole services involve running tools through the casing string to evaluate the reservoir and wellbore conditions. Open-hole services, on the other hand, are used when the casing has not yet been installed, allowing for a more comprehensive evaluation of the formation. In conclusion, the wireline market plays a crucial role in the oil production industry by providing essential services for cased-hole and open-hole applications. These services enable oil well operators to optimize production, assess reservoir characteristics, and ensure well integrity in various oilfield environments, including onshore, offshore, shallow water, and deep water applications.
Market Segmentation
The market research report provides comprehensive data (region-wise segment analysis), with forecasts and estimates in "USD billion" for the period 2024-2028, as well as historical data from 2018-2022 for the following segments.
- Type
- Cased hole
- Open hole
- Application
- Onshore
- Offshore
- Geography
- North America
- Canada
- US
- APAC
- China
- Europe
- Germany
- UK
- Middle East and Africa
- South America
- North America
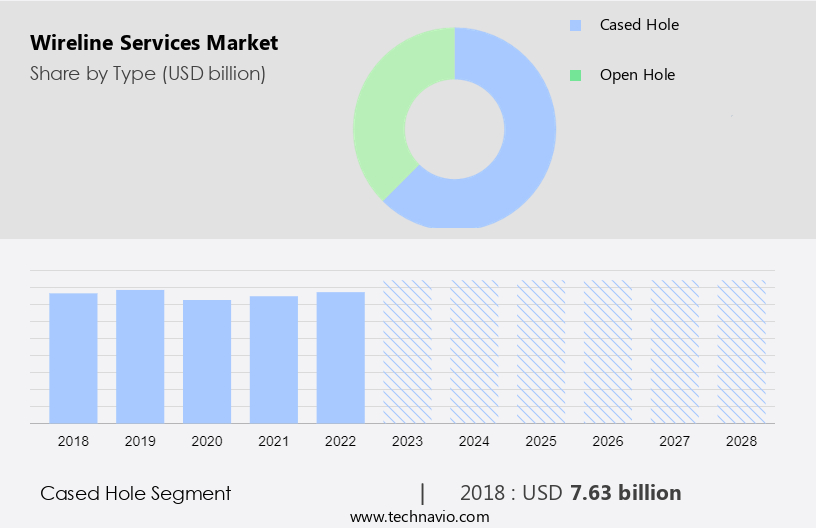
By Type Insights
The cased hole segment is estimated to witness significant growth during the forecast period. Cased hole wireline services play a vital role in the oil and gas industry for executing various operations in already cased wells. These services utilize specialized tools and equipment on a wireline cable to carry out tasks such as logging, perforating, sampling, and intervention. After the drilling and casing process, cased hole wireline operations provide essential data about the well's condition, reservoir characteristics, and production potential. Well logging, a significant application of cased hole wireline services, involves lowering sensors and measuring tools into the wellbore to assess parameters like pressure, temperature, fluid properties, and rock formations in onshore and offshore locations.
Furthermore, electrical services, including slick line and electrical line, are also crucial components of cased hole wireline operations, ensuring the proper functioning of electrical equipment in the well. Oilfield discoveries rely on these services to optimize production, enhance recovery, and ensure the safety and efficiency of oil well operations. Cased hole wireline services have gained significant importance in the industry due to their ability to provide valuable insights into the well's production potential and reservoir characteristics, ultimately contributing to the overall success of oil and gas operations.
Get a glance at the market share of various segments Request Free Sample
The cased hole segment was valued at USD 7.63 billion in 2018 and showed a gradual increase during the forecast period.
Regional Insights
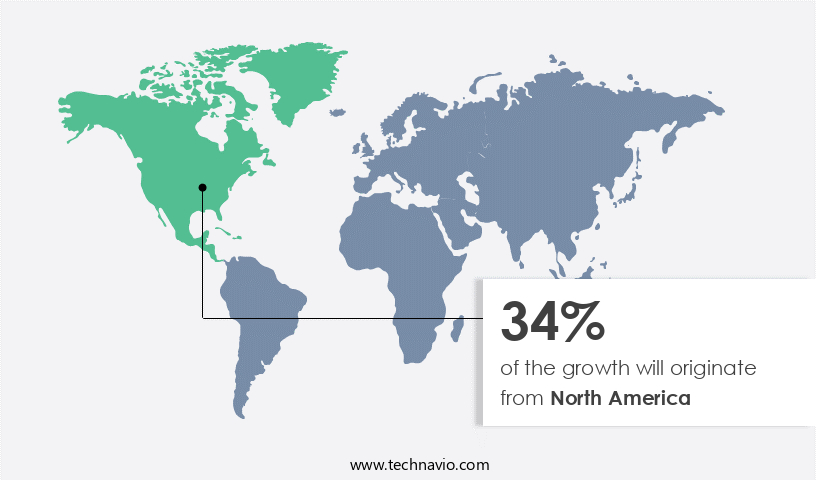
North America is estimated to contribute 34% to the growth of the global market during the forecast period. Technavio's analysts have elaborately explained the regional trends and drivers that shape the market during the forecast period.
For more insights on the market share of various regions Request Free Sample
In 2023, the United States played a pivotal role in the expansion of the market in North America. The rebound of crude oil prices and the burgeoning shale gas production in the US served as the primary catalysts for market growth in the region. The integration of advanced automation and Internet of Things (IoT) technology in the oil and gas industry is motivating rig operators in the US to implement automated drilling solutions for onshore and offshore projects. Deep water and offshore applications, specifically, are witnessing increased adoption of semi-automated technologies, enabling access to remote oil wells with challenging logistical obstacles, such as harsh weather conditions. Electricline and slickline services continue to be in high demand for well completion and maintenance activities, ensuring the efficiency and productivity of oil and gas operations in the US.
Our researchers analyzed the data with 2023 as the base year, along with the key drivers, trends, and challenges. A holistic analysis of drivers will help companies refine their marketing strategies to gain a competitive advantage.
Market Driver
Growing demand for oil and natural gas is the key driver of the market. In the United States, the oil and gas industry continues to experience significant growth due to escalating energy demand. As matured or depleted oilfields become less productive, the exploration and production of new reservoirs have become essential. Consequently, the drilling of new wells has become a priority. Wireline services play a crucial role in the oil production process, particularly in the exploration phase. These services include both cased-hole and open-hole applications, utilizing electric lines and slacklines.
Furthermore, electric line services, such as electric line logging, are employed for well logging purposes to assess the formation's geological characteristics and reservoir productivity. Similarly, slick line services are used to perform various operations, including perforating, cementing, and fishing. Wireline services are indispensable in optimizing oil and gas production, ensuring the efficient and effective extraction of resources. These services enable operators to gather valuable data, identify reservoir characteristics, and assess production potential. As the demand for oil and gas continues to rise, the importance of wireline services in the oil and gas industry will only grow.
Market Trends
Growing demand for cabling in oil and gas fracking companies is the upcoming trend in the market. The market experiences substantial growth due to the increasing demand from oil and gas companies, particularly those engaged in hydraulic fracturing or fracking. In the oil and gas sector, wireline services are essential for well intervention and reservoir assessment tasks. Fracking operations heavily rely on these services for data acquisition, logging, and perforation processes. Real-time monitoring of well conditions is facilitated through wireline services, ensuring operational efficiency and enhancing production output.
Furthermore, the exploration of unconventional hydrocarbon solvent reservoirs and the implementation of advanced drilling techniques have intensified the need for wireline services. This trend is observed across the globe, leading to a continuous expansion of the market. Key segments of the market include the cased holes and open-hole segments. Sensors play a vital role in these services, providing critical data from offshore basins and onshore and offshore hydrocarbon reservoirs during the exploration, production, and decommissioning stages.
Market Challenge
Fluctuating prices of crude oil is a key challenge affecting the market growth. Crude oil prices have significantly influenced the financial performance of upstream oil and gas companies. Notably, the price peaked at USD 115 per barrel in 2022, marking an all-time high. The decline in crude oil and natural gas prices has negatively impacted the oil and gas upstream sector in 2023. Several oil and gas exploration and production (E&P) projects were canceled or delayed worldwide due to geopolitical tensions, such as the Russia-Ukraine war and the Israel and Palestine conflict. Furthermore, the COVID-19 pandemic in 2020-2021 caused a significant slowdown in global market growth.
Furthermore, in the onshore and offshore regions, field development activities have been affected by these challenges, necessitating a deeper understanding of reservoir conditions to optimize production. Wireline service providers play a crucial role in this regard, offering essential services for reservoir characterization, well completion, and production enhancement. The ongoing price volatility underscores the importance of cost-effective and efficient wireline services to minimize operational risks and maximize returns for oil and gas companies.
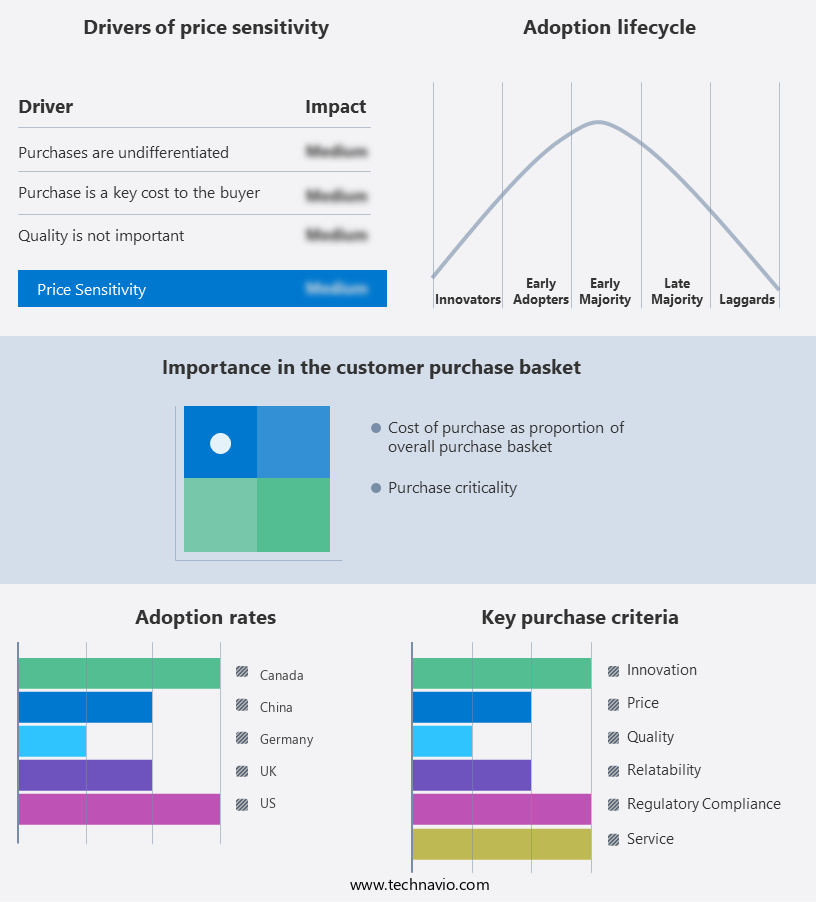
Exclusive Customer Landscape
The market forecasting report includes the adoption lifecycle of the market, covering from the innovator's stage to the laggard's stage. It focuses on adoption rates in different regions based on penetration. Furthermore, the report also includes key purchase criteria and drivers of price sensitivity to help companies evaluate and develop their market growth analysis strategies.
Customer Landscape
Key Companies & Market Insights
Companies are implementing various strategies, such as strategic alliances, partnerships, mergers and acquisitions, geographical expansion, and product/service launches, to enhance their presence in the market.
Archer Ltd. - The company offers wireline services such as cased hole logging services, conveyance and mechanical services, and deepwell.
The market research and growth report includes detailed analyses of the competitive landscape of the market and information about key companies, including:
- Baker Hughes Co.
- Caterpillar Inc.
- Emerson Electric Co.
- Expro Group Holdings NV
- Halliburton Co.
- MB Petroleum Services LLC
- Nabors Industries Ltd.
- NOV Inc.
- Patterson UTI Energy Inc.
- Petrofac Ltd.
- Schlumberger Ltd.
- Schneider Electric SE
- SGS SA
- Siemens AG
- Superior Energy Services Inc.
- TechnipFMC plc
- Weatherford International Plc
- Welltec group
Qualitative and quantitative analysis of companies has been conducted to help clients understand the wider business environment as well as the strengths and weaknesses of key market players. Data is qualitatively analyzed to categorize companies as pure play, category-focused, industry-focused, and diversified; it is quantitatively analyzed to categorize companies as dominant, leading, strong, tentative, and weak.
Research Analyst Overview
Wireline services play a crucial role in the oil and gas industry, particularly in oil production from maturing oilfields. These services involve the use of electric lines and slacklines for various well intervention and completion activities, including cased-hole and open-hole applications. Electric line services are employed for well logging purposes to enhance reservoir understanding during field development activity. Both onshore and offshore locations utilize wireline services for crude oil production. In the offshore region, wireline service providers cater to exploration projects in offshore basins, focusing on hydrocarbon reservoirs in shallow and deep water. The decommissioning stage also requires wireline services for intervention and completion activities.
Furthermore, sensors integrated into wireline tools provide valuable data for oil well operators to optimize drilling projects and oilfield reserves. The offshore production sector, including the aviation-fuel industry and power industry, relies on wireline services for offshore applications. Oilfield services companies offer a range of wireline solutions, including electricline and slickline services, for drilling projects and well service requirements. The cased holes segment and open-hole segment of the market benefit from wireline services, with the former focusing on the installation and retrieval of production casing and the latter on open-hole completions. The integration of smart digitized devices and alternative energy sources, such as renewable energy, is driving innovation in the market.
|
Market Scope |
|
|
Report Coverage |
Details |
|
Page number |
162 |
|
Base year |
2023 |
|
Historic period |
2018-2022 |
|
Forecast period |
2024-2028 |
|
Growth momentum & CAGR |
Accelerate at a CAGR of 4.77% |
|
Market growth 2024-2028 |
USD 2.76 billion |
|
Market structure |
Fragmented |
|
YoY growth 2023-2024(%) |
4.07 |
|
Regional analysis |
North America, APAC, Europe, Middle East and Africa, and South America |
|
Performing market contribution |
North America at 34% |
|
Key countries |
US, Canada, China, UK, and Germany |
|
Competitive landscape |
Leading Companies, Market Positioning of Companies, Competitive Strategies, and Industry Risks |
|
Key companies profiled |
Archer Ltd., Baker Hughes Co., Caterpillar Inc., Emerson Electric Co., Expro Group Holdings NV, Halliburton Co., MB Petroleum Services LLC, Nabors Industries Ltd., NOV Inc., Patterson UTI Energy Inc., Petrofac Ltd., Schlumberger Ltd., Schneider Electric SE, SGS SA, Siemens AG, Superior Energy Services Inc., TechnipFMC plc, Weatherford International Plc, and Welltec group |
|
Market dynamics |
Parent market analysis, market growth inducers and obstacles, market forecast, fast-growing and slow-growing segment analysis, COVID-19 impact and recovery analysis and future consumer dynamics, market condition analysis for the forecast period |
|
Customization purview |
If our market report has not included the data that you are looking for, you can reach out to our analysts and get segments customized. |
What are the Key Data Covered in this Market Research and Growth Report?
- CAGR of the market during the forecast period
- Detailed information on factors that will drive the market growth and forecasting between 2024 and 2028
- Precise estimation of the size of the market and its contribution of the market in focus to the parent market
- Accurate predictions about upcoming market growth and trends and changes in consumer behaviour
- Growth of the market across North America, APAC, Europe, Middle East and Africa, and South America
- Thorough analysis of the market's competitive landscape and detailed information about companies
- Comprehensive analysis of factors that will challenge the growth of market companies
We can help! Our analysts can customize this market research report to meet your requirements. Get in touch
 RIA -
RIA - 
