Workspace Aggregator Market Analysis North America, Europe, APAC, South America, Middle East and Africa - US, China, Japan, Germany, UK - Size and Forecast 2024-2028

Workspace Aggregator Market Analysis North America, Europe, APAC, South America, Middle East and Africa - US, China, Japan, Germany, UK - Size and Forecast 2024-2028

Published: Dec 2023 169 Pages SKU: IRTNTR77064

Market Overview at a Glance

$2.13 B
Market Opportunity
10.92%
CAGR
9.82
YoY growth 2023-2024(%)

Workspace Aggregator Market Size 2024-2028

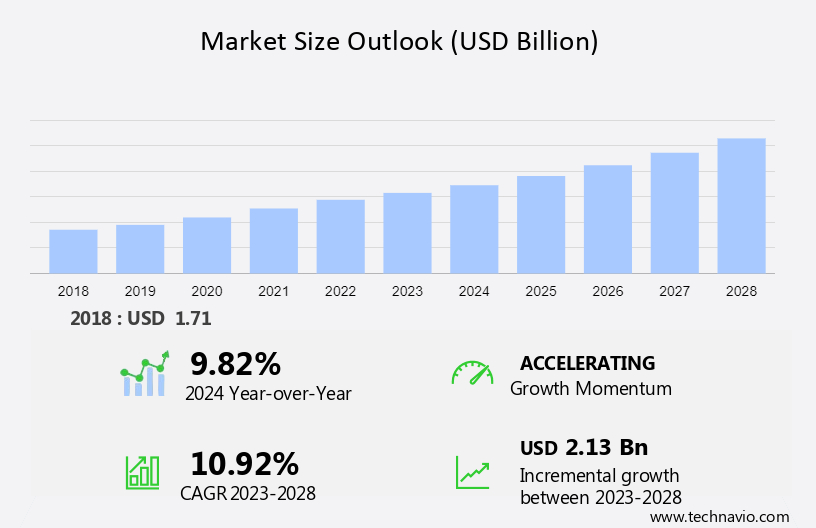
The workspace aggregator market size is forecast to increase by USD 2.13 billion at a CAGR of 10.92% between 2023 and 2028.

  • The market is experiencing significant growth due to several key trends. The increasing number of startups and small businesses is driving the demand for flexible and cost-effective workspace solutions. Additionally, the need for optimized space planning and utilization is becoming increasingly important for businesses to reduce overhead costs and improve productivity. Furthermore, integrated solutions that combine the Internet of Things (IoT), Artificial Intelligence (AI), and digital work environments are gaining popularity in modern workplaces, enhancing flexibility, productivity, and teamwork.  However, a lack of adequate technological skill sets among businesses can hinder the adoption of advanced workspace aggregator solutions. This market analysis report provides an in-depth examination of these trends and their impact on the market. It also offers insights into potential challenges and opportunities for market participants. By staying informed of these trends and factors, businesses can make informed decisions and capitalize on the growing demand for workspace aggregator services.

What will be the Size of the Workspace Aggregator Market During the Forecast Period?

Workspace Aggregator Market Size

 Request Free Sample

  • The market encompasses a range of solutions that integrate and manage various digital resources, including IoT devices, AI applications, cloud-based and on-premise IT and telecom systems, and digital work environments. These solutions provide users with centralized access to corporate resources such as virtual desktops, web and client applications, and mobile apps. The market is experiencing significant growth as modern workplaces increasingly adopt integrated solutions for improved accessibility, user experience, and location independence. Key trends In the market include the integration of healthcare systems, the use of operating systems and centralized platforms, and the adoption of virtual desktops and cloud services.
  • Additionally, the market is seeing increased focus on user experience and location-agnostic access to digital resources through web browsers, client apps, and mobile apps. Overall, the market is a dynamic and evolving landscape that is essential for enterprises seeking to optimize their digital environments and enhance productivity.

How is this Workspace Aggregator Industry segmented and which is the largest segment?

The industry research report provides comprehensive data (region-wise segment analysis), with forecasts and estimates in "USD billion" for the period 2024-2028, as well as historical data from 2018-2022 for the following segments.
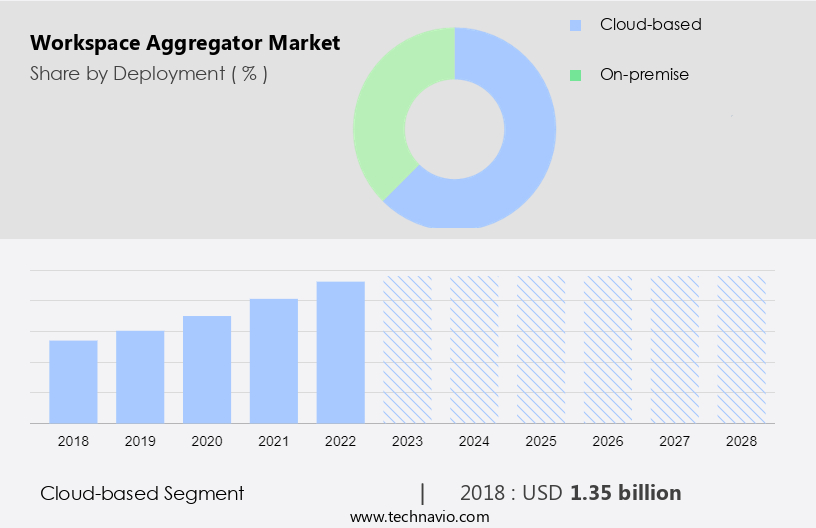
  • Deployment
    • Cloud-based
    • On-premise
  • End-user
    • Retail
    • IT and telecom
    • Healthcare
    • Others
  • Geography
    • North America
      • US
    • Europe
      • Germany
      • UK
    • APAC
      • China
      • Japan
    • South America
    • Middle East and Africa

By Deployment Insights

  • The cloud-based segment is estimated to witness significant growth during the forecast period.

The market is primarily driven by the cloud-based segment due to the increasing adoption of cloud services among Small and Medium Enterprises (SMEs) and the expansion of cloud services in developing regions. Cloud technology enables workspace aggregators to store, share files, and manage user data, ensuring scalability and accessibility from any device. It also facilitates quick application development and deployment within existing software infrastructure for business organizations. Workspace aggregators offer a centralized platform for digital resources, including virtual desktops, on-premises software, cloud-based apps, communication tools, and on-demand meeting rooms.

These all-inclusive solutions provide user-friendly experiences, context-related safety functions, and value-added benefits, such as hyper-personalization, workspace recommendations, and frictionless integration. Additionally, the integration of financial statements, talent platforms, and physical workspace options caters to the needs of a hybrid workforce, including co-working memberships and virtual workspaces. The market's strengths include agility, mobility, and enterprises' growing need for seamless convergence of IT and telecom, healthcare, and other functional areas. However, challenges include IT security concerns, endpoint management, and the potential impact of shadow IT on computer environments. Platform-as-a-Service, digital workstations, and streaming web apps are key areas of innovation In the market.

Workspace Aggregator Market Size

Get a glance at the Workspace Aggregator Industry report of share of various segments Request Free Sample

The cloud-based segment was valued at USD 1.35 bn in 2018 and showed a gradual increase during the forecast period.

Regional Analysis

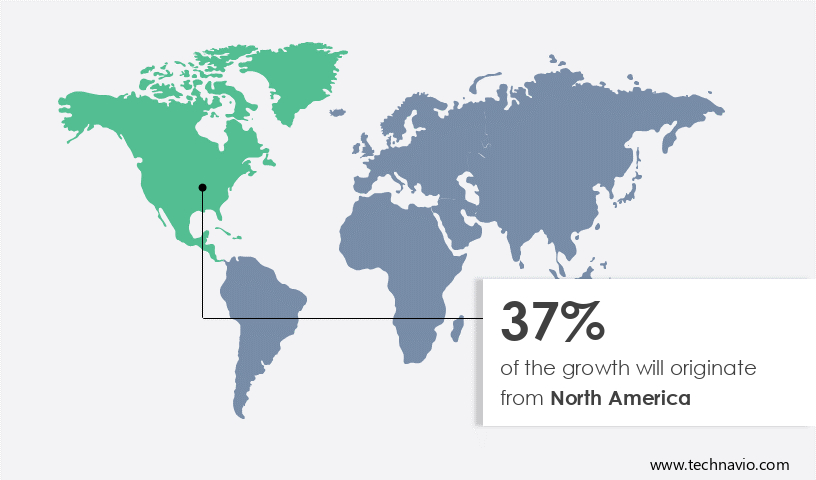
  • North America is estimated to contribute 37% to the growth of the global market during the forecast period.

Technavio's analysts have elaborately explained the regional trends and drivers that shape the market during the forecast period.

Workspace Aggregator Market Share by Geography

For more insights on the market share of various regions, Request Free Sample

The market in North America is currently leading in terms of revenue share due to the high adoption rate among small and medium-sized enterprises (SMEs) seeking flexible workspaces for their operations. The region's growth is driven by the increasing demand for co-working spaces, urbanization, and the proliferation of startups. With nearly 40% of the US workforce expected to consist of freelancers, independent contractors, and solopreneurs by 2020, the preference for affordable and flexible workspaces continues to rise. Workspace aggregators offer integrated solutions, including IoT, AI, cloud-based, on-premise, IT, telecom, healthcare, and digital work environments, providing modern workplaces with devices, applications, accessibility, and user experience.

Furthermore, these all-inclusive solutions offer scalability, integration capabilities, and value-added benefits, such as workspace recommendations, frictionless integration, and context-related safety functions. Workspace aggregators provide a centralized platform for digital resources, virtual desktops, on-premises software, cloud-based apps, communication tools, and convergence, enabling flexibility, productivity, teamwork, and organizational agility. Workspace aggregators offer a portal-like user experience, functional areas, application delivery, and company data management, making them an essential tool for modern enterprises.

Market Dynamics

Our researchers analyzed the data with 2023 as the base year, along with the key drivers, trends, and challenges. A holistic analysis of drivers will help companies refine their marketing strategies to gain a competitive advantage.

What are the key market drivers leading to the rise In the adoption of Workspace Aggregator Industry?

An increasing number of startups and the adoption of co-working is the key driver of the market.

  • Workspace aggregators are revolutionizing modern workplaces by providing integrated solutions that cater to the evolving needs of businesses, particularly startups. These cloud-based and on-premise platforms offer a centralized platform for managing digital resources, including virtual desktops, on-premises software, and cloud-based apps. The convergence of IoT, AI, and telecom technologies enables user-friendly digital work environments that enhance accessibility and improve user experience. Workspace aggregators offer flexibility and productivity tools for teamwork, communication, and organization scalability. Their integration capabilities enable the seamless use of communication tools, calendars, and collaboration platforms, while also supporting physical workspace options such as co-working memberships, virtual workspaces, and on-demand meeting rooms.
  • Moreover, workspace aggregators provide value-added benefits like workspace recommendations, frictionless integration, and context-related safety functions, ensuring optimum usability and value for businesses. They offer strengths in areas such as application delivery, IT security, and endpoint management, making them a vital component of IT architecture for enterprises. Innovative workspace aggregators provide all-inclusive solutions that cater to various functional areas, including finance, HR, and marketing. They offer hyper-personalization, allowing users to customize their digital workstations with streaming web apps, desktops, and agility and mobility features. By offering a portal-like user experience, these platforms enable easy configuration and portability, making them an essential business strategy for organizations with hybrid workforces.

What are the market trends shaping the Workspace Aggregator Industry?

Increased need for optimized space planning is the upcoming market trend.

  • Workspace aggregators are essential tools for organizations seeking to optimize their physical and digital work environments. These solutions integrate IoT sensors, AI, and cloud-based or on-premise IT and telecom infrastructure to create digital workspaces that enhance accessibility, user experience, and productivity. With the rise of modern workplaces, the need for integrated solutions that support various devices, applications, and communication tools has become crucial. Workspace aggregators offer centralized platforms for managing digital resources, including virtual desktops, on-premises software, and cloud-based apps. They enable flexibility and teamwork by providing converged communication platforms, calendars, and on-demand meeting rooms. Additionally, they offer strengths such as scalability, integration capabilities, and all-inclusive solutions that cater to the needs of hybrid workforces.
  • Moreover, workspace aggregators facilitate the use of co-working memberships, virtual workspaces, and talent platforms. They provide value-added benefits, such as context-related safety functions and optimum usability, ensuring a frictionless user experience. Lenovo Software's mobile working solutions, for instance, enable employees to access company data and work tools from any device, operating system, or location. By integrating with various devices, operating systems, and applications, workspace aggregators provide a strong and agile solution for enterprises.

What challenges does the Workspace Aggregator Industry face during its growth?

Lack of adequate technological skill sets is a key challenge affecting the industry growth.

  • The market is experiencing growth as organizations seek to optimize their digital work environments for modern workplaces. IoT, AI, and cloud-based technologies are driving the convergence of IT and telecom, healthcare, and other industries towards integrated solutions. Workspace aggregators offer centralized platforms for managing digital resources, including virtual desktops, on-premises software, and cloud-based apps. However, the adoption of workspace aggregators faces challenges. End-users require adequate training to effectively use advanced features, such as AI and analytics, which some companies provide. The lack of proper training and funding for recruiting trained professionals can hinder the adoption of these solutions.
  • Additionally, the complexity of integrating various devices, applications, and communication tools can pose challenges for organizations. Despite these challenges, the benefits of workspace aggregators are significant. They offer flexibility, productivity, teamwork, and scalability, making them essential for organizations seeking to manage their digital workspaces effectively. Workspace aggregators provide all-inclusive solutions, including Hyper-Personalization, workspace recommendations, and Frictionless Integration, to enhance the user experience. They offer value-added benefits, such as context-related safety functions, optimum usability, and accessibility, making them a Cutting Edge business strategy for enterprises. Workspace aggregators support various functional areas, including Application Delivery, company data, and communication platforms.

Exclusive Customer Landscape

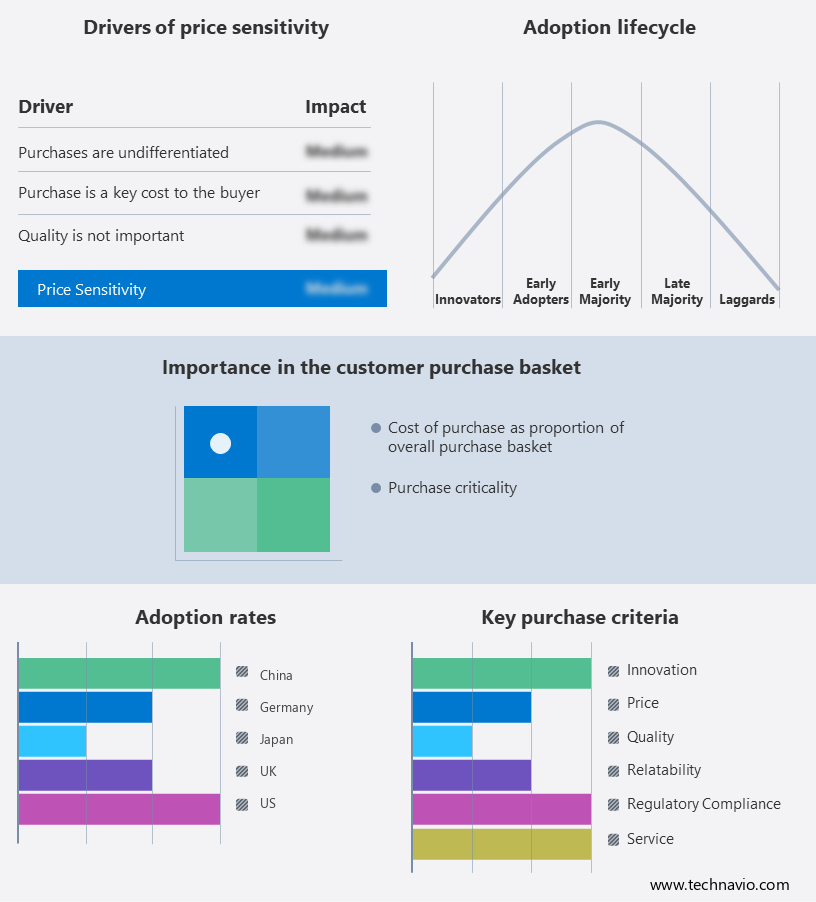
The market forecasting report includes the adoption lifecycle of the market, covering from the innovator's stage to the laggard's stage. It focuses on adoption rates in different regions based on penetration. Furthermore, the market report also includes key purchase criteria and drivers of price sensitivity to help companies evaluate and develop their market growth analysis strategies.

Workspace Aggregator Market Share by Geography

 Customer Landscape

Key Companies & Market Insights

Companies are implementing various strategies, such as strategic alliances, workspace aggregator market forecast, partnerships, mergers and acquisitions, geographical expansion, and product/service launches, to enhance their presence In the industry.

The industry research and growth report includes detailed analyses of the competitive landscape of the market and information about key companies, including:

  • Amazon.com Inc.
  •  Amtel Systems Corp.
  • AO Kaspersky Lab
  • BlackBerry Ltd.
  • Cisco Systems Inc.
  • Citrix Systems Inc.
  • FATbit Technologies
  • Gartner Inc.
  • Hewlett Packard Enterprise Co.
  • International Business Machines Corp.
  • Ivanti Software Inc.
  • Juniper Networks Inc.
  • KHIKA
  • Microsoft Corp.
  • Oracle Corp.
  • SAP SE
  • ServiceNow Inc.
  • Sophos Ltd.
  • Splunk Inc.
  • VMware Inc.

Qualitative and quantitative analysis of companies has been conducted to help clients understand the wider business environment as well as the strengths and weaknesses of key industry players. Data is qualitatively analyzed to categorize companies as pure play, category-focused, industry-focused, and diversified; it is quantitatively analyzed to categorize companies as dominant, leading, strong, tentative, and weak.

Research Analyst Overview

The market is experiencing significant growth as organizations seek to streamline their digital environments and enhance productivity. This market encompasses a range of solutions designed to integrate and manage various digital resources, including cloud-based and on-premises applications, virtual desktops, communication tools, and physical workspace options. These solutions offer numerous benefits to modern organizations. For instance, they provide a centralized platform for accessing all digital workspaces, enabling users to work from anywhere, at any time, using a variety of devices. The convergence of IT and telecom, healthcare, and other functional areas has led to an increased demand for integrated solutions that can support the diverse needs of today's workforce.

Moreover, the user experience is a critical consideration In the selection of workspace aggregator solutions. A portal-like user experience, coupled with strong APIs, allows for frictionless integration of work tools and applications. Additionally, context-related safety functions ensure optimum usability and value-added benefits for users. The flexibility of workspace aggregators is another significant advantage. They offer scalability and integration capabilities, making it easy for organizations to add or remove workspaces as needed. All-inclusive solutions provide access to digital resources, virtual workspaces, on-demand meeting rooms, talent platforms, and financial statements, among other features. Hyper-personalization is a key trend In the market, with solutions offering workspace recommendations based on user behavior and preferences.

Furthermore, this level of customization enhances productivity and engagement, making it easier for teams to collaborate and work effectively. The market is highly competitive, with many players offering cutting-edge solutions that cater to the unique needs of different industries and organizations. Operating systems, location, and corporate resources are just a few of the factors that influence the selection of a workspace aggregator. Cloud services, web browsers, client apps, and mobile apps are essential components of workspace aggregators, enabling users to access their digital workspaces from anywhere, using any device. Native applications and web applications offer additional functionality and customization options.

Market Scope

Report Coverage

Details

Page number

169

Base year

2023

Historic period

2018-2022

Forecast period

2024-2028

Growth momentum & CAGR

Accelerate at a CAGR of 10.92%

Market Growth 2024-2028

USD 2.13 billion

Market structure

Fragmented

YoY growth 2023-2024(%)

9.82

Key countries

US, China, Japan, Germany, and UK

Competitive landscape

Leading Companies, Market Positioning of Companies, Competitive Strategies, and Industry Risks

Request Free Sample

What are the Key Data Covered in this Workspace Aggregator Market Research and Growth Report?

  • CAGR of the Workspace Aggregator industry during the forecast period
  • Detailed information on factors that will drive the market growth and forecasting between 2024 and 2028
  • Precise estimation of the size of the market and its contribution to the industry in focus on the parent market
  • Accurate predictions about upcoming growth and trends and changes in consumer behaviour
  • Growth of the market across North America, Europe, APAC, South America, and Middle East and Africa
  • Thorough analysis of the market's competitive landscape and detailed information about companies
  • Comprehensive analysis of factors that will challenge the workspace aggregator market growth of industry companies

We can help! Our analysts can customize this workspace aggregator market research report to meet your requirements.

Get in touch

1 Executive Summary

  • 1.1 Market overview
    • Exhibit 01: Executive Summary – Chart on Market Overview
    • Exhibit 02: Executive Summary – Data Table on Market Overview
    • Exhibit 03: Executive Summary – Chart on Global Market Characteristics
    • Exhibit 04: Executive Summary – Chart on Market by Geography
    • Exhibit 05: Executive Summary – Chart on Market Segmentation by Deployment
    • Exhibit 06: Executive Summary – Chart on Market Segmentation by End-user
    • Exhibit 07: Executive Summary – Chart on Incremental Growth
    • Exhibit 08: Executive Summary – Data Table on Incremental Growth
    • Exhibit 09: Executive Summary – Chart on Vendor Market Positioning

2 Market Landscape

  • 2.1 Market ecosystem
    • Exhibit 10: Parent market
    • Exhibit 11: Market Characteristics

3 Market Sizing

  • 3.1 Market definition
    • Exhibit 12: Offerings of vendors included in the market definition
  • 3.2 Market segment analysis
    • Exhibit 13: Market segments
  • 3.3 Market size 2023
    • 3.4 Market outlook: Forecast for 2023-2028
      • Exhibit 14: Chart on Global - Market size and forecast 2023-2028 ($ billion)
      • Exhibit 15: Data Table on Global - Market size and forecast 2023-2028 ($ billion)
      • Exhibit 16: Chart on Global Market: Year-over-year growth 2023-2028 (%)
      • Exhibit 17: Data Table on Global Market: Year-over-year growth 2023-2028 (%)

    4 Historic Market Size

    • 4.1 Global workspace aggregator market 2018 - 2022
      • Exhibit 18: Historic Market Size – Data Table on global workspace aggregator market 2018 - 2022 ($ billion)
    • 4.2 Deployment Segment Analysis 2018 - 2022
      • Exhibit 19: Historic Market Size – Deployment Segment 2018 - 2022 ($ billion)
    • 4.3 End-user Segment Analysis 2018 - 2022
      • Exhibit 20: Historic Market Size – End-user Segment 2018 - 2022 ($ billion)
    • 4.4 Geography Segment Analysis 2018 - 2022
      • Exhibit 21: Historic Market Size – Geography Segment 2018 - 2022 ($ billion)
    • 4.5 Country Segment Analysis 2018 - 2022
      • Exhibit 22: Historic Market Size – Country Segment 2018 - 2022 ($ billion)

    5 Five Forces Analysis

    • 5.1 Five forces summary
      • Exhibit 23: Five forces analysis - Comparison between 2023 and 2028
    • 5.2 Bargaining power of buyers
      • Exhibit 24: Chart on Bargaining power of buyers – Impact of key factors 2023 and 2028
    • 5.3 Bargaining power of suppliers
      • Exhibit 25: Bargaining power of suppliers – Impact of key factors in 2023 and 2028
    • 5.4 Threat of new entrants
      • Exhibit 26: Threat of new entrants – Impact of key factors in 2023 and 2028
    • 5.5 Threat of substitutes
      • Exhibit 27: Threat of substitutes – Impact of key factors in 2023 and 2028
    • 5.6 Threat of rivalry
      • Exhibit 28: Threat of rivalry – Impact of key factors in 2023 and 2028
    • 5.7 Market condition
      • Exhibit 29: Chart on Market condition - Five forces 2023 and 2028

    6 Market Segmentation by Deployment

    • 6.1 Market segments
      • Exhibit 30: Chart on Deployment - Market share 2023-2028 (%)
      • Exhibit 31: Data Table on Deployment - Market share 2023-2028 (%)
    • 6.2 Comparison by Deployment
      • Exhibit 32: Chart on Comparison by Deployment
      • Exhibit 33: Data Table on Comparison by Deployment
    • 6.3 Cloud-based - Market size and forecast 2023-2028
      • Exhibit 34: Chart on Cloud-based - Market size and forecast 2023-2028 ($ billion)
      • Exhibit 35: Data Table on Cloud-based - Market size and forecast 2023-2028 ($ billion)
      • Exhibit 36: Chart on Cloud-based - Year-over-year growth 2023-2028 (%)
      • Exhibit 37: Data Table on Cloud-based - Year-over-year growth 2023-2028 (%)
    • 6.4 On-premise - Market size and forecast 2023-2028
      • Exhibit 38: Chart on On-premise - Market size and forecast 2023-2028 ($ billion)
      • Exhibit 39: Data Table on On-premise - Market size and forecast 2023-2028 ($ billion)
      • Exhibit 40: Chart on On-premise - Year-over-year growth 2023-2028 (%)
      • Exhibit 41: Data Table on On-premise - Year-over-year growth 2023-2028 (%)
    • 6.5 Market opportunity by Deployment
      • Exhibit 42: Market opportunity by Deployment ($ billion)
      • Exhibit 43: Data Table on Market opportunity by Deployment ($ billion)

    7 Market Segmentation by End-user

    • 7.1 Market segments
      • Exhibit 44: Chart on End-user - Market share 2023-2028 (%)
      • Exhibit 45: Data Table on End-user - Market share 2023-2028 (%)
    • 7.2 Comparison by End-user
      • Exhibit 46: Chart on Comparison by End-user
      • Exhibit 47: Data Table on Comparison by End-user
    • 7.3 Retail - Market size and forecast 2023-2028
      • Exhibit 48: Chart on Retail - Market size and forecast 2023-2028 ($ billion)
      • Exhibit 49: Data Table on Retail - Market size and forecast 2023-2028 ($ billion)
      • Exhibit 50: Chart on Retail - Year-over-year growth 2023-2028 (%)
      • Exhibit 51: Data Table on Retail - Year-over-year growth 2023-2028 (%)
    • 7.4 IT and telecom - Market size and forecast 2023-2028
      • Exhibit 52: Chart on IT and telecom - Market size and forecast 2023-2028 ($ billion)
      • Exhibit 53: Data Table on IT and telecom - Market size and forecast 2023-2028 ($ billion)
      • Exhibit 54: Chart on IT and telecom - Year-over-year growth 2023-2028 (%)
      • Exhibit 55: Data Table on IT and telecom - Year-over-year growth 2023-2028 (%)
    • 7.5 Healthcare - Market size and forecast 2023-2028
      • Exhibit 56: Chart on Healthcare - Market size and forecast 2023-2028 ($ billion)
      • Exhibit 57: Data Table on Healthcare - Market size and forecast 2023-2028 ($ billion)
      • Exhibit 58: Chart on Healthcare - Year-over-year growth 2023-2028 (%)
      • Exhibit 59: Data Table on Healthcare - Year-over-year growth 2023-2028 (%)
    • 7.6 Others - Market size and forecast 2023-2028
      • Exhibit 60: Chart on Others - Market size and forecast 2023-2028 ($ billion)
      • Exhibit 61: Data Table on Others - Market size and forecast 2023-2028 ($ billion)
      • Exhibit 62: Chart on Others - Year-over-year growth 2023-2028 (%)
      • Exhibit 63: Data Table on Others - Year-over-year growth 2023-2028 (%)
    • 7.7 Market opportunity by End-user
      • Exhibit 64: Market opportunity by End-user ($ billion)
      • Exhibit 65: Data Table on Market opportunity by End-user ($ billion)

    8 Customer Landscape

    • 8.1 Customer landscape overview
      • Exhibit 66: Analysis of price sensitivity, lifecycle, customer purchase basket, adoption rates, and purchase criteria

    9 Geographic Landscape

    • 9.1 Geographic segmentation
      • Exhibit 67: Chart on Market share by geography 2023-2028 (%)
      • Exhibit 68: Data Table on Market share by geography 2023-2028 (%)
    • 9.2 Geographic comparison
      • Exhibit 69: Chart on Geographic comparison
      • Exhibit 70: Data Table on Geographic comparison
    • 9.3 North America - Market size and forecast 2023-2028
      • Exhibit 71: Chart on North America - Market size and forecast 2023-2028 ($ billion)
      • Exhibit 72: Data Table on North America - Market size and forecast 2023-2028 ($ billion)
      • Exhibit 73: Chart on North America - Year-over-year growth 2023-2028 (%)
      • Exhibit 74: Data Table on North America - Year-over-year growth 2023-2028 (%)
    • 9.4 Europe - Market size and forecast 2023-2028
      • Exhibit 75: Chart on Europe - Market size and forecast 2023-2028 ($ billion)
      • Exhibit 76: Data Table on Europe - Market size and forecast 2023-2028 ($ billion)
      • Exhibit 77: Chart on Europe - Year-over-year growth 2023-2028 (%)
      • Exhibit 78: Data Table on Europe - Year-over-year growth 2023-2028 (%)
    • 9.5 APAC - Market size and forecast 2023-2028
      • Exhibit 79: Chart on APAC - Market size and forecast 2023-2028 ($ billion)
      • Exhibit 80: Data Table on APAC - Market size and forecast 2023-2028 ($ billion)
      • Exhibit 81: Chart on APAC - Year-over-year growth 2023-2028 (%)
      • Exhibit 82: Data Table on APAC - Year-over-year growth 2023-2028 (%)
    • 9.6 South America - Market size and forecast 2023-2028
      • Exhibit 83: Chart on South America - Market size and forecast 2023-2028 ($ billion)
      • Exhibit 84: Data Table on South America - Market size and forecast 2023-2028 ($ billion)
      • Exhibit 85: Chart on South America - Year-over-year growth 2023-2028 (%)
      • Exhibit 86: Data Table on South America - Year-over-year growth 2023-2028 (%)
    • 9.7 Middle East and Africa - Market size and forecast 2023-2028
      • Exhibit 87: Chart on Middle East and Africa - Market size and forecast 2023-2028 ($ billion)
      • Exhibit 88: Data Table on Middle East and Africa - Market size and forecast 2023-2028 ($ billion)
      • Exhibit 89: Chart on Middle East and Africa - Year-over-year growth 2023-2028 (%)
      • Exhibit 90: Data Table on Middle East and Africa - Year-over-year growth 2023-2028 (%)
    • 9.8 US - Market size and forecast 2023-2028
      • Exhibit 91: Chart on US - Market size and forecast 2023-2028 ($ billion)
      • Exhibit 92: Data Table on US - Market size and forecast 2023-2028 ($ billion)
      • Exhibit 93: Chart on US - Year-over-year growth 2023-2028 (%)
      • Exhibit 94: Data Table on US - Year-over-year growth 2023-2028 (%)
    • 9.9 China - Market size and forecast 2023-2028
      • Exhibit 95: Chart on China - Market size and forecast 2023-2028 ($ billion)
      • Exhibit 96: Data Table on China - Market size and forecast 2023-2028 ($ billion)
      • Exhibit 97: Chart on China - Year-over-year growth 2023-2028 (%)
      • Exhibit 98: Data Table on China - Year-over-year growth 2023-2028 (%)
    • 9.10 Germany - Market size and forecast 2023-2028
      • Exhibit 99: Chart on Germany - Market size and forecast 2023-2028 ($ billion)
      • Exhibit 100: Data Table on Germany - Market size and forecast 2023-2028 ($ billion)
      • Exhibit 101: Chart on Germany - Year-over-year growth 2023-2028 (%)
      • Exhibit 102: Data Table on Germany - Year-over-year growth 2023-2028 (%)
    • 9.11 Japan - Market size and forecast 2023-2028
      • Exhibit 103: Chart on Japan - Market size and forecast 2023-2028 ($ billion)
      • Exhibit 104: Data Table on Japan - Market size and forecast 2023-2028 ($ billion)
      • Exhibit 105: Chart on Japan - Year-over-year growth 2023-2028 (%)
      • Exhibit 106: Data Table on Japan - Year-over-year growth 2023-2028 (%)
    • 9.12 UK - Market size and forecast 2023-2028
      • Exhibit 107: Chart on UK - Market size and forecast 2023-2028 ($ billion)
      • Exhibit 108: Data Table on UK - Market size and forecast 2023-2028 ($ billion)
      • Exhibit 109: Chart on UK - Year-over-year growth 2023-2028 (%)
      • Exhibit 110: Data Table on UK - Year-over-year growth 2023-2028 (%)
    • 9.13 Market opportunity by geography
      • Exhibit 111: Market opportunity by geography ($ billion)
      • Exhibit 112: Data Tables on Market opportunity by geography ($ billion)

    10 Drivers, Challenges, and Trends

    • 10.1 Market drivers
      • 10.2 Market challenges
        • 10.3 Impact of drivers and challenges
          • Exhibit 113: Impact of drivers and challenges in 2023 and 2028
        • 10.4 Market trends

          11 Vendor Landscape

          • 11.1 Overview
            • 11.2 Vendor landscape
              • Exhibit 114: Overview on Criticality of inputs and Factors of differentiation
            • 11.3 Landscape disruption
              • Exhibit 115: Overview on factors of disruption
            • 11.4 Industry risks
              • Exhibit 116: Impact of key risks on business

            12 Vendor Analysis

            • 12.1 Vendors covered
              • Exhibit 117: Vendors covered
            • 12.2 Market positioning of vendors
              • Exhibit 118: Matrix on vendor position and classification
            • 12.3 Amazon.com Inc.
              • Exhibit 119: Amazon.com Inc. - Overview
              • Exhibit 120: Amazon.com Inc. - Business segments
              • Exhibit 121: Amazon.com Inc. - Key news
              • Exhibit 122: Amazon.com Inc. - Key offerings
              • Exhibit 123: Amazon.com Inc. - Segment focus
            • 12.4 BlackBerry Ltd.
              • Exhibit 124: BlackBerry Ltd. - Overview
              • Exhibit 125: BlackBerry Ltd. - Business segments
              • Exhibit 126: BlackBerry Ltd. - Key offerings
              • Exhibit 127: BlackBerry Ltd. - Segment focus
            • 12.5 Cisco Systems Inc.
              • Exhibit 128: Cisco Systems Inc. - Overview
              • Exhibit 129: Cisco Systems Inc. - Business segments
              • Exhibit 130: Cisco Systems Inc. - Key news
              • Exhibit 131: Cisco Systems Inc. - Key offerings
              • Exhibit 132: Cisco Systems Inc. - Segment focus
            • 12.6 Citrix Systems Inc.
              • Exhibit 133: Citrix Systems Inc. - Overview
              • Exhibit 134: Citrix Systems Inc. - Product / Service
              • Exhibit 135: Citrix Systems Inc. - Key offerings
            • 12.7 FATbit Technologies
              • Exhibit 136: FATbit Technologies - Overview
              • Exhibit 137: FATbit Technologies - Product / Service
              • Exhibit 138: FATbit Technologies - Key offerings
            • 12.8 Gartner Inc.
              • Exhibit 139: Gartner Inc. - Overview
              • Exhibit 140: Gartner Inc. - Business segments
              • Exhibit 141: Gartner Inc. - Key offerings
              • Exhibit 142: Gartner Inc. - Segment focus
            • 12.9 Ivanti Software Inc.
              • Exhibit 143: Ivanti Software Inc. - Overview
              • Exhibit 144: Ivanti Software Inc. - Product / Service
              • Exhibit 145: Ivanti Software Inc. - Key offerings
            • 12.10 KHIKA
              • Exhibit 146: KHIKA - Overview
              • Exhibit 147: KHIKA - Product / Service
              • Exhibit 148: KHIKA - Key offerings
            • 12.11 Microsoft Corp.
              • Exhibit 149: Microsoft Corp. - Overview
              • Exhibit 150: Microsoft Corp. - Business segments
              • Exhibit 151: Microsoft Corp. - Key news
              • Exhibit 152: Microsoft Corp. - Key offerings
              • Exhibit 153: Microsoft Corp. - Segment focus
            • 12.12 Oracle Corp.
              • Exhibit 154: Oracle Corp. - Overview
              • Exhibit 155: Oracle Corp. - Business segments
              • Exhibit 156: Oracle Corp. - Key news
              • Exhibit 157: Oracle Corp. - Key offerings
              • Exhibit 158: Oracle Corp. - Segment focus
            • 12.13 SAP SE
              • Exhibit 159: SAP SE - Overview
              • Exhibit 160: SAP SE - Business segments
              • Exhibit 161: SAP SE - Key news
              • Exhibit 162: SAP SE - Key offerings
              • Exhibit 163: SAP SE - Segment focus
            • 12.14 ServiceNow Inc.
              • Exhibit 164: ServiceNow Inc. - Overview
              • Exhibit 165: ServiceNow Inc. - Product / Service
              • Exhibit 166: ServiceNow Inc. - Key news
              • Exhibit 167: ServiceNow Inc. - Key offerings
            • 12.15 Sophos Ltd.
              • Exhibit 168: Sophos Ltd. - Overview
              • Exhibit 169: Sophos Ltd. - Product / Service
              • Exhibit 170: Sophos Ltd. - Key offerings
            • 12.16 Splunk Inc.
              • Exhibit 171: Splunk Inc. - Overview
              • Exhibit 172: Splunk Inc. - Product / Service
              • Exhibit 173: Splunk Inc. - Key offerings
            • 12.17 VMware Inc.
              • Exhibit 174: VMware Inc. - Overview
              • Exhibit 175: VMware Inc. - Product / Service
              • Exhibit 176: VMware Inc. - Key news
              • Exhibit 177: VMware Inc. - Key offerings

            13 Appendix

            • 13.1 Scope of the report
              • 13.2 Inclusions and exclusions checklist
                • Exhibit 178: Inclusions checklist
                • Exhibit 179: Exclusions checklist
              • 13.3 Currency conversion rates for US$
                • Exhibit 180: Currency conversion rates for US$
              • 13.4 Research methodology
                • Exhibit 181: Research methodology
                • Exhibit 182: Validation techniques employed for market sizing
                • Exhibit 183: Information sources
              • 13.5 List of abbreviations
                • Exhibit 184: List of abbreviations

              Research Methodology

              Technavio presents a detailed picture of the market by way of study, synthesis, and summation of data from multiple sources. The analysts have presented the various facets of the market with a particular focus on identifying the key industry influencers. The data thus presented is comprehensive, reliable, and the result of extensive research, both primary and secondary.

              INFORMATION SOURCES

              Primary sources

              • Manufacturers and suppliers
              • Channel partners
              • Industry experts
              • Strategic decision makers

              Secondary sources

              • Industry journals and periodicals
              • Government data
              • Financial reports of key industry players
              • Historical data
              • Press releases

              DATA ANALYSIS

              Data Synthesis

              • Collation of data
              • Estimation of key figures
              • Analysis of derived insights

              Data Validation

              • Triangulation with data models
              • Reference against proprietary databases
              • Corroboration with industry experts

              REPORT WRITING

              Qualitative

              • Market drivers
              • Market challenges
              • Market trends
              • Five forces analysis

              Quantitative

              • Market size and forecast
              • Market segmentation
              • Geographical insights
              • Competitive landscape

              Interested in this report?

              Get your sample now to see our research methodology and insights!

              Download Now

              Frequently Asked Questions

              Workspace Aggregator market growth will increase by $ 2.13 bn during 2024-2028 .

              The Workspace Aggregator market is expected to grow at a CAGR of 10.92% during 2024-2028 .

              Workspace Aggregator market is segmented by Deployment( Cloud-based, On-premise) End-user( Retail, IT and telecom, Healthcare, Others)

              Amazon.com Inc.,  Amtel Systems Corp., AO Kaspersky Lab, BlackBerry Ltd., Cisco Systems Inc., Citrix Systems Inc., FATbit Technologies, Gartner Inc., Hewlett Packard Enterprise Co., International Business Machines Corp., Ivanti Software Inc., Juniper Networks Inc., KHIKA, Microsoft Corp., Oracle Corp., SAP SE, ServiceNow Inc., Sophos Ltd., Splunk Inc., VMware Inc. are a few of the key vendors in the Workspace Aggregator market.

              North America will register the highest growth rate of 37% among the other regions. Therefore, the Workspace Aggregator market in North America is expected to garner significant business opportunities for the vendors during the forecast period.

              US, China, Japan, Germany, UK

              • Increasing number of startups and adoption of co-workingA rising number of startups are found every year is the driving factor this market.
              • and many of the startups require affordable office space to get started efficiently. Workspace aggregators are well-placed to serve startups by offering them a variety of workspaces. Several organizations is the driving factor this market.
              • such as Facebook and Alphabet is the driving factor this market.
              • are adopting an open office culture. Hence is the driving factor this market.
              • they are changing several components of workspaces. Workspace aggregators play a major role in developing startups as they offer various services such as is the driving factor this market.
              • resource scheduling and room booking to collaboration and communication structures. The incorporation of workspace aggregators in the startups helps in encompassing programs consisting of space utilization optimization and others. Several startups are also adopting co-working as it is convenient for independent contractors and employees who work from home. Co-working is gaining popularity in several countries is the driving factor this market.
              • such as the US is the driving factor this market.
              • Germany is the driving factor this market.
              • the UK is the driving factor this market.
              • Japan is the driving factor this market.
              • France is the driving factor this market.
              • and Spain. As co-working is dynamic and complex is the driving factor this market.
              • organizations use workspace aggregator to ensure that the management of shared workspaces is smart and intuitive. Several vendors provide workspace aggregator for co-working Due to the increasing popularity of co-working is the driving factor this market.
              • vendors have started offering various innovative workspace aggregator. The increasing adoption of co-working has increased the demand for new workspace aggregator that address factors that affect both operators and members to improve productivity and efficiency. Therefore is the driving factor this market.
              • such factors drive the growth of the global workspace aggregator market during the forecast period. is the driving factor this market.

              The Workspace Aggregator market vendors should focus on grabbing business opportunities from the Cloud-based segment as it accounted for the largest market share in the base year.