Yoga Clothing Market Analysis, Size, and Forecast 2026-2030: North America (US, Canada, and Mexico), Europe (Germany, UK, and France), APAC (China, Japan, and India), South America (Brazil and Argentina), Middle East and Africa (UAE, Saudi Arabia, and South Africa), and Rest of World (ROW)

Yoga Clothing Market Analysis, Size, and Forecast 2026-2030:
North America (US, Canada, and Mexico), Europe (Germany, UK, and France), APAC (China, Japan, and India), South America (Brazil and Argentina), Middle East and Africa (UAE, Saudi Arabia, and South Africa), and Rest of World (ROW)

Published: May 2026 299 Pages SKU: IRTNTR43365

Market Overview at a Glance

$23.14 B
Market Opportunity
7.8%
CAGR 2025 - 2030
28.5%
Europe Growth
$25.04 B
Bottom wear segment 2024

Yoga Clothing Market Size 2026-2030

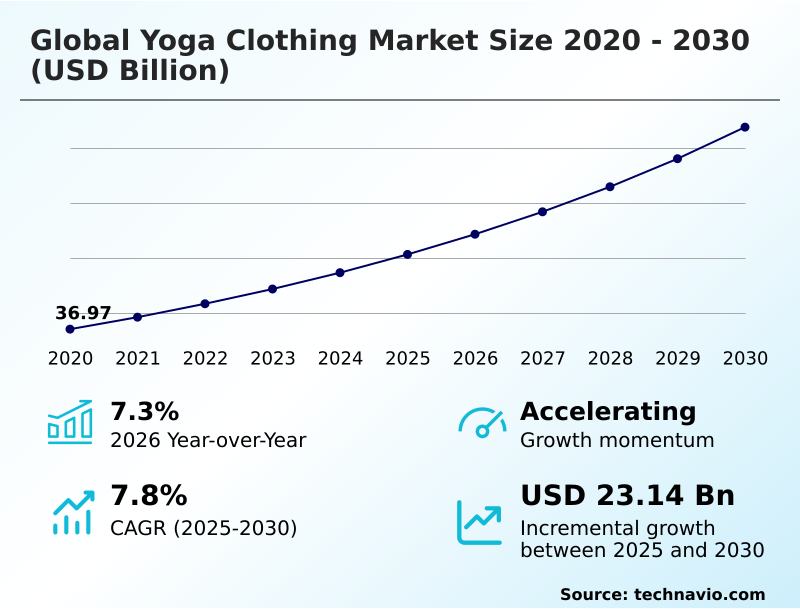
The yoga clothing market size is valued to increase by USD 23.14 billion, at a CAGR of 7.8% from 2025 to 2030. Heightened global awareness regarding physical and mental wellness will drive the yoga clothing market.

Major Market Trends & Insights

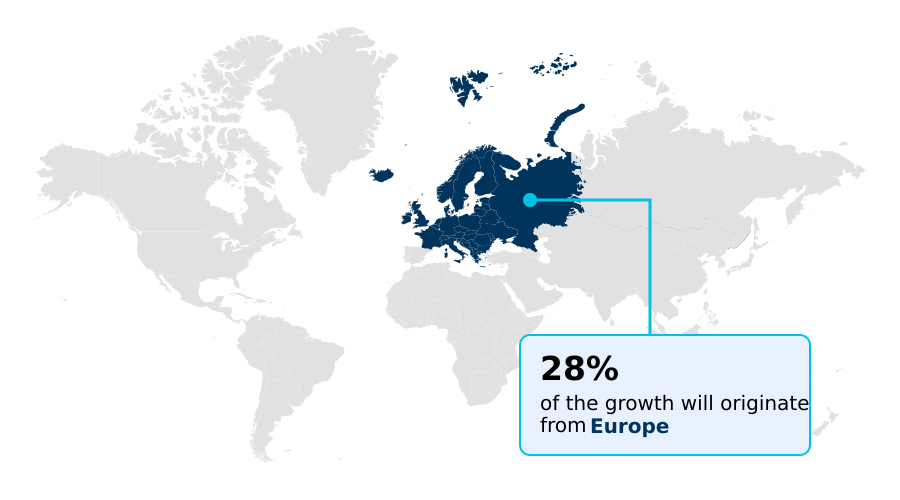
  • Europe dominated the market and accounted for a 28.5% growth during the forecast period.
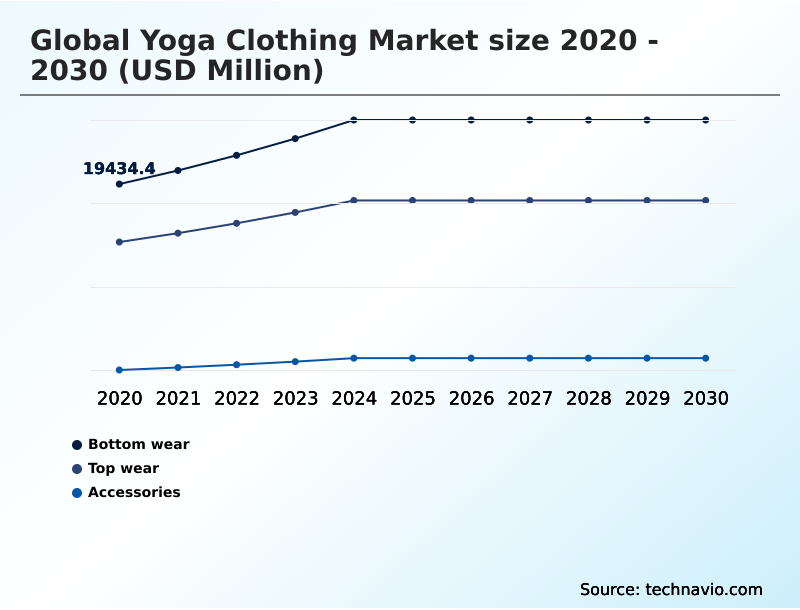
  • By Product - Bottom wear segment was valued at USD 25.04 billion in 2024
  • By End-user - Men segment accounted for the largest market revenue share in 2024

Market Size & Forecast

  • Market Opportunities: USD 36.72 billion
  • Market Future Opportunities: USD 23.14 billion
  • CAGR from 2025 to 2030 : 7.8%

Market Summary

  • The Yoga Clothing Market is undergoing a profound expansion, driven by a global cultural shift towards holistic health and wellness. This has intensified demand for apparel with technical properties such as four-way stretch capability and moisture-wicking technology. The convergence of athletic wear and daily fashion, known as athleisure, further propels the market, making versatile, high-quality garments a wardrobe staple.
  • Consumers are increasingly influenced by sustainability, pushing manufacturers toward recycled polyester fabric and bio-based fibers. A key boardroom-level consideration involves navigating supply chain complexities, where firms utilizing advanced inventory management systems to mitigate the impact of raw material price volatility have reported a 15% improvement in forecast accuracy.
  • However, the industry grapples with intense market fragmentation and the challenge of maintaining brand loyalty in mature markets where consumer behavior is shifting toward replacement cycles and secondhand purchasing. This dynamic landscape necessitates continuous innovation in both smart textile development and ethical production to meet the evolving expectations of a discerning global consumer base.
  • The integration of a circular supply chain model is becoming a critical differentiator.

What will be the Size of the Yoga Clothing Market during the forecast period?

Get Key Insights on Market Forecast (PDF) Get Free Sample

How is the Yoga Clothing Market Segmented?

The yoga clothing industry research report provides comprehensive data (region-wise segment analysis), with forecasts and estimates in "USD million" for the period 2026-2030, as well as historical data from 2020-2024 for the following segments.

  • Product
    • Bottom wear
    • Top wear
    • Accessories
  • End-user
    • Men
    • Women
  • Material
    • Polyester
    • Nylon
    • Spandex
    • Cotton
    • Others
  • Geography
    • North America
      • US
      • Canada
      • Mexico
    • Europe
      • Germany
      • UK
      • France
    • APAC
      • China
      • Japan
      • India
    • South America
      • Brazil
      • Argentina
    • Middle East and Africa
      • UAE
      • Saudi Arabia
      • South Africa
    • Rest of World (ROW)

By Product Insights

The bottom wear segment is estimated to witness significant growth during the forecast period.

The bottom wear segment is defined by a synthesis of technical performance and lifestyle adaptability. Garments feature a high-waisted compression fit and body-contouring silhouette, driven by innovations in compressive fabric support.

The use of lightweight technical fabric with four-way stretch capability is standard, ensuring unrestricted movement. Manufacturing employs seamless knitting technology, which reduces chafing and has been shown to decrease fabric waste by up to 15%.

Advanced construction, including the gusseted crotch design, enhances durability and fit.

This focus on functional design elements and a premium material hand-feel supports the segment's studio-to-street versatility, positioning these items as an athleisure wardrobe staple for a performance lifestyle apparel consumer who values a minimalist branding approach.

Get Free Sample

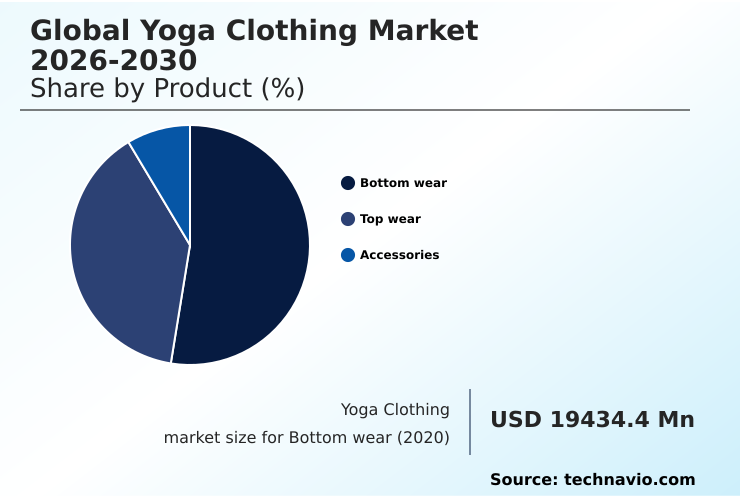
The Bottom wear segment was valued at USD 25.04 billion in 2024 and showed a gradual increase during the forecast period.

Get Free Sample

Regional Analysis

Europe is estimated to contribute 28.5% to the growth of the global market during the forecast period.Technavio’s analysts have elaborately explained the regional trends and drivers that shape the market during the forecast period.

See How Yoga Clothing Market Demand is Rising in Europe Get Free Sample

The geographic landscape is highly competitive, with Europe and North America collectively representing 56.47% of the total market opportunity.

These mature regions drive demand for premium innovations like phase-change materials and ergonomic seam placement, with a focus on inclusive sizing collections and gender-neutral apparel design.

The APAC region, holding a 27.64% share, exhibits the most rapid growth, creating demand for antimicrobial treatments and hemp and linen bast fibers. Success in this diverse region requires localized strategies, such as offering modest activewear solutions.

Across all geographies, a technical aesthetic design, flatlock seam construction, and non-slip grip technology are becoming standard expectations for any seasonless core collection or capsule wardrobe integration.

Market Dynamics

Our researchers analyzed the data with 2025 as the base year, along with the key drivers, trends, and challenges. A holistic analysis of drivers will help companies refine their marketing strategies to gain a competitive advantage.

  • Consumers increasingly seek detailed guidance on apparel choices, asking how to choose opaque yoga pants and weighing the merits of biodegradable vs recycled activewear. The demand for the best moisture wicking yoga leggings and sustainable organic cotton yoga tops highlights a preference for both performance and eco-consciousness.
  • For specific needs, buyers look for the best temperature regulating workout clothes and high-impact sports bras for yoga, indicating a sophisticated understanding of functional requirements. The men's segment is growing, with specific searches for men's yoga shorts with compression liner.
  • Accessory choices are also becoming more discerning, with research into non-slip hot yoga towel requirements and eco-friendly cork yoga mat benefits. The integration of smart clothing for fitness tracking reflects a tech-forward trend, while an understanding of the advantages of merino wool in sportswear is growing.
  • The benefits of seamless yoga clothing and anti-odor technology in gym clothes are key selling points. Ultimately, consumers want durable yoga pants for daily wear that offer four-way stretch fabric for mobility, exploring compression wear benefits for muscle recovery while seeking ethical and transparent activewear brands.
  • The rise of athleisure clothing for professional settings and the need for versatile activewear for travel, including lightweight jackets for post-yoga layering, redefine the product lifecycle. Supply chain analyses reveal that sourcing ethical and transparent activewear brands can increase consumer trust scores by a factor of two compared to brands with opaque sourcing, emphasizing the importance of this trend.

What are the key market drivers leading to the rise in the adoption of Yoga Clothing Industry?

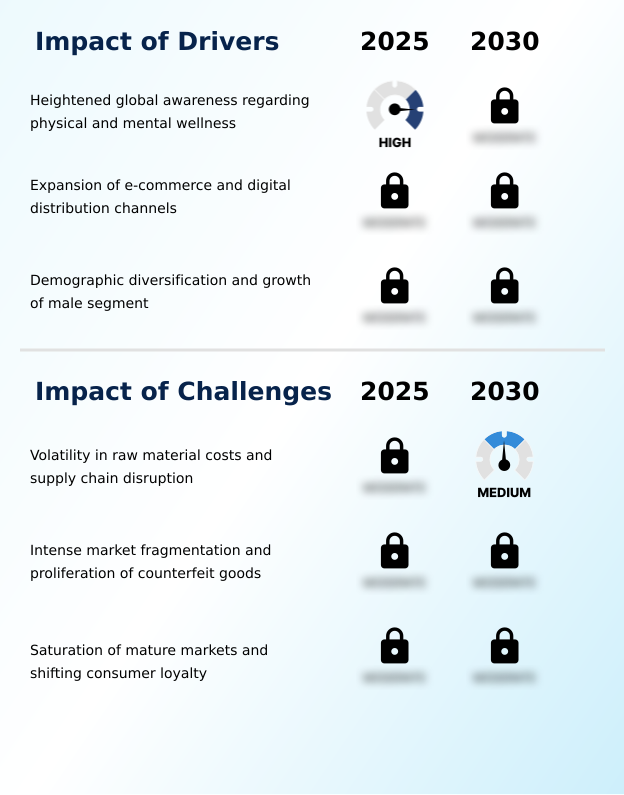
  • A key market driver is the heightened global awareness regarding the importance of physical and mental wellness.

  • The primary market driver remains the adoption of a holistic wellness lifestyle, amplified by influencer-driven marketing and a strong community-based fitness culture. Digital fitness platform integration has expanded the addressable market by over 30% in key demographics.
  • This digital shift supports the direct-to-consumer business model, which now accounts for a 40% share of online sales for some leading-edge brands. Product innovation is focused on enhancing user comfort through advanced moisture-wicking technology and breathable mesh paneling.
  • The incorporation of an anti-odor fabric treatment and durable water repellent finish enhances versatility, while materials like plant-based cellulosic fibers and merino wool performance blend cater to premium segments.
  • Corporate wellness programs are also increasingly including yoga, further broadening the consumer base.

What are the market trends shaping the Yoga Clothing Industry?

  • The market is witnessing a significant trend toward the integration of sustainable textiles, coupled with a growing emphasis on regenerative circularity in production processes.

  • Key market trends are centered on sustainability and personalization, driven by mindful consumption trends. The shift toward a fast fashion alternative is clear, with brands that offer ethical production transparency gaining significant traction.
  • Use of recycled polyester fabric and bio-based fibers is now a baseline expectation, with brands using these materials reporting up to a 25% lower carbon footprint per garment. The next frontier includes biodegradable performance fabric and innovative botanical dye processes. Simultaneously, technology is reshaping retail through the hyper-personalized shopping experience.
  • The adoption of virtual try-on technology and augmented reality retail has boosted online conversion rates by 18%, while smart textile development is paving the way for biometric-sensing apparel with conductive fiber integration.

What challenges does the Yoga Clothing Industry face during its growth?

  • Industry growth faces a key challenge from the volatility in raw material costs and persistent supply chain disruptions.

  • Navigating market challenges requires addressing material sourcing, competition, and shifting consumer habits. Maintaining fabric opacity standards while managing costs is a core issue, as petroleum-based input fluctuations have increased production expenses by 15% for some synthetics. The push for sustainability demands investment in a circular supply chain model, textile recycling technology, and waterless dyeing methods.
  • Competition from the secondhand apparel market and subscription-based apparel service models is impacting new sales, particularly in the luxury activewear segment. Brands are responding with coordinated activewear sets and specialized lines for post-practice loungewear and maternity activewear design. The adoption of a closed-loop textile production system, while costly, is becoming a strategic necessity to ensure long-term viability.

Exclusive Technavio Analysis on Customer Landscape

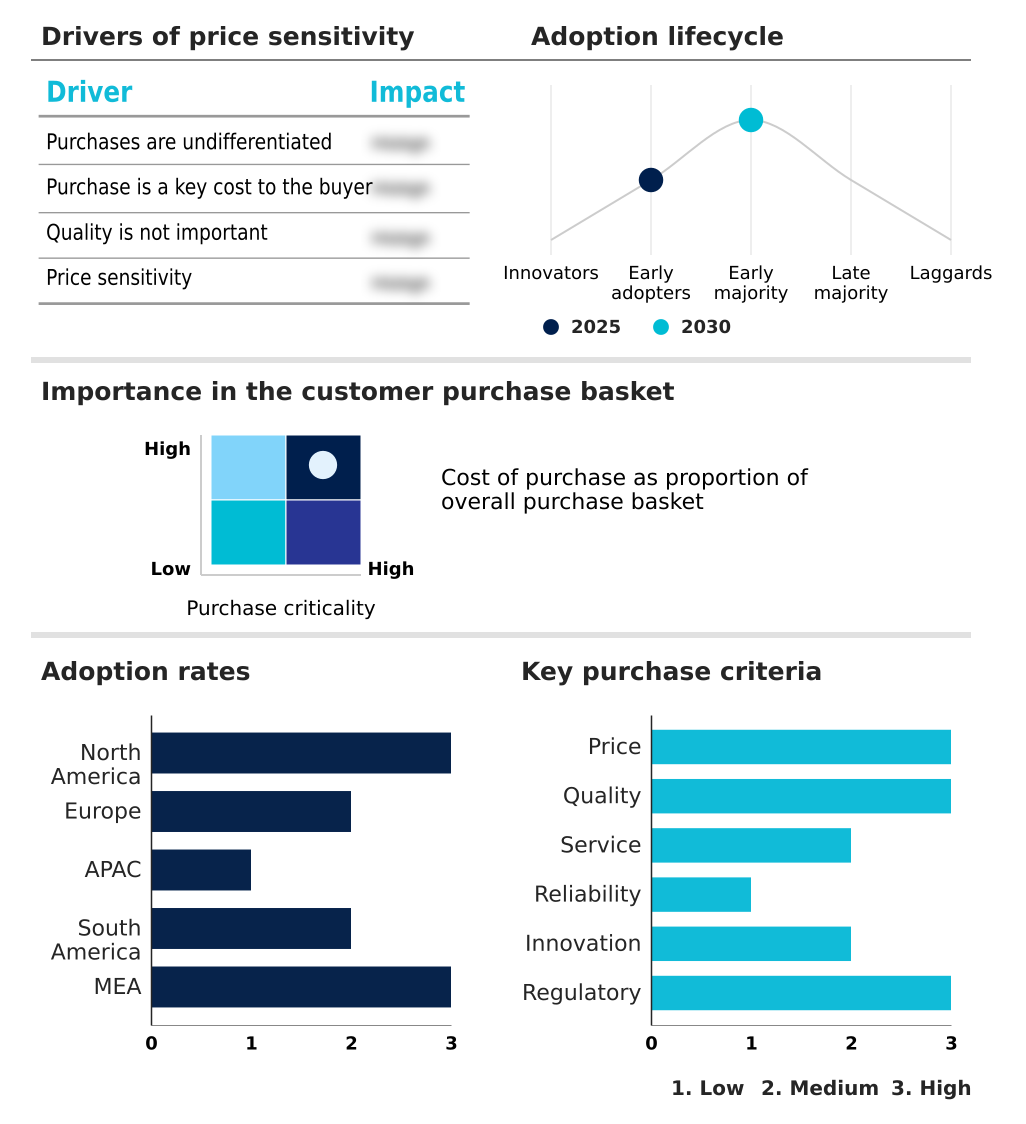
The yoga clothing market forecasting report includes the adoption lifecycle of the market, covering from the innovator’s stage to the laggard’s stage. It focuses on adoption rates in different regions based on penetration. Furthermore, the yoga clothing market report also includes key purchase criteria and drivers of price sensitivity to help companies evaluate and develop their market growth analysis strategies.

Customer Landscape of Yoga Clothing Industry

Competitive Landscape

Companies are implementing various strategies, such as strategic alliances, yoga clothing market forecast, partnerships, mergers and acquisitions, geographical expansion, and product/service launches, to enhance their presence in the industry.

Adidas AG - Analysis indicates a focus on performance-driven apparel, engineered with advanced breathable and moisture-wicking fabrics designed for enhanced mobility and comfort during practice.

The industry research and growth report includes detailed analyses of the competitive landscape of the market and information about key companies, including:

  • Adidas AG
  • Alo Yoga LLC
  • ASICS Corp.
  • Aurorae Yoga LLC
  • Fabletics LLC
  • Gaiam
  • Gymshark Ltd.
  • Hugo Boss AG
  • Levi Strauss and Co.
  • lululemon athletica Inc.
  • Manduka LLC
  • New Balance Athletics Inc.
  • Nike Inc.
  • Onzie Inc.
  • Outdoor Voices Inc.
  • Prana Living LLC
  • PUMA SE
  • Reebok International Ltd.
  • The Gap Inc.
  • Under Armour Inc.

Qualitative and quantitative analysis of companies has been conducted to help clients understand the wider business environment as well as the strengths and weaknesses of key industry players. Data is qualitatively analyzed to categorize companies as pure play, category-focused, industry-focused, and diversified; it is quantitatively analyzed to categorize companies as dominant, leading, strong, tentative, and weak.

Recent Development and News in Yoga clothing market

  • In March 2025, lululemon athletica Inc. announced the acquisition of BioForm, a smart textile startup, to embed proprietary biosensors into its yoga apparel for tracking muscle strain and alignment.
  • In April 2025, Adidas AG revealed an exclusive partnership with a materials science innovator to launch a yoga collection made from a new, fully biodegradable, plant-derived performance fabric.
  • In April 2025, Emaar Properties partnered with Four Seasons Hotels and Resorts to create an exclusive wellness and retail concept in Dubai, featuring a curated boutique of high-end yoga clothing from designer collaborations.
  • In May 2025, Zalando launched 'The Re-Weave Project,' a pan-European circularity program allowing customers to return used yoga clothing from any brand for recycling into new fabrics, in partnership with several key brands.

Dive into Technavio’s robust research methodology, blending expert interviews, extensive data synthesis, and validated models for unparalleled Yoga Clothing Market insights. See full methodology.

Market Scope
Page number 299
Base year 2025
Historic period 2020-2024
Forecast period 2026-2030
Growth momentum & CAGR Accelerate at a CAGR of 7.8%
Market growth 2026-2030 USD 23137.6 million
Market structure Fragmented
YoY growth 2025-2026(%) 7.3%
Key countries US, Canada, Mexico, Germany, UK, France, Italy, Spain, The Netherlands, China, Japan, India, South Korea, Australia, Indonesia, Brazil, Argentina, Chile, UAE, Saudi Arabia, South Africa, Israel and Turkey
Competitive landscape Leading Companies, Market Positioning of Companies, Competitive Strategies, and Industry Risks

Request Free Sample

Research Analyst Overview

  • The market's evolution is fundamentally tied to material science and advanced manufacturing. Core product development relies on creating lightweight technical fabric with four-way stretch capability and superior moisture-wicking technology. Innovations such as seamless knitting technology, flatlock seam construction, and ergonomic seam placement are standard for creating a comfortable, body-contouring silhouette with a high-waisted compression fit.
  • Ensuring fabric opacity standards and utilizing a gusseted crotch design are critical for user confidence. Advanced functionality is introduced through antimicrobial treatments, anti-odor fabric treatment, and breathable mesh paneling. Firms are exploring phase-change materials for thermal regulation and durable water repellent finish for versatility.
  • The push for sustainability is evident in the adoption of recycled polyester fabric, bio-based fibers, plant-based cellulosic fibers, hemp and linen bast fibers, and even merino wool performance blend, supported by waterless dyeing methods and botanical dye processes.
  • Boardroom strategies now pivot on implementing a circular supply chain model and closed-loop textile production, with firms adopting these models reporting a 20% improvement in material cost efficiency.
  • The future lies in smart textile development, integrating conductive fiber integration for biometric-sensing apparel and exploring new compositions like thermoplastic elastomer material and natural rubber composition to enhance features like non-slip grip technology and microfiber absorbency rate, all while aiming for a truly biodegradable performance fabric through regenerative agricultural textiles and textile recycling technology.

What are the Key Data Covered in this Yoga Clothing Market Research and Growth Report?

  • What is the expected growth of the Yoga Clothing Market between 2026 and 2030?

    • USD 23.14 billion, at a CAGR of 7.8%

  • What segmentation does the market report cover?

    • The report is segmented by Product (Bottom wear, Top wear, and Accessories), End-user (Men, and Women), Material (Polyester, Nylon, Spandex, Cotton, and Others) and Geography (North America, Europe, APAC, South America, Middle East and Africa)

  • Which regions are analyzed in the report?

    • North America, Europe, APAC, South America and Middle East and Africa

  • What are the key growth drivers and market challenges?

    • Heightened global awareness regarding physical and mental wellness, Volatility in raw material costs and supply chain disruption

  • Who are the major players in the Yoga Clothing Market?

    • Adidas AG, Alo Yoga LLC, ASICS Corp., Aurorae Yoga LLC, Fabletics LLC, Gaiam, Gymshark Ltd., Hugo Boss AG, Levi Strauss and Co., lululemon athletica Inc., Manduka LLC, New Balance Athletics Inc., Nike Inc., Onzie Inc., Outdoor Voices Inc., Prana Living LLC, PUMA SE, Reebok International Ltd., The Gap Inc. and Under Armour Inc.

Market Research Insights

  • The market's dynamic nature is shaped by evolving consumer behaviors and technological integration. Brands adopting a direct-to-consumer business model report up to 20% higher customer engagement rates compared to traditional retail channels. This is amplified by influencer-driven marketing and a focus on community-based fitness culture.
  • The pursuit of a hyper-personalized shopping experience is a key driver, with the integration of virtual try-on technology and body scanning software proven to reduce online return rates by as much as 35%. This move towards augmented reality retail addresses major online shopping barriers, fostering consumer confidence.
  • As the market pivots from fast fashion alternatives, a premium material hand-feel and technical aesthetic design become crucial differentiators in the luxury activewear segment and for performance lifestyle apparel.

We can help! Our analysts can customize this yoga clothing market research report to meet your requirements.

Get in touch

1. Executive Summary

1.1 Market overview

Executive Summary - Chart on Market Overview
Executive Summary - Data Table on Market Overview
Executive Summary - Chart on Global Market Characteristics
Executive Summary - Chart on Market by Geography
Executive Summary - Chart on Market Segmentation by Product
Executive Summary - Chart on Market Segmentation by End-user
Executive Summary - Chart on Market Segmentation by Material
Executive Summary - Chart on Incremental Growth
Executive Summary - Data Table on Incremental Growth
Executive Summary - Chart on Company Market Positioning

2. Technavio Analysis

2.1 Analysis of price sensitivity, lifecycle, customer purchase basket, adoption rates, and purchase criteria

2.2 Criticality of inputs and Factors of differentiation

Chart on Overview on criticality of inputs and factors of differentiation

2.3 Factors of disruption

Chart on Overview on factors of disruption

2.4 Impact of drivers and challenges

Chart on Impact of drivers and challenges in 2025 and 2030

3. Market Landscape

3.1 Market ecosystem

Chart on Parent Market
Data Table on - Parent Market

3.2 Market characteristics

Chart on Market characteristics analysis

3.3 Value chain analysis

Chart on Value chain analysis

4. Market Sizing

4.1 Market definition

Data Table on Offerings of companies included in the market definition

4.2 Market segment analysis

Market segments

4.3 Market size 2025

4.4 Market outlook: Forecast for 2025-2030

Chart on Global - Market size and forecast 2025-2030 ($ million)
Data Table on Global - Market size and forecast 2025-2030 ($ million)
Chart on Global Market: Year-over-year growth 2025-2030 (%)
Data Table on Global Market: Year-over-year growth 2025-2030 (%)

5. Historic Market Size

5.1 Global Yoga Clothing Market 2020 - 2024

Historic Market Size - Data Table on Global Yoga Clothing Market 2020 - 2024 ($ million)

5.2 Product segment analysis 2020 - 2024

Historic Market Size - Product Segment 2020 - 2024 ($ million)

5.3 End-user segment analysis 2020 - 2024

Historic Market Size - End-user Segment 2020 - 2024 ($ million)

5.4 Material segment analysis 2020 - 2024

Historic Market Size - Material Segment 2020 - 2024 ($ million)

5.5 Geography segment analysis 2020 - 2024

Historic Market Size - Geography Segment 2020 - 2024 ($ million)

5.6 Country segment analysis 2020 - 2024

Historic Market Size - Country Segment 2020 - 2024 ($ million)

6. Qualitative Analysis

6.1 Impact of AI on global yoga clothing market

6.2 Impact of geopolitical conflicts on global yoga clothing market

7. Five Forces Analysis

7.1 Five forces summary

Five forces analysis - Comparison between 2025 and 2030

7.2 Bargaining power of buyers

Bargaining power of buyers - Impact of key factors 2025 and 2030

7.3 Bargaining power of suppliers

Bargaining power of suppliers - Impact of key factors in 2025 and 2030

7.4 Threat of new entrants

Threat of new entrants - Impact of key factors in 2025 and 2030

7.5 Threat of substitutes

Threat of substitutes - Impact of key factors in 2025 and 2030

7.6 Threat of rivalry

Threat of rivalry - Impact of key factors in 2025 and 2030

7.7 Market condition

Chart on Market condition - Five forces 2025 and 2030

8. Market Segmentation by Product

8.1 Market segments

Chart on Product - Market share 2025-2030 (%)
Data Table on Product - Market share 2025-2030 (%)

8.2 Comparison by Product

Chart on Comparison by Product
Data Table on Comparison by Product

8.3 Bottom wear - Market size and forecast 2025-2030

Chart on Bottom wear - Market size and forecast 2025-2030 ($ million)
Data Table on Bottom wear - Market size and forecast 2025-2030 ($ million)
Chart on Bottom wear - Year-over-year growth 2025-2030 (%)
Data Table on Bottom wear - Year-over-year growth 2025-2030 (%)

8.4 Top wear - Market size and forecast 2025-2030

Chart on Top wear - Market size and forecast 2025-2030 ($ million)
Data Table on Top wear - Market size and forecast 2025-2030 ($ million)
Chart on Top wear - Year-over-year growth 2025-2030 (%)
Data Table on Top wear - Year-over-year growth 2025-2030 (%)

8.5 Accessories - Market size and forecast 2025-2030

Chart on Accessories - Market size and forecast 2025-2030 ($ million)
Data Table on Accessories - Market size and forecast 2025-2030 ($ million)
Chart on Accessories - Year-over-year growth 2025-2030 (%)
Data Table on Accessories - Year-over-year growth 2025-2030 (%)

8.6 Market opportunity by Product

Market opportunity by Product ($ million)
Data Table on Market opportunity by Product ($ million)

9. Market Segmentation by End-user

9.1 Market segments

Chart on End-user - Market share 2025-2030 (%)
Data Table on End-user - Market share 2025-2030 (%)

9.2 Comparison by End-user

Chart on Comparison by End-user
Data Table on Comparison by End-user

9.3 Men - Market size and forecast 2025-2030

Chart on Men - Market size and forecast 2025-2030 ($ million)
Data Table on Men - Market size and forecast 2025-2030 ($ million)
Chart on Men - Year-over-year growth 2025-2030 (%)
Data Table on Men - Year-over-year growth 2025-2030 (%)

9.4 Women - Market size and forecast 2025-2030

Chart on Women - Market size and forecast 2025-2030 ($ million)
Data Table on Women - Market size and forecast 2025-2030 ($ million)
Chart on Women - Year-over-year growth 2025-2030 (%)
Data Table on Women - Year-over-year growth 2025-2030 (%)

9.5 Market opportunity by End-user

Market opportunity by End-user ($ million)
Data Table on Market opportunity by End-user ($ million)

10. Market Segmentation by Material

10.1 Market segments

Chart on Material - Market share 2025-2030 (%)
Data Table on Material - Market share 2025-2030 (%)

10.2 Comparison by Material

Chart on Comparison by Material
Data Table on Comparison by Material

10.3 Polyester - Market size and forecast 2025-2030

Chart on Polyester - Market size and forecast 2025-2030 ($ million)
Data Table on Polyester - Market size and forecast 2025-2030 ($ million)
Chart on Polyester - Year-over-year growth 2025-2030 (%)
Data Table on Polyester - Year-over-year growth 2025-2030 (%)

10.4 Nylon - Market size and forecast 2025-2030

Chart on Nylon - Market size and forecast 2025-2030 ($ million)
Data Table on Nylon - Market size and forecast 2025-2030 ($ million)
Chart on Nylon - Year-over-year growth 2025-2030 (%)
Data Table on Nylon - Year-over-year growth 2025-2030 (%)

10.5 Spandex - Market size and forecast 2025-2030

Chart on Spandex - Market size and forecast 2025-2030 ($ million)
Data Table on Spandex - Market size and forecast 2025-2030 ($ million)
Chart on Spandex - Year-over-year growth 2025-2030 (%)
Data Table on Spandex - Year-over-year growth 2025-2030 (%)

10.6 Cotton - Market size and forecast 2025-2030

Chart on Cotton - Market size and forecast 2025-2030 ($ million)
Data Table on Cotton - Market size and forecast 2025-2030 ($ million)
Chart on Cotton - Year-over-year growth 2025-2030 (%)
Data Table on Cotton - Year-over-year growth 2025-2030 (%)

10.7 Others - Market size and forecast 2025-2030

Chart on Others - Market size and forecast 2025-2030 ($ million)
Data Table on Others - Market size and forecast 2025-2030 ($ million)
Chart on Others - Year-over-year growth 2025-2030 (%)
Data Table on Others - Year-over-year growth 2025-2030 (%)

10.8 Market opportunity by Material

Market opportunity by Material ($ million)
Data Table on Market opportunity by Material ($ million)

11. Customer Landscape

11.1 Customer landscape overview

Analysis of price sensitivity, lifecycle, customer purchase basket, adoption rates, and purchase criteria

12. Geographic Landscape

12.1 Geographic segmentation

Chart on Market share by geography 2025-2030 (%)
Data Table on Market share by geography 2025-2030 (%)

12.2 Geographic comparison

Chart on Geographic comparison
Data Table on Geographic comparison

12.3 North America - Market size and forecast 2025-2030

Chart on North America - Market size and forecast 2025-2030 ($ million)
Data Table on North America - Market size and forecast 2025-2030 ($ million)
Chart on North America - Year-over-year growth 2025-2030 (%)
Data Table on North America - Year-over-year growth 2025-2030 (%)
Chart on Regional Comparison - North America
Data Table on Regional Comparison - North America

12.3.1 US - Market size and forecast 2025-2030

Chart on US - Market size and forecast 2025-2030 ($ million)
Data Table on US - Market size and forecast 2025-2030 ($ million)
Chart on US - Year-over-year growth 2025-2030 (%)
Data Table on US - Year-over-year growth 2025-2030 (%)

12.3.2 Canada - Market size and forecast 2025-2030

Chart on Canada - Market size and forecast 2025-2030 ($ million)
Data Table on Canada - Market size and forecast 2025-2030 ($ million)
Chart on Canada - Year-over-year growth 2025-2030 (%)
Data Table on Canada - Year-over-year growth 2025-2030 (%)

12.3.3 Mexico - Market size and forecast 2025-2030

Chart on Mexico - Market size and forecast 2025-2030 ($ million)
Data Table on Mexico - Market size and forecast 2025-2030 ($ million)
Chart on Mexico - Year-over-year growth 2025-2030 (%)
Data Table on Mexico - Year-over-year growth 2025-2030 (%)

12.4 Europe - Market size and forecast 2025-2030

Chart on Europe - Market size and forecast 2025-2030 ($ million)
Data Table on Europe - Market size and forecast 2025-2030 ($ million)
Chart on Europe - Year-over-year growth 2025-2030 (%)
Data Table on Europe - Year-over-year growth 2025-2030 (%)
Chart on Regional Comparison - Europe
Data Table on Regional Comparison - Europe

12.4.1 Germany - Market size and forecast 2025-2030

Chart on Germany - Market size and forecast 2025-2030 ($ million)
Data Table on Germany - Market size and forecast 2025-2030 ($ million)
Chart on Germany - Year-over-year growth 2025-2030 (%)
Data Table on Germany - Year-over-year growth 2025-2030 (%)

12.4.2 UK - Market size and forecast 2025-2030

Chart on UK - Market size and forecast 2025-2030 ($ million)
Data Table on UK - Market size and forecast 2025-2030 ($ million)
Chart on UK - Year-over-year growth 2025-2030 (%)
Data Table on UK - Year-over-year growth 2025-2030 (%)

12.4.3 France - Market size and forecast 2025-2030

Chart on France - Market size and forecast 2025-2030 ($ million)
Data Table on France - Market size and forecast 2025-2030 ($ million)
Chart on France - Year-over-year growth 2025-2030 (%)
Data Table on France - Year-over-year growth 2025-2030 (%)

12.4.4 Italy - Market size and forecast 2025-2030

Chart on Italy - Market size and forecast 2025-2030 ($ million)
Data Table on Italy - Market size and forecast 2025-2030 ($ million)
Chart on Italy - Year-over-year growth 2025-2030 (%)
Data Table on Italy - Year-over-year growth 2025-2030 (%)

12.4.5 Spain - Market size and forecast 2025-2030

Chart on Spain - Market size and forecast 2025-2030 ($ million)
Data Table on Spain - Market size and forecast 2025-2030 ($ million)
Chart on Spain - Year-over-year growth 2025-2030 (%)
Data Table on Spain - Year-over-year growth 2025-2030 (%)

12.4.6 The Netherlands - Market size and forecast 2025-2030

Chart on The Netherlands - Market size and forecast 2025-2030 ($ million)
Data Table on The Netherlands - Market size and forecast 2025-2030 ($ million)
Chart on The Netherlands - Year-over-year growth 2025-2030 (%)
Data Table on The Netherlands - Year-over-year growth 2025-2030 (%)

12.5 APAC - Market size and forecast 2025-2030

Chart on APAC - Market size and forecast 2025-2030 ($ million)
Data Table on APAC - Market size and forecast 2025-2030 ($ million)
Chart on APAC - Year-over-year growth 2025-2030 (%)
Data Table on APAC - Year-over-year growth 2025-2030 (%)
Chart on Regional Comparison - APAC
Data Table on Regional Comparison - APAC

12.5.1 China - Market size and forecast 2025-2030

Chart on China - Market size and forecast 2025-2030 ($ million)
Data Table on China - Market size and forecast 2025-2030 ($ million)
Chart on China - Year-over-year growth 2025-2030 (%)
Data Table on China - Year-over-year growth 2025-2030 (%)

12.5.2 Japan - Market size and forecast 2025-2030

Chart on Japan - Market size and forecast 2025-2030 ($ million)
Data Table on Japan - Market size and forecast 2025-2030 ($ million)
Chart on Japan - Year-over-year growth 2025-2030 (%)
Data Table on Japan - Year-over-year growth 2025-2030 (%)

12.5.3 India - Market size and forecast 2025-2030

Chart on India - Market size and forecast 2025-2030 ($ million)
Data Table on India - Market size and forecast 2025-2030 ($ million)
Chart on India - Year-over-year growth 2025-2030 (%)
Data Table on India - Year-over-year growth 2025-2030 (%)

12.5.4 South Korea - Market size and forecast 2025-2030

Chart on South Korea - Market size and forecast 2025-2030 ($ million)
Data Table on South Korea - Market size and forecast 2025-2030 ($ million)
Chart on South Korea - Year-over-year growth 2025-2030 (%)
Data Table on South Korea - Year-over-year growth 2025-2030 (%)

12.5.5 Australia - Market size and forecast 2025-2030

Chart on Australia - Market size and forecast 2025-2030 ($ million)
Data Table on Australia - Market size and forecast 2025-2030 ($ million)
Chart on Australia - Year-over-year growth 2025-2030 (%)
Data Table on Australia - Year-over-year growth 2025-2030 (%)

12.5.6 Indonesia - Market size and forecast 2025-2030

Chart on Indonesia - Market size and forecast 2025-2030 ($ million)
Data Table on Indonesia - Market size and forecast 2025-2030 ($ million)
Chart on Indonesia - Year-over-year growth 2025-2030 (%)
Data Table on Indonesia - Year-over-year growth 2025-2030 (%)

12.6 South America - Market size and forecast 2025-2030

Chart on South America - Market size and forecast 2025-2030 ($ million)
Data Table on South America - Market size and forecast 2025-2030 ($ million)
Chart on South America - Year-over-year growth 2025-2030 (%)
Data Table on South America - Year-over-year growth 2025-2030 (%)
Chart on Regional Comparison - South America
Data Table on Regional Comparison - South America

12.6.1 Brazil - Market size and forecast 2025-2030

Chart on Brazil - Market size and forecast 2025-2030 ($ million)
Data Table on Brazil - Market size and forecast 2025-2030 ($ million)
Chart on Brazil - Year-over-year growth 2025-2030 (%)
Data Table on Brazil - Year-over-year growth 2025-2030 (%)

12.6.2 Argentina - Market size and forecast 2025-2030

Chart on Argentina - Market size and forecast 2025-2030 ($ million)
Data Table on Argentina - Market size and forecast 2025-2030 ($ million)
Chart on Argentina - Year-over-year growth 2025-2030 (%)
Data Table on Argentina - Year-over-year growth 2025-2030 (%)

12.6.3 Chile - Market size and forecast 2025-2030

Chart on Chile - Market size and forecast 2025-2030 ($ million)
Data Table on Chile - Market size and forecast 2025-2030 ($ million)
Chart on Chile - Year-over-year growth 2025-2030 (%)
Data Table on Chile - Year-over-year growth 2025-2030 (%)

12.7 Middle East and Africa - Market size and forecast 2025-2030

Chart on Middle East and Africa - Market size and forecast 2025-2030 ($ million)
Data Table on Middle East and Africa - Market size and forecast 2025-2030 ($ million)
Chart on Middle East and Africa - Year-over-year growth 2025-2030 (%)
Data Table on Middle East and Africa - Year-over-year growth 2025-2030 (%)
Chart on Regional Comparison - Middle East and Africa
Data Table on Regional Comparison - Middle East and Africa

12.7.1 UAE - Market size and forecast 2025-2030

Chart on UAE - Market size and forecast 2025-2030 ($ million)
Data Table on UAE - Market size and forecast 2025-2030 ($ million)
Chart on UAE - Year-over-year growth 2025-2030 (%)
Data Table on UAE - Year-over-year growth 2025-2030 (%)

12.7.2 Saudi Arabia - Market size and forecast 2025-2030

Chart on Saudi Arabia - Market size and forecast 2025-2030 ($ million)
Data Table on Saudi Arabia - Market size and forecast 2025-2030 ($ million)
Chart on Saudi Arabia - Year-over-year growth 2025-2030 (%)
Data Table on Saudi Arabia - Year-over-year growth 2025-2030 (%)

12.7.3 South Africa - Market size and forecast 2025-2030

Chart on South Africa - Market size and forecast 2025-2030 ($ million)
Data Table on South Africa - Market size and forecast 2025-2030 ($ million)
Chart on South Africa - Year-over-year growth 2025-2030 (%)
Data Table on South Africa - Year-over-year growth 2025-2030 (%)

12.7.4 Israel - Market size and forecast 2025-2030

Chart on Israel - Market size and forecast 2025-2030 ($ million)
Data Table on Israel - Market size and forecast 2025-2030 ($ million)
Chart on Israel - Year-over-year growth 2025-2030 (%)
Data Table on Israel - Year-over-year growth 2025-2030 (%)

12.7.5 Turkey - Market size and forecast 2025-2030

Chart on Turkey - Market size and forecast 2025-2030 ($ million)
Data Table on Turkey - Market size and forecast 2025-2030 ($ million)
Chart on Turkey - Year-over-year growth 2025-2030 (%)
Data Table on Turkey - Year-over-year growth 2025-2030 (%)

12.8 Market opportunity by geography

Market opportunity by geography ($ million)
Data Tables on Market opportunity by geography ($ million)

13. Drivers, Challenges, and Opportunity

13.1 Market drivers

Heightened global awareness regarding physical and mental wellness
Expansion of e-commerce and digital distribution channels
Demographic diversification and growth of male segment

13.2 Market challenges

Volatility in raw material costs and supply chain disruption
Intense market fragmentation and proliferation of counterfeit goods
Saturation of mature markets and shifting consumer loyalty

13.3 Impact of drivers and challenges

Impact of drivers and challenges in 2025 and 2030

13.4 Market opportunities

Integration of sustainable textiles and regenerative circularity
Technological advancements and proliferation of smart fabrics
Rise of athleisure and studio-to-street versatility

14. Competitive Landscape

14.1 Overview

14.2

Overview on criticality of inputs and factors of differentiation

14.3 Landscape disruption

Overview on factors of disruption

14.4 Industry risks

Impact of key risks on business

15. Competitive Analysis

15.1 Companies profiled

Companies covered

15.2 Company ranking index

15.3 Market positioning of companies

Matrix on companies position and classification

15.4 Adidas AG

Adidas AG - Overview
Adidas AG - Business segments
Adidas AG - Key offerings
Adidas AG - Segment focus
SWOT

15.5 Alo Yoga LLC

Alo Yoga LLC - Overview
Alo Yoga LLC - Product / Service
Alo Yoga LLC - Key offerings
SWOT

15.6 ASICS Corp.

ASICS Corp. - Overview
ASICS Corp. - Business segments
ASICS Corp. - Key offerings
ASICS Corp. - Segment focus
SWOT

15.7 Aurorae Yoga LLC

Aurorae Yoga LLC - Overview
Aurorae Yoga LLC - Product / Service
Aurorae Yoga LLC - Key offerings
SWOT

15.8 Gymshark Ltd.

Gymshark Ltd. - Overview
Gymshark Ltd. - Product / Service
Gymshark Ltd. - Key offerings
SWOT

15.9 Levi Strauss and Co.

Levi Strauss and Co. - Overview
Levi Strauss and Co. - Business segments
Levi Strauss and Co. - Key offerings
Levi Strauss and Co. - Segment focus
SWOT

15.10 New Balance Athletics Inc.

New Balance Athletics Inc. - Overview
New Balance Athletics Inc. - Product / Service
New Balance Athletics Inc. - Key offerings
SWOT

15.11 Nike Inc.

Nike Inc. - Overview
Nike Inc. - Business segments
Nike Inc. - Key offerings
Nike Inc. - Segment focus
SWOT

15.12 Onzie Inc.

Onzie Inc. - Overview
Onzie Inc. - Product / Service
Onzie Inc. - Key offerings
SWOT

15.13 Outdoor Voices Inc.

Outdoor Voices Inc. - Overview
Outdoor Voices Inc. - Product / Service
Outdoor Voices Inc. - Key offerings
SWOT

15.14 Prana Living LLC

Prana Living LLC - Overview
Prana Living LLC - Product / Service
Prana Living LLC - Key offerings
SWOT

15.15 PUMA SE

PUMA SE - Overview
PUMA SE - Business segments
PUMA SE - Key news
PUMA SE - Key offerings
PUMA SE - Segment focus
SWOT

15.16 Reebok International Ltd.

Reebok International Ltd. - Overview
Reebok International Ltd. - Product / Service
Reebok International Ltd. - Key offerings
SWOT

15.17 The Gap Inc.

The Gap Inc. - Overview
The Gap Inc. - Business segments
The Gap Inc. - Key offerings
The Gap Inc. - Segment focus
SWOT

15.18 Under Armour Inc.

Under Armour Inc. - Overview
Under Armour Inc. - Business segments
Under Armour Inc. - Key offerings
Under Armour Inc. - Segment focus
SWOT

16. Appendix

16.1 Scope of the report

Market definition
Objectives
Notes and caveats

16.2 Inclusions and exclusions checklist

Inclusions checklist
Exclusions checklist

16.3 Currency conversion rates for US$

16.4 Research methodology

16.5 Data procurement

Information sources

16.6 Data validation

16.7 Validation techniques employed for market sizing

16.8 Data synthesis

16.9 360 degree market analysis

16.10 List of abbreviations

Research Methodology

Technavio presents a detailed picture of the market by way of study, synthesis, and summation of data from multiple sources. The analysts have presented the various facets of the market with a particular focus on identifying the key industry influencers. The data thus presented is comprehensive, reliable, and the result of extensive research, both primary and secondary.

INFORMATION SOURCES

Primary sources

  • Manufacturers and suppliers
  • Channel partners
  • Industry experts
  • Strategic decision makers

Secondary sources

  • Industry journals and periodicals
  • Government data
  • Financial reports of key industry players
  • Historical data
  • Press releases

DATA ANALYSIS

Data Synthesis

  • Collation of data
  • Estimation of key figures
  • Analysis of derived insights

Data Validation

  • Triangulation with data models
  • Reference against proprietary databases
  • Corroboration with industry experts

REPORT WRITING

Qualitative

  • Market drivers
  • Market challenges
  • Market trends
  • Five forces analysis

Quantitative

  • Market size and forecast
  • Market segmentation
  • Geographical insights
  • Competitive landscape

Interested in this report?

Get your sample now to see our research methodology and insights!

Download Now

Frequently Asked Questions

Yoga Clothing market growth will increase by USD 23137.6 million during 2026-2030.

The Yoga Clothing market is expected to grow at a CAGR of 7.8% during 2026-2030.

Yoga Clothing market is segmented by Product (Bottom wear, Top wear, Accessories) End-user (Men, Women) Material (Polyester, Nylon, Spandex, Cotton, Others)

Adidas AG, Alo Yoga LLC, ASICS Corp., Aurorae Yoga LLC, Fabletics LLC, Gaiam, Gymshark Ltd., Hugo Boss AG, Levi Strauss and Co., lululemon athletica Inc., Manduka LLC, New Balance Athletics Inc., Nike Inc., Onzie Inc., Outdoor Voices Inc., Prana Living LLC, PUMA SE, Reebok International Ltd., The Gap Inc., Under Armour Inc. are a few of the key vendors in the Yoga Clothing market.

Europe will register the highest growth rate of 28.5% among the other regions. Therefore, the Yoga Clothing market in Europe is expected to garner significant business opportunities for the vendors during the forecast period.

US, Canada, Mexico, Germany, UK, France, Italy, Spain, The Netherlands, China, Japan, India, South Korea, Australia, Indonesia, Brazil, Argentina, Chile, UAE, Saudi Arabia, South Africa, Israel, Turkey

  • Heightened global awareness regarding physical and mental wellness is the driving factor this market.

The Yoga Clothing market vendors should focus on grabbing business opportunities from the Product segment as it accounted for the largest market share in the base year.
RIA - Research AI Assistant
Ask RIA