Zero Energy AI Systems Market Analysis, Size, and Forecast 2025-2029: North America (US, Canada, and Mexico), APAC (China, Japan, and India), Europe (Germany, UK, and France), Middle East and Africa (UAE, Saudi Arabia, and Israel), South America (Brazil, Argentina, and Colombia), and Rest of World (ROW)

Zero Energy AI Systems Market Analysis, Size, and Forecast 2025-2029:
North America (US, Canada, and Mexico), APAC (China, Japan, and India), Europe (Germany, UK, and France), Middle East and Africa (UAE, Saudi Arabia, and Israel), South America (Brazil, Argentina, and Colombia), and Rest of World (ROW)

Published: Dec 2025 311 Pages SKU: IRTNTR81093

Market Overview at a Glance

$2.33 B
Market Opportunity
35.7%
CAGR 2024 - 2029
35.2%
North America Growth
$279.4 Mn
Hardware segment 2023

Zero Energy AI Systems Market Size 2025-2029

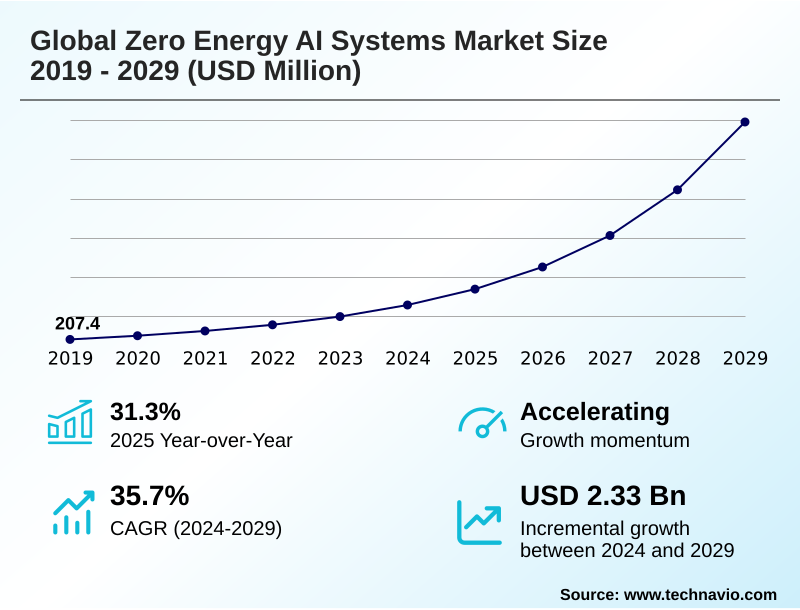
The zero energy ai systems market size is valued to increase by USD 2.33 billion, at a CAGR of 35.7% from 2024 to 2029. Prohibitive economics and logistics of battery maintenance at massive IoT scale will drive the zero energy ai systems market.

Major Market Trends & Insights

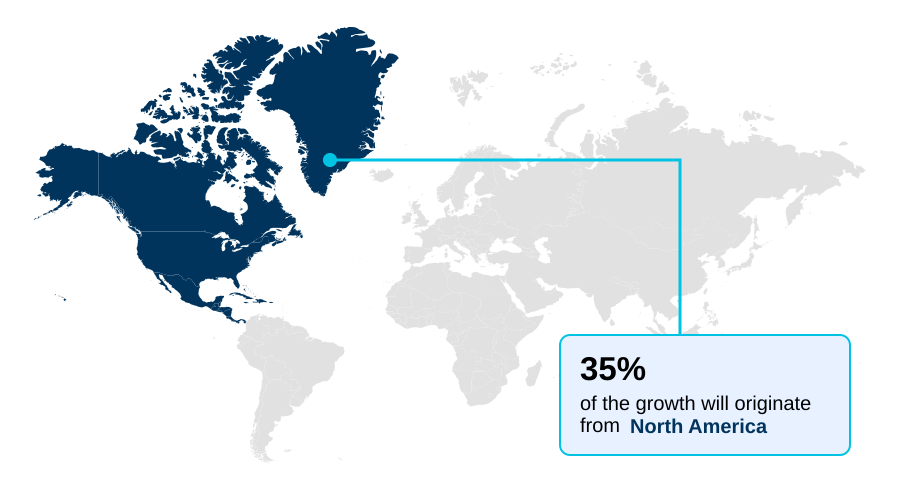
  • North America dominated the market and accounted for a 35.2% growth during the forecast period.
  • By Component - Hardware segment was valued at USD 279.4 million in 2023
  • By Application - Renewable energy management segment accounted for the largest market revenue share in 2023

Market Size & Forecast

  • Market Opportunities: USD 2.77 billion
  • Market Future Opportunities: USD 2.33 billion
  • CAGR from 2024 to 2029 : 35.7%

Market Summary

  • The Zero Energy AI Systems Market is driven by the convergence of ultra-low-power computing and mature energy harvesting technologies. This synergy addresses the unsustainable economics of battery maintenance in massive IoT deployments, offering a 'fit-and-forget' paradigm. The proliferation of TinyML frameworks and a shift toward event-driven processing architectures are critical trends, enabling on-device intelligence within a microwatt power budget.
  • By performing local data analysis, these systems minimize energy-intensive data transmission. However, the market faces challenges from severe power constraints, high initial integration costs, and a lack of industry standardization. In a practical business scenario, a logistics company can deploy batteryless trackers on millions of packages.
  • These devices, harvesting ambient radio frequency energy, provide real-time location and condition data, optimizing the supply chain and reducing losses from spoilage or theft without the operational burden of battery replacement. This enhances visibility and efficiency, demonstrating the technology's transformative potential beyond simple cost savings, aligning with broader sustainability and ESG mandates.
  • The market is transitioning from niche applications to a strategically important sector, unlocking new possibilities for a perpetually connected and intelligent world.

What will be the Size of the Zero Energy AI Systems Market during the forecast period?

Get Key Insights on Market Forecast (PDF) Request Free Sample

How is the Zero Energy AI Systems Market Segmented?

The zero energy ai systems industry research report provides comprehensive data (region-wise segment analysis), with forecasts and estimates in "USD million" for the period 2025-2029, as well as historical data from 2019-2023 for the following segments.
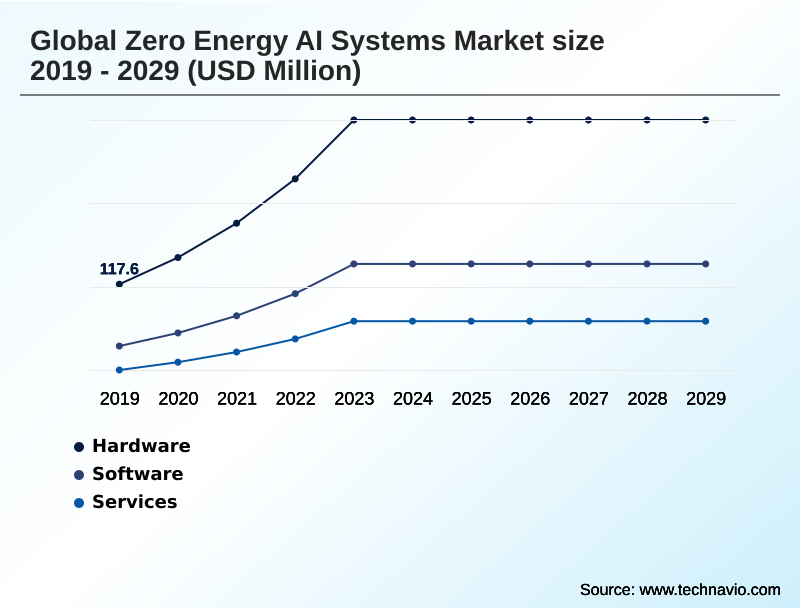
  • Component
    • Hardware
    • Software
    • Services
  • Application
    • Renewable energy management
    • Grid optimization and management
    • Demand forecasting
    • Energy storage optimization
    • Others
  • Deployment
    • On-premises
    • Cloud-based
  • Geography
    • North America
      • US
      • Canada
      • Mexico
    • APAC
      • China
      • Japan
      • India
    • Europe
      • Germany
      • UK
      • France
    • Middle East and Africa
      • UAE
      • Saudi Arabia
      • Israel
    • South America
      • Brazil
      • Argentina
      • Colombia
    • Rest of World (ROW)

By Component Insights

The hardware segment is estimated to witness significant growth during the forecast period.

The hardware segment for zero energy AI systems is defined by the convergence of ultra-low-power computing and advanced ambient energy harvesting.

This category includes all physical components enabling self-powered computing devices, from the power management integrated circuit that conditions energy from ambient power sources to the energy-efficient AI accelerators that run lightweight machine learning models.

A fundamental shift toward asynchronous computing architecture allows these batteryless IoT devices to perform complex tasks through event-driven processing. Innovation focuses on creating maintenance-free sensor networks capable of perpetual operation.

For example, recent hardware advancements enable a 40% increase in AI model complexity on the same power budget, expanding the scope of applications for tiny machine learning in industrial and commercial environments.

Request Free Sample

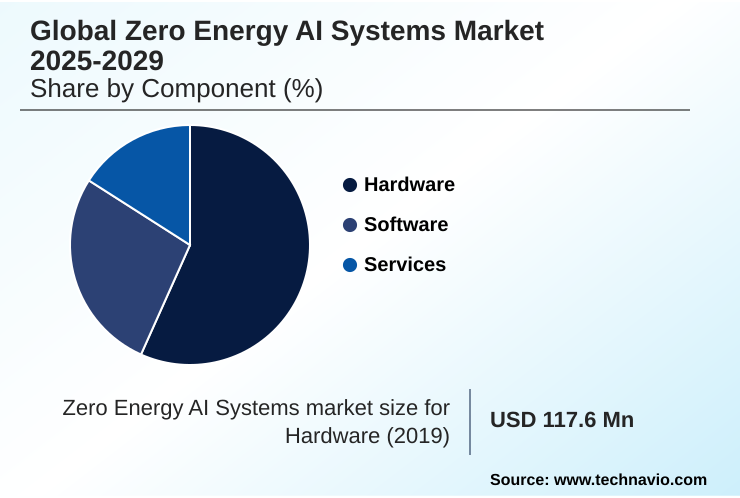
The Hardware segment was valued at USD 279.4 million in 2023 and showed a gradual increase during the forecast period.

Request Free Sample

Regional Analysis

North America is estimated to contribute 35.2% to the growth of the global market during the forecast period.Technavio’s analysts have elaborately explained the regional trends and drivers that shape the market during the forecast period.

See How Zero Energy AI Systems Market Demand is Rising in North America Request Free Sample

The geographic landscape is led by North America, which accounts for over 35% of the market, driven by high labor costs and a strong focus on industrial automation.

The total cost of ownership is a key consideration, pushing companies toward solutions that offer long-term operational savings. In Europe, stringent environmental social governance mandates and circular economy principles are significant drivers.

APAC is the fastest-growing region, with a focus on smart manufacturing and asset tracking intelligence to gain unbroken supply chain visibility. Adherence to corporate sustainability metrics is becoming a competitive differentiator globally.

For instance, deploying batteryless systems can reduce electronics-related waste by over 40%, directly impacting ESG reporting. The system integration complexity remains a challenge, but the benefits of grid efficiency optimization and enhanced battery storage safety are accelerating adoption.

Market Dynamics

Our researchers analyzed the data with 2024 as the base year, along with the key drivers, trends, and challenges. A holistic analysis of drivers will help companies refine their marketing strategies to gain a competitive advantage.

  • The future of batteryless intelligent devices is being defined by a range of specific use cases where the value proposition is highest. The application of zero energy AI for predictive maintenance is a primary focus, enabling continuous monitoring of industrial assets. In parallel, batteryless IoT for supply chain management is gaining traction by providing unprecedented visibility.
  • The development of ultra low power AI chip applications is crucial, with AI accelerators for microwatt applications enabling more complex on-device processing. Much of this innovation centers on energy sources, with ambient energy harvesting for smart agriculture, RF energy harvesting for retail analytics, and piezoelectric sensors for structural monitoring showing significant promise.
  • The reliability of multi source energy harvesting is a key trend, while the integration of a system on chip for wearable sensors is a long-term goal. However, integrating zero energy AI into IIoT platforms presents challenges, particularly regarding the power management for harvested energy. Organizations are increasingly evaluating on device inference vs cloud processing to balance latency and power consumption.
  • The primary business drivers are reducing TCO with zero energy sensors and the clear ESG benefits of batteryless technology, which far outweigh the initial investment in this transformative technology.

What are the key market drivers leading to the rise in the adoption of Zero Energy AI Systems Industry?

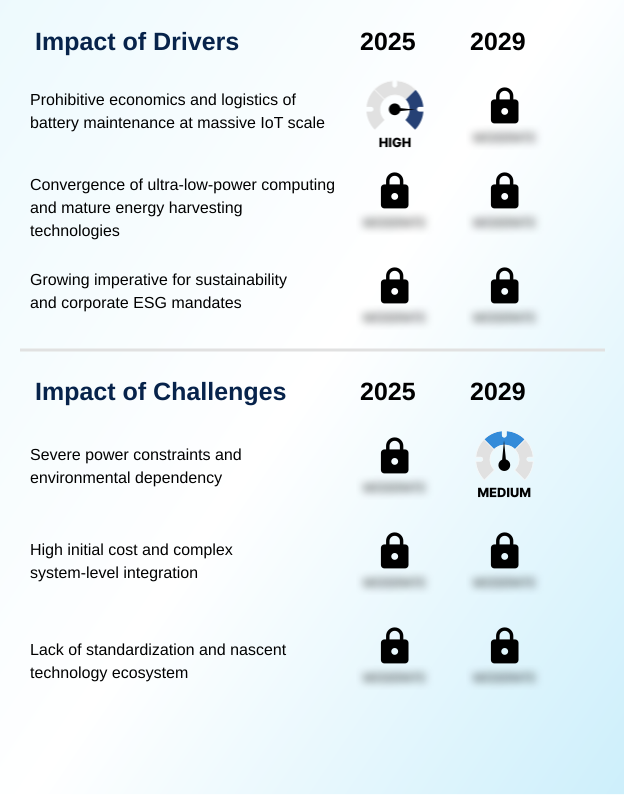
  • The prohibitive economics and logistical complexities of battery maintenance at massive IoT scale are a primary driver for the adoption of 'fit-and-forget' zero energy systems.

  • Market growth is fundamentally driven by the untenable economics of battery-powered IoT at scale and the powerful convergence of enabling technologies.
  • The fit-and-forget deployment model offered by these systems eliminates the substantial costs and logistical complexity of battery replacement, with some industrial internet of things applications reporting a 60% reduction in lifetime maintenance expenses.
  • This is made possible by mature ultra-low-power computing, including processors with near-threshold voltage design that operate in the nanowatt power range. The availability of effective predictive maintenance sensors and structural health monitoring solutions provides a clear return on investment.
  • For instance, deploying these sensors in smart factory automation can prevent critical asset failure, reducing downtime by up to 25%. This zero-maintenance deployment model is creating a ubiquitous sensing layer for smart infrastructure sensing.

What are the market trends shaping the Zero Energy AI Systems Industry?

  • The rapid proliferation of TinyML frameworks, combined with a fundamental shift toward event-driven computing architectures, is enabling sophisticated on-device intelligence within microwatt power budgets.

  • Key market trends are centered on increasing system intelligence and reliability within an extreme energy efficiency envelope. The drive toward a complete system-on-chip solution, or monolithic silicon integration, aims to reduce size and cost for mass deployment. This enables more sophisticated on-device AI inference and local data processing, powered by a microwatt power budget.
  • Concurrently, advancements in energy harvesting are diversifying power sources, with radio frequency energy harvesting for indoor applications and piezoelectric energy conversion for industrial settings becoming more common. This trend toward event-triggered computation allows devices to remain dormant until needed, which has been shown to extend operational life by over 90% compared to continuously-on systems.
  • For example, some systems using mechanical vibration harvesting in factories only activate when machinery is running, optimizing power use.

What challenges does the Zero Energy AI Systems Industry face during its growth?

  • Severe power constraints and dependency on intermittent ambient energy sources present a fundamental challenge to the reliability and computational capability of zero energy AI systems.

  • The market faces significant hurdles related to inherent power constraints and system complexity. The dependency on intermittent ambient energy sources makes achieving perpetual autonomous operation difficult, limiting applications to those that can tolerate potential downtime. While multi-source energy harvesting and ultra-low quiescent current components help, the sub-milliwatt power consumption budget severely restricts computational capabilities.
  • This forces aggressive AI model quantization and neural network pruning, which can impact accuracy. The high initial non-recurring engineering costs, sometimes 5-10 times that of a battery-powered alternative, also slow adoption.
  • Furthermore, the lack of standardization in embedded systems software and interfaces increases system integration complexity, creating barriers for widespread deployment in applications like cold chain monitoring, which requires over 99.9% uptime reliability.

Exclusive Technavio Analysis on Customer Landscape

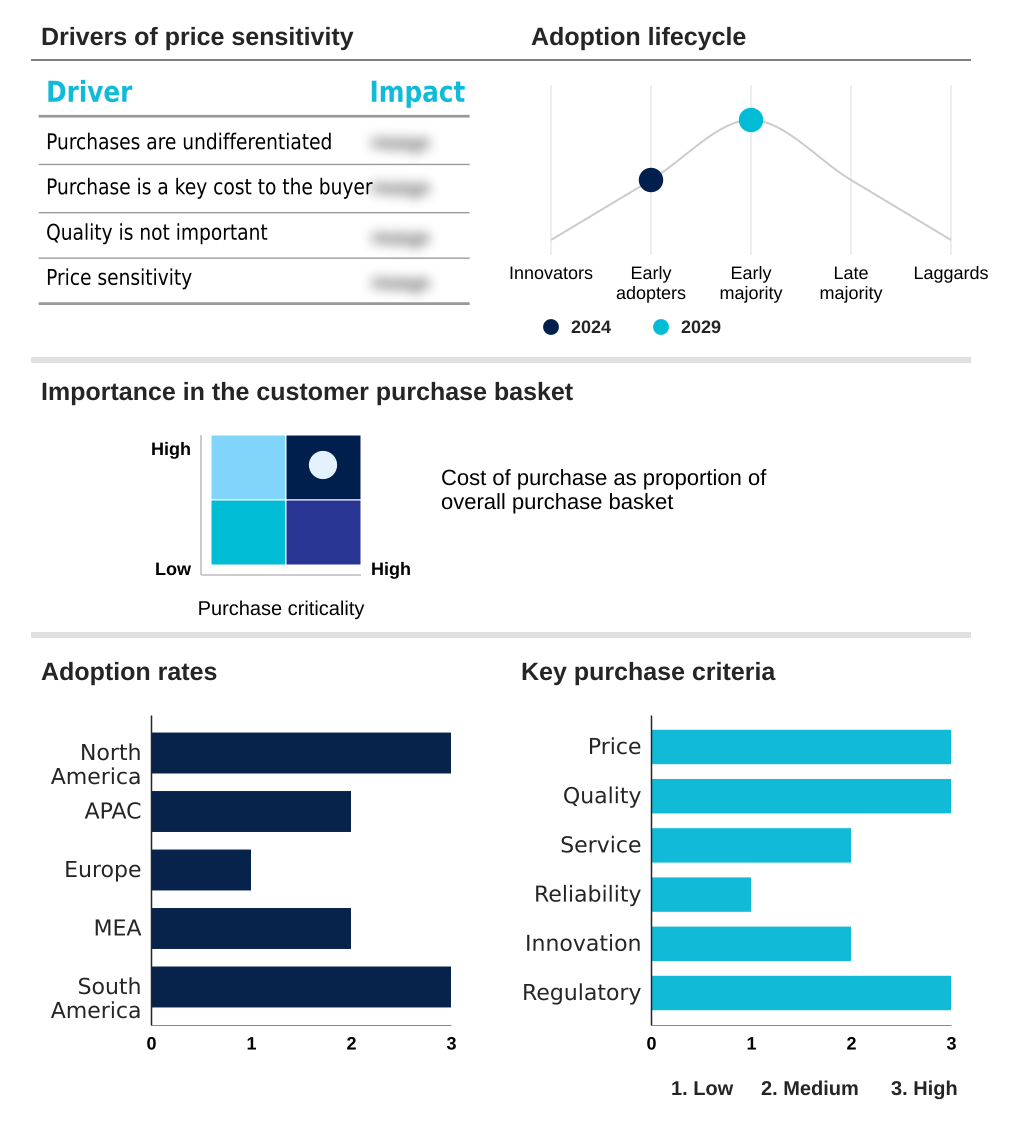
The zero energy ai systems market forecasting report includes the adoption lifecycle of the market, covering from the innovator’s stage to the laggard’s stage. It focuses on adoption rates in different regions based on penetration. Furthermore, the zero energy ai systems market report also includes key purchase criteria and drivers of price sensitivity to help companies evaluate and develop their market growth analysis strategies.

Customer Landscape of Zero Energy AI Systems Industry

Competitive Landscape

Companies are implementing various strategies, such as strategic alliances, zero energy ai systems market forecast, partnerships, mergers and acquisitions, geographical expansion, and product/service launches, to enhance their presence in the industry.

ABB Ltd. - Key solutions feature integrated systems leveraging on-device intelligence to optimize energy consumption within complex industrial automation environments.

The industry research and growth report includes detailed analyses of the competitive landscape of the market and information about key companies, including:

  • ABB Ltd.
  • Advanced Micro Devices Inc.
  • Ambient Scientific Inc.
  • BrainBox AI
  • C3.ai Inc.
  • GE Vernova Inc.
  • Google Cloud
  • Groq Inc.
  • Honeywell International Inc.
  • Intel Corp.
  • IBM Corp.
  • Microsoft Corp.
  • Mythic Inc.
  • NVIDIA Corp.
  • Oracle Corp.
  • Schneider Electric SE
  • Siemens AG
  • Syntiant Corp.
  • Tenstorrent Inc.
  • Tesla Inc.

Qualitative and quantitative analysis of companies has been conducted to help clients understand the wider business environment as well as the strengths and weaknesses of key industry players. Data is qualitatively analyzed to categorize companies as pure play, category-focused, industry-focused, and diversified; it is quantitatively analyzed to categorize companies as dominant, leading, strong, tentative, and weak.

Recent Development and News in Zero energy ai systems market

  • In September 2024, Ambient Scientific Inc. launched its new GPX-12 series AI processor, achieving a 50% reduction in power consumption for continuous audio processing applications, enabling always-on keyword spotting in batteryless devices.
  • In November 2024, Siemens AG and Syntiant Corp. announced a strategic partnership to integrate Syntiant’s neural decision processors into Siemens' next-generation industrial sensors for predictive maintenance, targeting a Q3 2025 rollout.
  • In January 2025, Mythic Inc. secured $150 million in Series D funding led by major venture capital firms to scale production of its analog compute-in-memory processors for energy-efficient edge AI.
  • In April 2025, a European standards body published the first draft standard for energy harvesting power management interfaces, a move expected to accelerate interoperability and reduce integration costs for zero energy systems.

Dive into Technavio’s robust research methodology, blending expert interviews, extensive data synthesis, and validated models for unparalleled Zero Energy AI Systems Market insights. See full methodology.

Market Scope
Page number 311
Base year 2024
Historic period 2019-2023
Forecast period 2025-2029
Growth momentum & CAGR Accelerate at a CAGR of 35.7%
Market growth 2025-2029 USD 2329.4 million
Market structure Fragmented
YoY growth 2024-2025(%) 31.3%
Key countries US, Canada, Mexico, China, Japan, India, South Korea, Australia, Indonesia, Germany, UK, France, Italy, Spain, The Netherlands, UAE, Saudi Arabia, Israel, South Africa, Turkey, Brazil, Argentina and Colombia
Competitive landscape Leading Companies, Market Positioning of Companies, Competitive Strategies, and Industry Risks

Request Free Sample

Research Analyst Overview

  • The market for zero energy AI systems is expanding, underpinned by innovations in ultra-low-power computing and ambient energy harvesting. This technological fusion enables the creation of batteryless IoT devices that use tiny machine learning and event-driven processing to achieve perpetual autonomous operation.
  • A key development is the power management integrated circuit, which efficiently handles energy from sources like radio frequency energy harvesting or piezoelectric energy conversion. These systems are moving toward a complete system-on-chip solution, leveraging asynchronous operation architecture and near-threshold voltage design to function within a nanowatt power range.
  • Applications are broadening from industrial internet of things use cases like predictive maintenance sensors and structural health monitoring to smart infrastructure sensing and cold chain monitoring. This shift is driven by the fit-and-forget deployment model, which addresses boardroom-level environmental social governance mandates by aligning with circular economy principles.
  • For instance, eliminating batteries can contribute to a 30% reduction in a product's e-waste footprint, directly impacting corporate sustainability goals and reducing the total cost of ownership.

What are the Key Data Covered in this Zero Energy AI Systems Market Research and Growth Report?

  • What is the expected growth of the Zero Energy AI Systems Market between 2025 and 2029?

    • USD 2.33 billion, at a CAGR of 35.7%

  • What segmentation does the market report cover?

    • The report is segmented by Component (Hardware, Software, and Services), Application (Renewable energy management, Grid optimization and management, Demand forecasting, Energy storage optimization, and Others), Deployment (On-premises, and Cloud-based) and Geography (North America, APAC, Europe, Middle East and Africa, South America)

  • Which regions are analyzed in the report?

    • North America, APAC, Europe, Middle East and Africa and South America

  • What are the key growth drivers and market challenges?

    • Prohibitive economics and logistics of battery maintenance at massive IoT scale, Severe power constraints and environmental dependency

  • Who are the major players in the Zero Energy AI Systems Market?

    • ABB Ltd., Advanced Micro Devices Inc., Ambient Scientific Inc., BrainBox AI, C3.ai Inc., GE Vernova Inc., Google Cloud, Groq Inc., Honeywell International Inc., Intel Corp., IBM Corp., Microsoft Corp., Mythic Inc., NVIDIA Corp., Oracle Corp., Schneider Electric SE, Siemens AG, Syntiant Corp., Tenstorrent Inc. and Tesla Inc.

Market Research Insights

  • The market dynamics are shaped by a push for long-term operational savings and enhanced asset intelligence. Innovations in hybrid power harvesting are improving system reliability, while the adoption of lightweight machine learning models allows for more sophisticated analytics at the edge.
  • The move towards a zero-maintenance deployment model is compelling for industries where asset failure prediction is critical, with some deployments showing a 30% reduction in unplanned downtime. Furthermore, the use of maintenance-free sensor networks in smart factory automation improves overall equipment effectiveness by up to 15%.
  • The overarching goal is achieving an indefinite operational lifespan for devices, transforming the economic model for large-scale IoT and enabling unbroken supply chain visibility.

We can help! Our analysts can customize this zero energy ai systems market research report to meet your requirements.

Get in touch

1. Executive Summary

1.1 Market overview

Executive Summary - Chart on Market Overview
Executive Summary - Data Table on Market Overview
Executive Summary - Chart on Global Market Characteristics
Executive Summary - Chart on Market by Geography
Executive Summary - Chart on Market Segmentation by Component
Executive Summary - Chart on Market Segmentation by Application
Executive Summary - Chart on Market Segmentation by Deployment
Executive Summary - Chart on Incremental Growth
Executive Summary - Data Table on Incremental Growth
Executive Summary - Chart on Company Market Positioning

2. Technavio Analysis

2.1 Analysis of price sensitivity, lifecycle, customer purchase basket, adoption rates, and purchase criteria

2.2 Criticality of inputs and Factors of differentiation

Chart on Overview on criticality of inputs and factors of differentiation

2.3 Factors of disruption

Chart on Overview on factors of disruption

2.4 Impact of drivers and challenges

Chart on Impact of drivers and challenges in 2024 and 2029

3. Market Landscape

3.1 Market ecosystem

Chart on Parent Market
Data Table on - Parent Market

3.2 Market characteristics

Chart on Market characteristics analysis

3.3 Value chain analysis

Chart on Value chain analysis

4. Market Sizing

4.1 Market definition

Data Table on Offerings of companies included in the market definition

4.2 Market segment analysis

Market segments

4.3 Market size 2024

4.4 Market outlook: Forecast for 2024-2029

Chart on Global - Market size and forecast 2024-2029 ($ million)
Data Table on Global - Market size and forecast 2024-2029 ($ million)
Chart on Global Market: Year-over-year growth 2024-2029 (%)
Data Table on Global Market: Year-over-year growth 2024-2029 (%)

5. Historic Market Size

5.1 Global Zero Energy AI Systems Market 2019 - 2023

Historic Market Size - Data Table on Global Zero Energy AI Systems Market 2019 - 2023 ($ million)

5.2 Component segment analysis 2019 - 2023

Historic Market Size - Component Segment 2019 - 2023 ($ million)

5.3 Application segment analysis 2019 - 2023

Historic Market Size - Application Segment 2019 - 2023 ($ million)

5.4 Deployment segment analysis 2019 - 2023

Historic Market Size - Deployment Segment 2019 - 2023 ($ million)

5.5 Geography segment analysis 2019 - 2023

Historic Market Size - Geography Segment 2019 - 2023 ($ million)

5.6 Country segment analysis 2019 - 2023

Historic Market Size - Country Segment 2019 - 2023 ($ million)

6. Five Forces Analysis

6.1 Five forces summary

Five forces analysis - Comparison between 2024 and 2029

6.2 Bargaining power of buyers

Bargaining power of buyers - Impact of key factors 2024 and 2029

6.3 Bargaining power of suppliers

Bargaining power of suppliers - Impact of key factors in 2024 and 2029

6.4 Threat of new entrants

Threat of new entrants - Impact of key factors in 2024 and 2029

6.5 Threat of substitutes

Threat of substitutes - Impact of key factors in 2024 and 2029

6.6 Threat of rivalry

Threat of rivalry - Impact of key factors in 2024 and 2029

6.7 Market condition

Chart on Market condition - Five forces 2024 and 2029

7. Market Segmentation by Component

7.1 Market segments

Chart on Component - Market share 2024-2029 (%)
Data Table on Component - Market share 2024-2029 (%)

7.2 Comparison by Component

Chart on Comparison by Component
Data Table on Comparison by Component

7.3 Hardware - Market size and forecast 2024-2029

Chart on Hardware - Market size and forecast 2024-2029 ($ million)
Data Table on Hardware - Market size and forecast 2024-2029 ($ million)
Chart on Hardware - Year-over-year growth 2024-2029 (%)
Data Table on Hardware - Year-over-year growth 2024-2029 (%)

7.4 Software - Market size and forecast 2024-2029

Chart on Software - Market size and forecast 2024-2029 ($ million)
Data Table on Software - Market size and forecast 2024-2029 ($ million)
Chart on Software - Year-over-year growth 2024-2029 (%)
Data Table on Software - Year-over-year growth 2024-2029 (%)

7.5 Services - Market size and forecast 2024-2029

Chart on Services - Market size and forecast 2024-2029 ($ million)
Data Table on Services - Market size and forecast 2024-2029 ($ million)
Chart on Services - Year-over-year growth 2024-2029 (%)
Data Table on Services - Year-over-year growth 2024-2029 (%)

7.6 Market opportunity by Component

Market opportunity by Component ($ million)
Data Table on Market opportunity by Component ($ million)

8. Market Segmentation by Application

8.1 Market segments

Chart on Application - Market share 2024-2029 (%)
Data Table on Application - Market share 2024-2029 (%)

8.2 Comparison by Application

Chart on Comparison by Application
Data Table on Comparison by Application

8.3 Renewable energy management - Market size and forecast 2024-2029

Chart on Renewable energy management - Market size and forecast 2024-2029 ($ million)
Data Table on Renewable energy management - Market size and forecast 2024-2029 ($ million)
Chart on Renewable energy management - Year-over-year growth 2024-2029 (%)
Data Table on Renewable energy management - Year-over-year growth 2024-2029 (%)

8.4 Grid optimization and management - Market size and forecast 2024-2029

Chart on Grid optimization and management - Market size and forecast 2024-2029 ($ million)
Data Table on Grid optimization and management - Market size and forecast 2024-2029 ($ million)
Chart on Grid optimization and management - Year-over-year growth 2024-2029 (%)
Data Table on Grid optimization and management - Year-over-year growth 2024-2029 (%)

8.5 Demand forecasting - Market size and forecast 2024-2029

Chart on Demand forecasting - Market size and forecast 2024-2029 ($ million)
Data Table on Demand forecasting - Market size and forecast 2024-2029 ($ million)
Chart on Demand forecasting - Year-over-year growth 2024-2029 (%)
Data Table on Demand forecasting - Year-over-year growth 2024-2029 (%)

8.6 Energy storage optimization - Market size and forecast 2024-2029

Chart on Energy storage optimization - Market size and forecast 2024-2029 ($ million)
Data Table on Energy storage optimization - Market size and forecast 2024-2029 ($ million)
Chart on Energy storage optimization - Year-over-year growth 2024-2029 (%)
Data Table on Energy storage optimization - Year-over-year growth 2024-2029 (%)

8.7 Others - Market size and forecast 2024-2029

Chart on Others - Market size and forecast 2024-2029 ($ million)
Data Table on Others - Market size and forecast 2024-2029 ($ million)
Chart on Others - Year-over-year growth 2024-2029 (%)
Data Table on Others - Year-over-year growth 2024-2029 (%)

8.8 Market opportunity by Application

Market opportunity by Application ($ million)
Data Table on Market opportunity by Application ($ million)

9. Market Segmentation by Deployment

9.1 Market segments

Chart on Deployment - Market share 2024-2029 (%)
Data Table on Deployment - Market share 2024-2029 (%)

9.2 Comparison by Deployment

Chart on Comparison by Deployment
Data Table on Comparison by Deployment

9.3 On-premises - Market size and forecast 2024-2029

Chart on On-premises - Market size and forecast 2024-2029 ($ million)
Data Table on On-premises - Market size and forecast 2024-2029 ($ million)
Chart on On-premises - Year-over-year growth 2024-2029 (%)
Data Table on On-premises - Year-over-year growth 2024-2029 (%)

9.4 Cloud-based - Market size and forecast 2024-2029

Chart on Cloud-based - Market size and forecast 2024-2029 ($ million)
Data Table on Cloud-based - Market size and forecast 2024-2029 ($ million)
Chart on Cloud-based - Year-over-year growth 2024-2029 (%)
Data Table on Cloud-based - Year-over-year growth 2024-2029 (%)

9.5 Market opportunity by Deployment

Market opportunity by Deployment ($ million)
Data Table on Market opportunity by Deployment ($ million)

10. Customer Landscape

10.1 Customer landscape overview

Analysis of price sensitivity, lifecycle, customer purchase basket, adoption rates, and purchase criteria

11. Geographic Landscape

11.1 Geographic segmentation

Chart on Market share by geography 2024-2029 (%)
Data Table on Market share by geography 2024-2029 (%)

11.2 Geographic comparison

Chart on Geographic comparison
Data Table on Geographic comparison

11.3 North America - Market size and forecast 2024-2029

Chart on North America - Market size and forecast 2024-2029 ($ million)
Data Table on North America - Market size and forecast 2024-2029 ($ million)
Chart on North America - Year-over-year growth 2024-2029 (%)
Data Table on North America - Year-over-year growth 2024-2029 (%)
Chart on Regional Comparison - North America
Data Table on Regional Comparison - North America

11.3.1 US - Market size and forecast 2024-2029

Chart on US - Market size and forecast 2024-2029 ($ million)
Data Table on US - Market size and forecast 2024-2029 ($ million)
Chart on US - Year-over-year growth 2024-2029 (%)
Data Table on US - Year-over-year growth 2024-2029 (%)

11.3.2 Canada - Market size and forecast 2024-2029

Chart on Canada - Market size and forecast 2024-2029 ($ million)
Data Table on Canada - Market size and forecast 2024-2029 ($ million)
Chart on Canada - Year-over-year growth 2024-2029 (%)
Data Table on Canada - Year-over-year growth 2024-2029 (%)

11.3.3 Mexico - Market size and forecast 2024-2029

Chart on Mexico - Market size and forecast 2024-2029 ($ million)
Data Table on Mexico - Market size and forecast 2024-2029 ($ million)
Chart on Mexico - Year-over-year growth 2024-2029 (%)
Data Table on Mexico - Year-over-year growth 2024-2029 (%)

11.4 APAC - Market size and forecast 2024-2029

Chart on APAC - Market size and forecast 2024-2029 ($ million)
Data Table on APAC - Market size and forecast 2024-2029 ($ million)
Chart on APAC - Year-over-year growth 2024-2029 (%)
Data Table on APAC - Year-over-year growth 2024-2029 (%)
Chart on Regional Comparison - APAC
Data Table on Regional Comparison - APAC

11.4.1 China - Market size and forecast 2024-2029

Chart on China - Market size and forecast 2024-2029 ($ million)
Data Table on China - Market size and forecast 2024-2029 ($ million)
Chart on China - Year-over-year growth 2024-2029 (%)
Data Table on China - Year-over-year growth 2024-2029 (%)

11.4.2 Japan - Market size and forecast 2024-2029

Chart on Japan - Market size and forecast 2024-2029 ($ million)
Data Table on Japan - Market size and forecast 2024-2029 ($ million)
Chart on Japan - Year-over-year growth 2024-2029 (%)
Data Table on Japan - Year-over-year growth 2024-2029 (%)

11.4.3 India - Market size and forecast 2024-2029

Chart on India - Market size and forecast 2024-2029 ($ million)
Data Table on India - Market size and forecast 2024-2029 ($ million)
Chart on India - Year-over-year growth 2024-2029 (%)
Data Table on India - Year-over-year growth 2024-2029 (%)

11.4.4 South Korea - Market size and forecast 2024-2029

Chart on South Korea - Market size and forecast 2024-2029 ($ million)
Data Table on South Korea - Market size and forecast 2024-2029 ($ million)
Chart on South Korea - Year-over-year growth 2024-2029 (%)
Data Table on South Korea - Year-over-year growth 2024-2029 (%)

11.4.5 Australia - Market size and forecast 2024-2029

Chart on Australia - Market size and forecast 2024-2029 ($ million)
Data Table on Australia - Market size and forecast 2024-2029 ($ million)
Chart on Australia - Year-over-year growth 2024-2029 (%)
Data Table on Australia - Year-over-year growth 2024-2029 (%)

11.4.6 Indonesia - Market size and forecast 2024-2029

Chart on Indonesia - Market size and forecast 2024-2029 ($ million)
Data Table on Indonesia - Market size and forecast 2024-2029 ($ million)
Chart on Indonesia - Year-over-year growth 2024-2029 (%)
Data Table on Indonesia - Year-over-year growth 2024-2029 (%)

11.5 Europe - Market size and forecast 2024-2029

Chart on Europe - Market size and forecast 2024-2029 ($ million)
Data Table on Europe - Market size and forecast 2024-2029 ($ million)
Chart on Europe - Year-over-year growth 2024-2029 (%)
Data Table on Europe - Year-over-year growth 2024-2029 (%)
Chart on Regional Comparison - Europe
Data Table on Regional Comparison - Europe

11.5.1 Germany - Market size and forecast 2024-2029

Chart on Germany - Market size and forecast 2024-2029 ($ million)
Data Table on Germany - Market size and forecast 2024-2029 ($ million)
Chart on Germany - Year-over-year growth 2024-2029 (%)
Data Table on Germany - Year-over-year growth 2024-2029 (%)

11.5.2 UK - Market size and forecast 2024-2029

Chart on UK - Market size and forecast 2024-2029 ($ million)
Data Table on UK - Market size and forecast 2024-2029 ($ million)
Chart on UK - Year-over-year growth 2024-2029 (%)
Data Table on UK - Year-over-year growth 2024-2029 (%)

11.5.3 France - Market size and forecast 2024-2029

Chart on France - Market size and forecast 2024-2029 ($ million)
Data Table on France - Market size and forecast 2024-2029 ($ million)
Chart on France - Year-over-year growth 2024-2029 (%)
Data Table on France - Year-over-year growth 2024-2029 (%)

11.5.4 Italy - Market size and forecast 2024-2029

Chart on Italy - Market size and forecast 2024-2029 ($ million)
Data Table on Italy - Market size and forecast 2024-2029 ($ million)
Chart on Italy - Year-over-year growth 2024-2029 (%)
Data Table on Italy - Year-over-year growth 2024-2029 (%)

11.5.5 Spain - Market size and forecast 2024-2029

Chart on Spain - Market size and forecast 2024-2029 ($ million)
Data Table on Spain - Market size and forecast 2024-2029 ($ million)
Chart on Spain - Year-over-year growth 2024-2029 (%)
Data Table on Spain - Year-over-year growth 2024-2029 (%)

11.5.6 The Netherlands - Market size and forecast 2024-2029

Chart on The Netherlands - Market size and forecast 2024-2029 ($ million)
Data Table on The Netherlands - Market size and forecast 2024-2029 ($ million)
Chart on The Netherlands - Year-over-year growth 2024-2029 (%)
Data Table on The Netherlands - Year-over-year growth 2024-2029 (%)

11.6 Middle East and Africa - Market size and forecast 2024-2029

Chart on Middle East and Africa - Market size and forecast 2024-2029 ($ million)
Data Table on Middle East and Africa - Market size and forecast 2024-2029 ($ million)
Chart on Middle East and Africa - Year-over-year growth 2024-2029 (%)
Data Table on Middle East and Africa - Year-over-year growth 2024-2029 (%)
Chart on Regional Comparison - Middle East and Africa
Data Table on Regional Comparison - Middle East and Africa

11.6.1 UAE - Market size and forecast 2024-2029

Chart on UAE - Market size and forecast 2024-2029 ($ million)
Data Table on UAE - Market size and forecast 2024-2029 ($ million)
Chart on UAE - Year-over-year growth 2024-2029 (%)
Data Table on UAE - Year-over-year growth 2024-2029 (%)

11.6.2 Saudi Arabia - Market size and forecast 2024-2029

Chart on Saudi Arabia - Market size and forecast 2024-2029 ($ million)
Data Table on Saudi Arabia - Market size and forecast 2024-2029 ($ million)
Chart on Saudi Arabia - Year-over-year growth 2024-2029 (%)
Data Table on Saudi Arabia - Year-over-year growth 2024-2029 (%)

11.6.3 Israel - Market size and forecast 2024-2029

Chart on Israel - Market size and forecast 2024-2029 ($ million)
Data Table on Israel - Market size and forecast 2024-2029 ($ million)
Chart on Israel - Year-over-year growth 2024-2029 (%)
Data Table on Israel - Year-over-year growth 2024-2029 (%)

11.6.4 South Africa - Market size and forecast 2024-2029

Chart on South Africa - Market size and forecast 2024-2029 ($ million)
Data Table on South Africa - Market size and forecast 2024-2029 ($ million)
Chart on South Africa - Year-over-year growth 2024-2029 (%)
Data Table on South Africa - Year-over-year growth 2024-2029 (%)

11.6.5 Turkey - Market size and forecast 2024-2029

Chart on Turkey - Market size and forecast 2024-2029 ($ million)
Data Table on Turkey - Market size and forecast 2024-2029 ($ million)
Chart on Turkey - Year-over-year growth 2024-2029 (%)
Data Table on Turkey - Year-over-year growth 2024-2029 (%)

11.7 South America - Market size and forecast 2024-2029

Chart on South America - Market size and forecast 2024-2029 ($ million)
Data Table on South America - Market size and forecast 2024-2029 ($ million)
Chart on South America - Year-over-year growth 2024-2029 (%)
Data Table on South America - Year-over-year growth 2024-2029 (%)
Chart on Regional Comparison - South America
Data Table on Regional Comparison - South America

11.7.1 Brazil - Market size and forecast 2024-2029

Chart on Brazil - Market size and forecast 2024-2029 ($ million)
Data Table on Brazil - Market size and forecast 2024-2029 ($ million)
Chart on Brazil - Year-over-year growth 2024-2029 (%)
Data Table on Brazil - Year-over-year growth 2024-2029 (%)

11.7.2 Argentina - Market size and forecast 2024-2029

Chart on Argentina - Market size and forecast 2024-2029 ($ million)
Data Table on Argentina - Market size and forecast 2024-2029 ($ million)
Chart on Argentina - Year-over-year growth 2024-2029 (%)
Data Table on Argentina - Year-over-year growth 2024-2029 (%)

11.7.3 Colombia - Market size and forecast 2024-2029

Chart on Colombia - Market size and forecast 2024-2029 ($ million)
Data Table on Colombia - Market size and forecast 2024-2029 ($ million)
Chart on Colombia - Year-over-year growth 2024-2029 (%)
Data Table on Colombia - Year-over-year growth 2024-2029 (%)

11.8 Market opportunity by geography

Market opportunity by geography ($ million)
Data Tables on Market opportunity by geography ($ million)

12. Drivers, Challenges, and Opportunity

12.1 Market drivers

Prohibitive economics and logistics of battery maintenance at massive IoT scale
Convergence of ultra-low-power computing and mature energy harvesting technologies
Growing imperative for sustainability and corporate ESG mandates

12.2 Market challenges

Severe power constraints and environmental dependency
High initial cost and complex system-level integration
Lack of standardization and nascent technology ecosystem

12.3 Impact of drivers and challenges

Impact of drivers and challenges in 2024 and 2029

12.4 Market opportunities

Proliferation of TinyML and shift to event-driven processing
Emergence of multi-source energy harvesting for enhanced reliability
System-level integration and miniaturization toward single-chip solutions

13. Competitive Landscape

13.1 Overview

13.2

Overview on criticality of inputs and factors of differentiation

13.3 Landscape disruption

Overview on factors of disruption

13.4 Industry risks

Impact of key risks on business

14. Competitive Analysis

14.1 Companies profiled

Companies covered

14.2 Company ranking index

14.3 Market positioning of companies

Matrix on companies position and classification

14.4 ABB Ltd.

ABB Ltd. - Overview
ABB Ltd. - Business segments
ABB Ltd. - Key news
ABB Ltd. - Key offerings
ABB Ltd. - Segment focus
SWOT

14.5 Advanced Micro Devices Inc.

Advanced Micro Devices Inc. - Overview
Advanced Micro Devices Inc. - Business segments
Advanced Micro Devices Inc. - Key news
Advanced Micro Devices Inc. - Key offerings
Advanced Micro Devices Inc. - Segment focus
SWOT

14.6 C3.ai Inc.

C3.ai Inc. - Overview
C3.ai Inc. - Product / Service
C3.ai Inc. - Key news
C3.ai Inc. - Key offerings
SWOT

14.7 GE Vernova Inc.

GE Vernova Inc. - Overview
GE Vernova Inc. - Business segments
GE Vernova Inc. - Key offerings
GE Vernova Inc. - Segment focus
SWOT

14.8 Google Cloud

Google Cloud - Overview
Google Cloud - Product / Service
Google Cloud - Key offerings
SWOT

14.9 Honeywell International Inc.

Honeywell International Inc. - Overview
Honeywell International Inc. - Business segments
Honeywell International Inc. - Key news
Honeywell International Inc. - Key offerings
Honeywell International Inc. - Segment focus
SWOT

14.10 Intel Corp.

Intel Corp. - Overview
Intel Corp. - Business segments
Intel Corp. - Key news
Intel Corp. - Key offerings
Intel Corp. - Segment focus
SWOT

14.11 IBM Corp.

IBM Corp. - Overview
IBM Corp. - Business segments
IBM Corp. - Key news
IBM Corp. - Key offerings
IBM Corp. - Segment focus
SWOT

14.12 Microsoft Corp.

Microsoft Corp. - Overview
Microsoft Corp. - Business segments
Microsoft Corp. - Key news
Microsoft Corp. - Key offerings
Microsoft Corp. - Segment focus
SWOT

14.13 NVIDIA Corp.

NVIDIA Corp. - Overview
NVIDIA Corp. - Business segments
NVIDIA Corp. - Key news
NVIDIA Corp. - Key offerings
NVIDIA Corp. - Segment focus
SWOT

14.14 Oracle Corp.

Oracle Corp. - Overview
Oracle Corp. - Business segments
Oracle Corp. - Key news
Oracle Corp. - Key offerings
Oracle Corp. - Segment focus
SWOT

14.15 Schneider Electric SE

Schneider Electric SE - Overview
Schneider Electric SE - Business segments
Schneider Electric SE - Key offerings
Schneider Electric SE - Segment focus
SWOT

14.16 Siemens AG

Siemens AG - Overview
Siemens AG - Business segments
Siemens AG - Key news
Siemens AG - Key offerings
Siemens AG - Segment focus
SWOT

14.17 Tenstorrent Inc.

Tenstorrent Inc. - Overview
Tenstorrent Inc. - Product / Service
Tenstorrent Inc. - Key offerings
SWOT

14.18 Tesla Inc.

Tesla Inc. - Overview
Tesla Inc. - Business segments
Tesla Inc. - Key news
Tesla Inc. - Key offerings
Tesla Inc. - Segment focus
SWOT

15. Appendix

15.1 Scope of the report

Market definition
Objectives
Notes and caveats

15.2 Inclusions and exclusions checklist

Inclusions checklist
Exclusions checklist

15.3 Currency conversion rates for US$

15.4 Research methodology

15.5 Data procurement

Information sources

15.6 Data validation

15.7 Validation techniques employed for market sizing

15.8 Data synthesis

15.9 360 degree market analysis

15.10 List of abbreviations

Research Methodology

Technavio presents a detailed picture of the market by way of study, synthesis, and summation of data from multiple sources. The analysts have presented the various facets of the market with a particular focus on identifying the key industry influencers. The data thus presented is comprehensive, reliable, and the result of extensive research, both primary and secondary.

INFORMATION SOURCES

Primary sources

  • Manufacturers and suppliers
  • Channel partners
  • Industry experts
  • Strategic decision makers

Secondary sources

  • Industry journals and periodicals
  • Government data
  • Financial reports of key industry players
  • Historical data
  • Press releases

DATA ANALYSIS

Data Synthesis

  • Collation of data
  • Estimation of key figures
  • Analysis of derived insights

Data Validation

  • Triangulation with data models
  • Reference against proprietary databases
  • Corroboration with industry experts

REPORT WRITING

Qualitative

  • Market drivers
  • Market challenges
  • Market trends
  • Five forces analysis

Quantitative

  • Market size and forecast
  • Market segmentation
  • Geographical insights
  • Competitive landscape

Interested in this report?

Get your sample now to see our research methodology and insights!

Download Now

Frequently Asked Questions

Zero Energy AI Systems market growth will increase by USD 2329.4 million during 2025-2029.

The Zero Energy AI Systems market is expected to grow at a CAGR of 35.7% during 2025-2029.

Zero Energy AI Systems market is segmented by Component (Hardware, Software, Services) Application (Renewable energy management, Grid optimization and management, Demand forecasting, Energy storage optimization, Others) Deployment (On-premises, Cloud-based)

ABB Ltd., Advanced Micro Devices Inc., Ambient Scientific Inc., BrainBox AI, C3.ai Inc., GE Vernova Inc., Google Cloud, Groq Inc., Honeywell International Inc., Intel Corp., IBM Corp., Microsoft Corp., Mythic Inc., NVIDIA Corp., Oracle Corp., Schneider Electric SE, Siemens AG, Syntiant Corp., Tenstorrent Inc., Tesla Inc. are a few of the key vendors in the Zero Energy AI Systems market.

North America will register the highest growth rate of 35.2% among the other regions. Therefore, the Zero Energy AI Systems market in North America is expected to garner significant business opportunities for the vendors during the forecast period.

US, Canada, Mexico, China, Japan, India, South Korea, Australia, Indonesia, Germany, UK, France, Italy, Spain, The Netherlands, UAE, Saudi Arabia, Israel, South Africa, Turkey, Brazil, Argentina, Colombia

  • Prohibitive economics and logistics of battery maintenance at massive IoT scale is the driving factor this market.

The Zero Energy AI Systems market vendors should focus on grabbing business opportunities from the Component segment as it accounted for the largest market share in the base year.