
Ai-powered Iot Systems Market Size 2026-2030
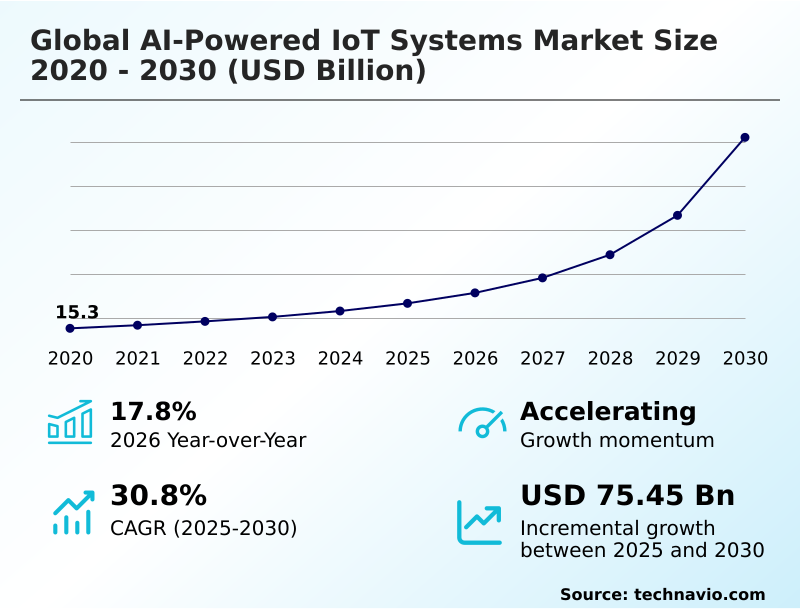
The Ai-powered Iot Systems Market size was valued at USD 26.66 billion in 2025, growing at a CAGR of 30.8% during the forecast period 2026-2030.
Major Market Trends & Insights
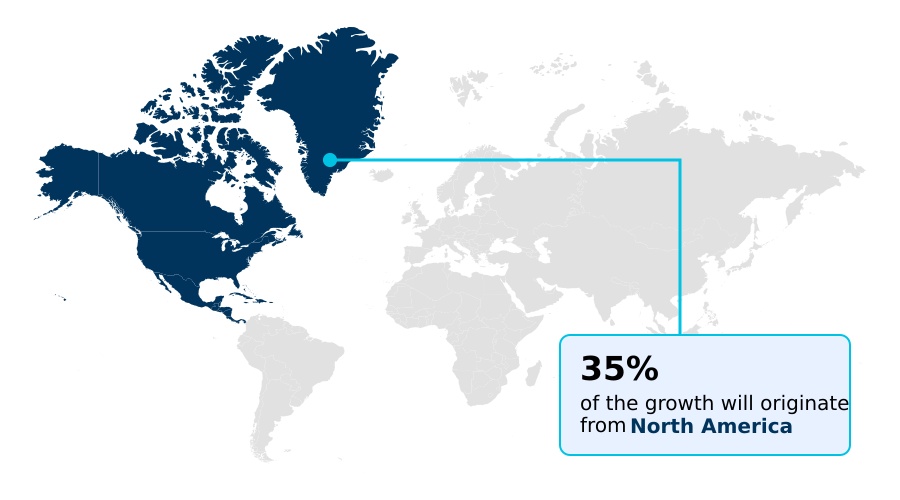
- North America dominated the market and accounted for a 34.8% growth during the forecast period.
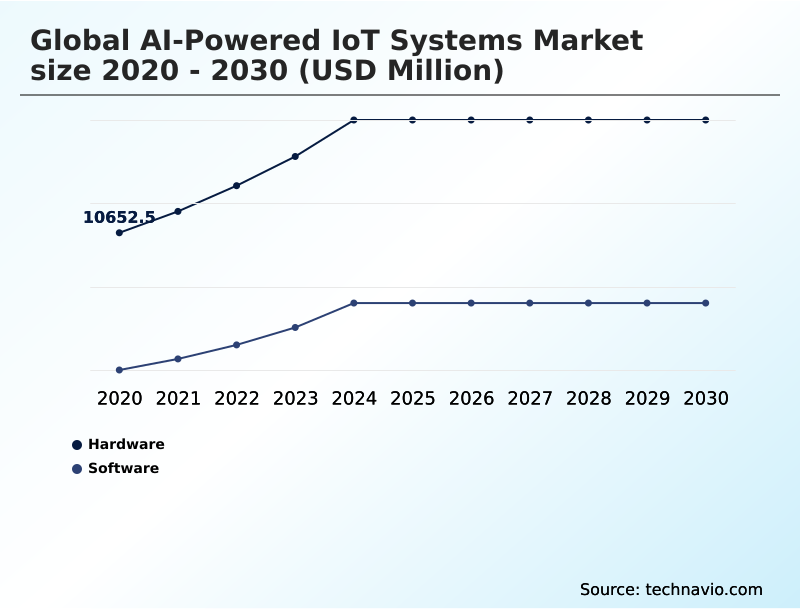
- By Component - Hardware segment was valued at USD 15.59 billion in 2024
- By Deployment - On-premises segment accounted for the largest market revenue share in 2024
Market Size & Forecast
- Historic Market Opportunities 2020-2024: USD 86.81 billion
- Market Future Opportunities 2025-2030: USD 75.45 billion
- CAGR from 2025 to 2030 : 30.8%
Market Summary
- The AI-powered IoT systems market is defined by the convergence of intelligent algorithms with interconnected hardware, enabling a shift from reactive to proactive operational models. For instance, in manufacturing, integrating machine learning algorithms with sensor networks allows for predictive maintenance, reducing unplanned downtime by up to 30% compared to traditional scheduled repairs.
- A primary driver is the necessity to process high-velocity data in real time, which is achieved through edge computing architectures that deliver over 50% lower latency than centralized cloud models. This capability supports intelligent automation and asset optimization across industrial environments.
- However, the market faces a significant challenge from the fragmentation of industry standards, which creates data silos and complicates the integration of devices from multiple vendors. This lack of interoperability can hinder the development of cohesive, large-scale autonomous systems and increases the total cost of ownership for enterprises seeking digital transformation.
What will be the Size of the Ai-powered Iot Systems Market during the forecast period?
Get Key Insights on Market Forecast (PDF) Request Free Sample
How is the Ai-powered Iot Systems Market Segmented?
The ai-powered iot systems industry research report provides comprehensive data (region-wise segment analysis), with forecasts and analysis for the period 2026-2030, as well as historical data from 2020-2024 for the following segments.
- Component
- Hardware
- Software
- Deployment
- On-premises
- Cloud
- Technology
- Machine learning
- Deep learning
- Natural language processing
- Others
- End-user
- Manufacturing
- Healthcare
- IT and telecom
- Energy and utility
- Others
- Geography
- North America
- US
- Canada
- Mexico
- Europe
- Germany
- UK
- France
- APAC
- China
- Japan
- South Korea
- South America
- Brazil
- Argentina
- Colombia
- Middle East and Africa
- South Africa
- Saudi Arabia
- UAE
- Rest of World (ROW)
- North America
How is the Ai-powered Iot Systems Market Segmented by Component?
The hardware segment is estimated to witness significant growth during the forecast period.
The hardware segment, featuring advancements like AI-capable sensors, is reducing data processing latency by up to 60% at the network edge. These components, including AI accelerators and IoT gateways, form the foundational physical layer for cognitive networks.
Specialized neural processing units now deliver a 4x improvement in performance-per-watt for on-device machine learning operations, enabling more complex computer vision algorithms to run efficiently without constant cloud dependency.
The evolution of this segment is defined by the shift toward localized, real-time data processing, where ruggedized hardware ensures operational reliability in demanding industrial environments.
This transition supports greater data privacy and is essential for building resilient infrastructure for autonomous systems and intelligent automation across global enterprises.
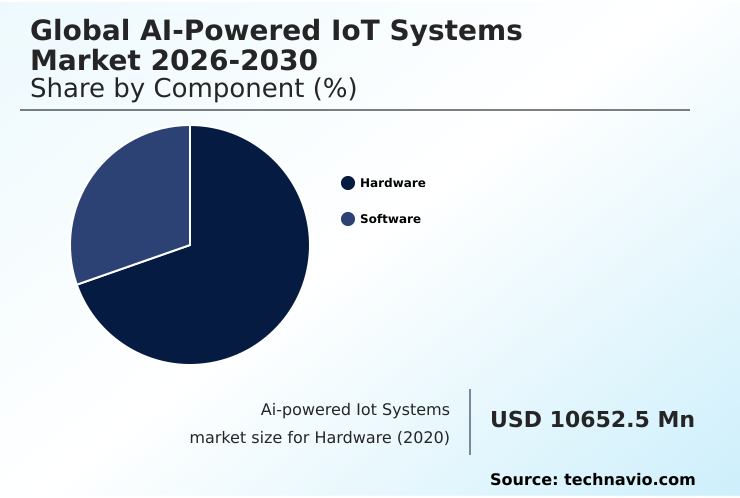
The Hardware segment was valued at USD 15.59 billion in 2024 and showed a gradual increase during the forecast period.
How demand for the Ai-powered Iot Systems market is rising in the leading region?
North America is estimated to contribute 34.8% to the growth of the global market during the forecast period.Technavio’s analysts have elaborately explained the regional trends and drivers that shape the market during the forecast period.
See How Ai-powered Iot Systems Market demand is rising in North America Request Free Sample
The geographic landscape of the global ai-powered iot systems market 2026-2030 is led by North America, which is projected to contribute 34.8% of the market's incremental growth, driven by advanced technological infrastructure.
However, APAC is forecast to exhibit a higher growth rate of 33.4% compared to North America's 29.7%, fueled by rapid industrial investment. Within North America, the US dominates, with its market size being over four times larger than China's.
This disparity reflects different adoption drivers: US enterprises focus on industrial hyper-automation and predictive maintenance, leveraging established cloud AI services, while APAC, particularly China, prioritizes large-scale smart manufacturing and autonomous logistics supported by a strong hardware ecosystem.
These regional differences in supply chains and consumer behavior necessitate tailored strategies for deploying AI-capable sensors and ensuring regulatory compliance with local data sovereignty laws.
What are the key Drivers, Trends, and Challenges in the Ai-powered Iot Systems Market?
Our researchers analyzed the data with 2025 as the base year, along with the key drivers, trends, and challenges. A holistic analysis of drivers will help companies refine their marketing strategies to gain a competitive advantage.
- Enterprises evaluating the global ai-powered iot systems market 2026-2030 often begin by analyzing how ai powered iot for predictive maintenance can enhance operational reliability.
- A key area of inquiry is the generative ai and digital twin integration, which enables the creation of dynamic virtual models that can simulate millions of operational scenarios, improving failure prediction accuracy by over 40% compared to standalone analytics.
- Understanding the benefits of agentic ai in iot is also critical, as these autonomous frameworks can coordinate actions across distributed networks, leading to a 25% improvement in logistics efficiency in automated warehouse environments. The implementation of edge computing in aiot systems addresses latency concerns, which is a crucial factor for real-time applications.
- However, organizations must also address the cybersecurity challenges in ai powered iot. The vulnerability of heterogeneous networks requires robust security protocols and zero-trust architectures to protect against increasingly sophisticated threats. Successfully navigating these technical and security considerations allows businesses to harness the full potential of intelligent automation, turning high-velocity data into actionable insights for a sustained competitive advantage.
- Deploying these systems effectively requires a strategic approach that balances innovation with practical risk management.
What are the key market drivers leading to the rise in the adoption of Ai-powered Iot Systems Industry?
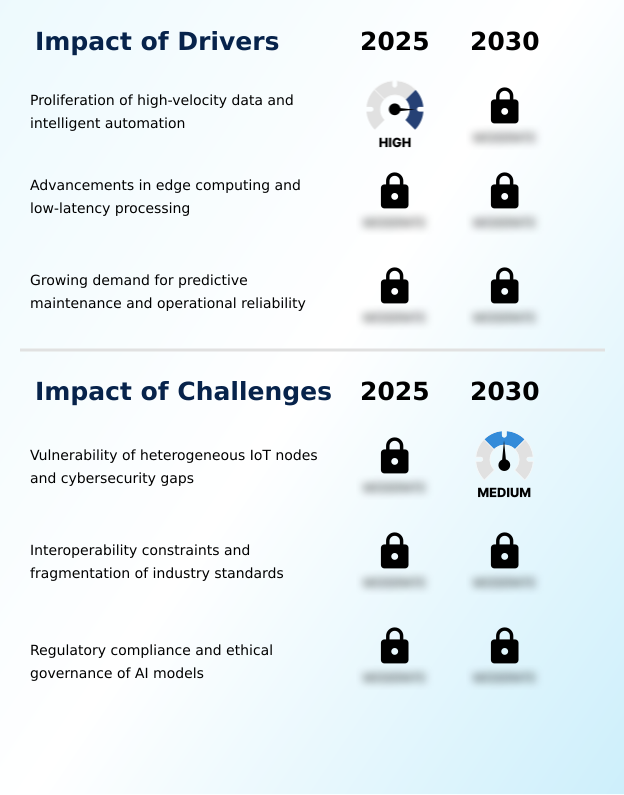
- The proliferation of high-velocity data, coupled with the need for intelligent automation, is a primary driver for the market's growth.
- Advancements in edge computing enable on-device AI that reduces data transmission to the cloud by up to 75%, a key driver for market growth.
- This architectural shift facilitates low-latency processing, cutting response times by more than half compared to purely cloud-based systems, which is critical for autonomous systems in manufacturing and transportation.
- By moving intelligence closer to the source of data generation, enterprises can enhance data privacy and ensure operational reliability even with intermittent connectivity. This decentralization supports the development of more resilient infrastructure and fosters intelligent automation.
- The increasing availability of powerful yet efficient AI accelerators and edge AI platforms is making these deployments more accessible, fueling broader adoption across industries.
What are the market trends shaping the Ai-powered Iot Systems Industry?
- A key market trend is the convergence of industrial digital twins with generative AI. This integration enables the creation of autonomous virtual replicas for predictive simulation and optimization.
- The integration of generative AI models with industrial digital twins is improving simulation accuracy by over 40%, marking a significant trend. This synergy allows for autonomous optimization, with some systems capable of suggesting operational changes that enhance throughput by up to 15%.
- This shift from passive monitoring to proactive control is driven by the need for more resilient infrastructure and efficient asset optimization. As a result, businesses are leveraging these advanced cognitive networks to accelerate innovation cycles and reduce operational costs.
- The trend is creating demand for high-fidelity real-time data processing and seamless workflow interoperability between physical assets and their virtual counterparts, enabling a new level of intelligent automation.
What challenges does the Ai-powered Iot Systems Industry face during its growth?
- The vulnerability of heterogeneous IoT nodes and associated cybersecurity gaps presents a significant challenge to industry growth.
- Interoperability constraints arising from industry standards fragmentation lead to integration costs that are up to 50% higher for projects involving multiple proprietary platforms. This is a major challenge for the global ai-powered iot systems market 2026-2030, as this fragmentation creates data silos which can reduce the effectiveness of network-wide AI analytics by as much as 30%.
- The existence of numerous proprietary platforms and disparate communication protocols hinders the seamless flow of information between devices, limiting the potential of cognitive networks. Without unified data standards, developing scalable and truly interconnected autonomous systems becomes complex and costly.
- This situation forces enterprises to invest in custom middleware or commit to single-vendor ecosystems, thereby stifling innovation and slowing the pace of digital transformation.
Exclusive Technavio Analysis on Customer Landscape
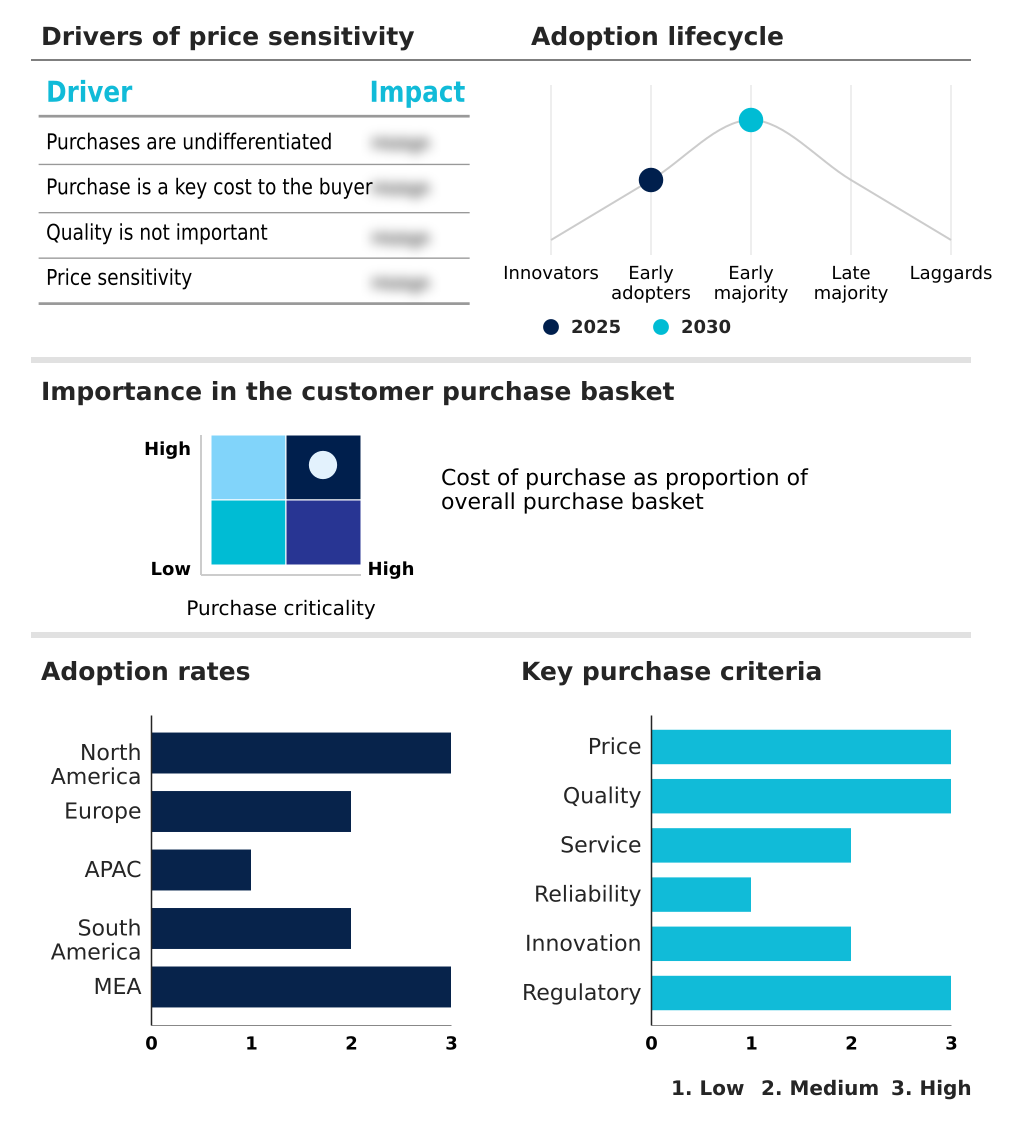
The ai-powered iot systems market forecasting report includes the adoption lifecycle of the market, covering from the innovator’s stage to the laggard’s stage. It focuses on adoption rates in different regions based on penetration. Furthermore, the ai-powered iot systems market report also includes key purchase criteria and drivers of price sensitivity to help companies evaluate and develop their market growth analysis strategies.
Customer Landscape of Ai-powered Iot Systems Industry
Competitive Landscape
Companies are implementing various strategies, such as strategic alliances, ai-powered iot systems market forecast, partnerships, mergers and acquisitions, geographical expansion, and product/service launches, to enhance their presence in the industry.
ABB Ltd. - Vendors provide integrated AI-powered IoT systems, from industrial automation and edge platforms to comprehensive cloud-based analytics, enhancing operational intelligence across diverse enterprise ecosystems.
The industry research and growth report includes detailed analyses of the competitive landscape of the market and information about key companies, including:
- ABB Ltd.
- Amazon.com Inc.
- Broadcom Inc.
- Cisco Systems Inc.
- Emerson Electric Co.
- General Electric Co.
- Google LLC
- Hewlett Packard Enterprise Co.
- Honeywell International Inc.
- IBM Corp.
- Intel Corp.
- Microsoft Corp.
- NVIDIA Corp.
- NXP Semiconductors NV
- Oracle Corp.
- PTC Inc.
- Robert Bosch GmbH
- SAP SE
- Schneider Electric SE
- Siemens AG
Qualitative and quantitative analysis of companies has been conducted to help clients understand the wider business environment as well as the strengths and weaknesses of key industry players. Data is qualitatively analyzed to categorize companies as pure play, category-focused, industry-focused, and diversified; it is quantitatively analyzed to categorize companies as dominant, leading, strong, tentative, and weak.
Market Intelligence Radar: High-Impact Developments & Growth Signals
- In the Application Software industry, the widespread adoption of cloud-based SaaS delivery models has lowered entry barriers for AI-powered IoT systems, enabling scalable deployment and workflow interoperability without significant upfront infrastructure investment.
- The rising integration of robotic process automation (RPA) and business process management (BPM) software is creating demand for AI-powered IoT systems to feed real-time physical data into these automated digital workflows, supporting asset optimization.
- An enterprise-wide focus on data analytics and business intelligence tools has accelerated the need for AI-powered IoT systems, which serve as the primary source for high-velocity data required for advanced predictive modeling and achieving proactive responses.
- Heightened data security and privacy regulations are influencing the architecture of AI-powered IoT systems, promoting the adoption of edge computing to process sensitive data locally, thereby reducing risks associated with cloud transmission and supporting data sovereignty.
Dive into Technavio’s robust research methodology, blending expert interviews, extensive data synthesis, and validated models for unparalleled Ai-powered Iot Systems Market insights. See full methodology.
| Market Scope | |
|---|---|
| Page number | 332 |
| Base year | 2025 |
| Historic period | 2020-2024 |
| Forecast period | 2026-2030 |
| Growth momentum & CAGR | Accelerate at a CAGR of 30.8% |
| Market growth 2026-2030 | USD 75449.4 million |
| Market structure | Fragmented |
| YoY growth 2025-2026(%) | 17.8% |
| Key countries | US, Canada, Mexico, Germany, UK, France, Italy, Spain, The Netherlands, China, Japan, South Korea, India, Indonesia, Australia, Brazil, Argentina, Colombia, South Africa, Saudi Arabia, UAE, Israel and Turkey |
| Competitive landscape | Leading Companies, Market Positioning of Companies, Competitive Strategies, and Industry Risks |
Research Analyst Overview
- The market ecosystem for AI-powered IoT systems, where software constitutes over 30% of the total system value, involves a complex interplay of stakeholders. Technology suppliers provide foundational components like AI accelerators and neural processing units, which improve model processing speed by over 50%, while solution providers such as industrial automation leaders and hyperscale cloud firms integrate these into end-to-end platforms.
- These platforms facilitate real-time data processing and support the development of autonomous systems. Distribution channels include direct sales to large enterprises and partnerships with system integrators that customize solutions for specific industries like manufacturing and healthcare.
- End-users are increasingly demanding systems that ensure data privacy and adhere to evolving ethical AI governance standards, influencing the design of both hardware and software. Regulatory bodies and industry consortiums also shape the market by promoting interoperability and new data standards.
What are the Key Data Covered in this Ai-powered Iot Systems Market Research and Growth Report?
-
What is the expected growth of the Ai-powered Iot Systems Market between 2026 and 2030?
-
The Ai-powered Iot Systems Market is expected to grow by USD 75.45 billion during 2026-2030, registering a CAGR of 30.8%. Year-over-year growth in 2026 is estimated at 17.8%%. This acceleration is shaped by proliferation of high-velocity data and intelligent automation, which is intensifying demand across multiple end-use verticals covered in the report.
-
-
What segmentation does the market report cover?
-
The report is segmented by Component (Hardware, and Software), Deployment (On-premises, and Cloud), Technology (Machine learning, Deep learning, Natural language processing, and Others), End-user (Manufacturing, Healthcare, IT and telecom, Energy and utility, and Others) and Geography (North America, Europe, APAC, South America, Middle East and Africa). Among these, the Hardware segment is estimated to witness significant growth during the forecast period, driven by rising adoption across key application areas. Each segment includes detailed qualitative and quantitative analysis, along with historical data from 2020-2024 and forecasts through 2030 with year-over-year growth rates.
-
-
Which regions are analyzed in the report?
-
The report covers North America, Europe, APAC, South America and Middle East and Africa. North America is estimated to contribute 34.8% to market growth during the forecast period. Country-level analysis includes US, Canada, Mexico, Germany, UK, France, Italy, Spain, The Netherlands, China, Japan, South Korea, India, Indonesia, Australia, Brazil, Argentina, Colombia, South Africa, Saudi Arabia, UAE, Israel and Turkey, with dedicated market size tables and year-over-year growth for each.
-
-
What are the key growth drivers and market challenges?
-
The primary driver is proliferation of high-velocity data and intelligent automation, which is accelerating investment and industry demand. The main challenge is vulnerability of heterogeneous iot nodes and cybersecurity gaps, creating operational barriers for key market participants. The report quantifies the impact of each driver and challenge across 2026 and 2030 with comparative analysis.
-
-
Who are the major players in the Ai-powered Iot Systems Market?
-
Key vendors include ABB Ltd., Amazon.com Inc., Broadcom Inc., Cisco Systems Inc., Emerson Electric Co., General Electric Co., Google LLC, Hewlett Packard Enterprise Co., Honeywell International Inc., IBM Corp., Intel Corp., Microsoft Corp., NVIDIA Corp., NXP Semiconductors NV, Oracle Corp., PTC Inc., Robert Bosch GmbH, SAP SE, Schneider Electric SE and Siemens AG. The report provides qualitative and quantitative analysis categorizing companies as dominant, leading, strong, tentative, and weak based on their market positioning. Company profiles include business segment analysis, SWOT assessment, key offerings, and recent strategic developments.
-
Market Research Insights
- The competitive landscape, where the top five vendors account for over 45% of market share, is shaped by strategic alliances between industrial automation giants and hyperscale cloud providers. Key players such as Siemens AG and NVIDIA Corp. are expanding partnerships to build comprehensive industrial AI operating systems.
- These collaborations aim to integrate photorealistic digital twins and generative physics models, which can reduce operational costs by up to 20% by optimizing production lines in real time. This innovation push directly addresses enterprise demand for hyper-automation and more resilient infrastructure. However, companies must navigate the persistent challenge of interoperability constraints, which can slow the deployment of multi-vendor solutions.
- Adaptation strategies focus on creating more open ecosystems and supporting emerging data standards to foster seamless workflow interoperability across diverse hardware and software platforms.
We can help! Our analysts can customize this ai-powered iot systems market research report to meet your requirements.
 RIA -
RIA - 
