Silicones Market Analysis, Size, and Forecast 2024-2028: North America (US and Canada), Europe (France, Germany, Italy, and UK), Middle East and Africa (Egypt, KSA, Oman, and UAE), APAC (China, India, and Japan), South America (Argentina and Brazil), and Rest of World (ROW)

Silicones Market Analysis, Size, and Forecast 2024-2028:
North America (US and Canada), Europe (France, Germany, Italy, and UK), Middle East and Africa (Egypt, KSA, Oman, and UAE), APAC (China, India, and Japan), South America (Argentina and Brazil), and Rest of World (ROW)

Published: Jan 2024 183 Pages SKU: IRTNTR40523

Market Overview at a Glance

$8.76 B
Market Opportunity
7.32%
CAGR
6.74
YoY growth 2023-2024(%)

Silicones Market Size 2024-2028

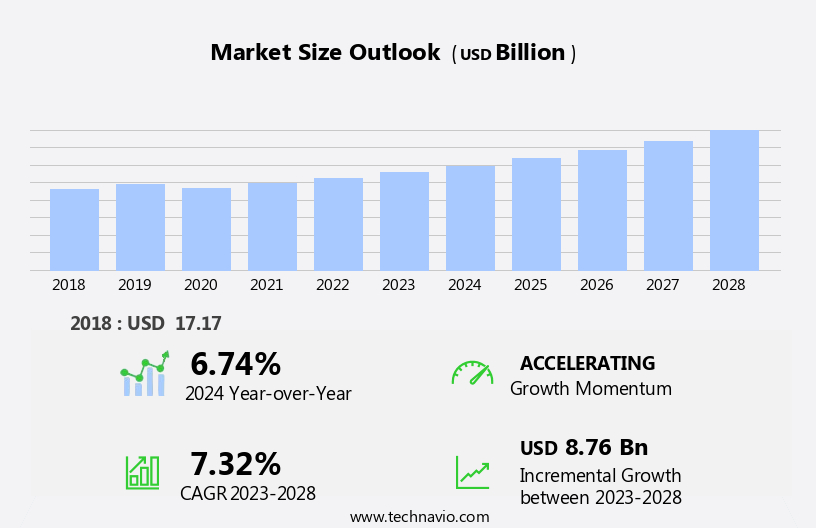
The silicones market size is forecast to increase by USD 8.76 billion, at a CAGR of 7.32% between 2023 and 2028.

  • The market is experiencing significant growth, driven by the expanding construction industry and increasing adoption in the electrical and electronics sectors. The construction industry's upward trend is fueling the demand for silicones due to their excellent thermal and electrical insulation properties, making them an essential component in various building applications. Additionally, the electronics industry's growing reliance on silicones for insulation, sealing, and encapsulation applications is further fueling market growth. However, the market faces challenges due to the fluctuating prices of raw materials, primarily silica and methanol, which can impact the profitability of silicones manufacturers.
  • These volatile prices can impact the cost structure of silicone manufacturers, potentially leading to price fluctuations in the market and affecting their profitability. Companies operating in this market must closely monitor raw material prices and adapt their strategies accordingly to maintain competitiveness and mitigate risks.

What will be the Size of the Silicones Market during the forecast period?

Silicones Market Size

Explore in-depth regional segment analysis with market size data - historical 2018-2022 and forecasts 2024-2028 - in the full report.  
Request Free Sample

The market showcases a dynamic and evolving landscape, with ongoing advancements and innovations shaping its various sectors. Silicone fillers play a crucial role in enhancing the properties of silicone resins, while medical applications continue to expand, driven by the biocompatibility and biodegradability of these materials. Silicone extrusion processes enable the production of diverse shapes and sizes, from tubing to profiles, while sealants ensure airtight and watertight bonds. Surface treatment and coatings enhance silicone's durability and resistance to environmental factors, such as heat, weather, and chemicals. Dielectric properties make silicones indispensable in the electronics industry, while anti-fouling and release agents cater to the maritime sector.

Silicone fluids serve as essential lubricants and coolants, and their chemical resistance is a key factor in numerous industrial applications. Adhesives, gels, rubbers, and elastomers expand the versatility of silicones, catering to diverse industries, including automotive, construction, and aerospace. The continuous pursuit of sustainability drives research into biodegradable silicones and eco-friendly production methods. Silicones' adaptability and performance make them a valuable asset in numerous industries, with ongoing advancements ensuring their relevance and growth in the market.

How is this Silicones Industry segmented?

The silicones industry research report provides comprehensive data (region-wise segment analysis), with forecasts and estimates in "USD billion" for the period 2024-2028, as well as historical data from 2018-2022 for the following segments.

  • Product
    • Elastomers
    • Fluids
    • Resins
    • Gels and others
  • End-user
    • Industrial process
    • Construction
    • Personal care and consumer products
    • Transportation
    • Others
  • Application
    • Industrial Process
    • Construction
    • Automotive
    • Electronics
    • Personal Care & Consumer Products
    • Healthcare
    • Energy
  • Geography
    • North America
      • US
      • Canada
    • Europe
      • France
      • Germany
      • Italy
      • UK
    • Middle East and Africa
      • Egypt
      • KSA
      • Oman
      • UAE
    • APAC
      • China
      • India
      • Japan
    • South America
      • Argentina
      • Brazil
    • Rest of World (ROW)

By Product Insights

The elastomers segment is estimated to witness significant growth during the forecast period.

Silicone elastomers, a type of high-performance polymer, are manufactured by combining straight-chained, reactive, and linear polymer molecules with crosslinkers, reinforcements, and catalysts. This process results in elastomers with superior absorption, elasticity, and tear strength. Silicone elastomers come in various forms, including room-temperature vulcanized liquid silicone rubber and high-temperature vulcanized or heat-cured rubber. The selection of elastomer type depends on the characteristics of the straight-chain molecules and processing temperature. Silicone elastomers exhibit desirable properties, such as weatherability, thermal conductivity, heat and cold resistance, flame retardancy, electrical conductivity, gas permeability, vibration absorption, radiation resistance, tensile and tear strength, and ozone and UV resistance.

These properties make silicone elastomers suitable for diverse applications, including automotive, construction, electronics, healthcare, and aerospace industries. Crosslinking and vulcanization processes enhance the mechanical properties of silicone elastomers. Crosslinking creates a three-dimensional network within the elastomer, while vulcanization cures the elastomer to improve its durability and resistance to environmental stresses. Additives, such as fillers, pigments, and plasticizers, can be incorporated into silicone elastomers to modify their properties. For instance, silicone fillers enhance the elastomer's mechanical strength, while plasticizers improve its flexibility. Silicone elastomers can be processed using various techniques, including injection molding, calendaring, extrusion, casting, and transfer molding.

These processing methods enable the production of complex shapes and components with consistent dimensions and high precision. Silicone elastomers' biocompatibility, hydrophilicity, and water repellency make them suitable for medical applications. Their biodegradability and sustainability attributes are gaining increasing attention in the industry, driving the development of eco-friendly silicone elastomers. Silicone elastomers' dielectric properties, anti-fouling properties, and release agents make them valuable in the electronics industry. Their excellent chemical resistance and adhesion properties make them suitable for various industrial applications. In summary, silicone elastomers' versatile properties and wide range of applications make them an essential component in various industries.

Their production involves the use of additives, fillers, and various processing techniques, ensuring their high performance and durability. The ongoing research and development efforts in the field of silicone elastomers aim to enhance their properties and expand their applications.

Silicones Market Size

Request Free Sample

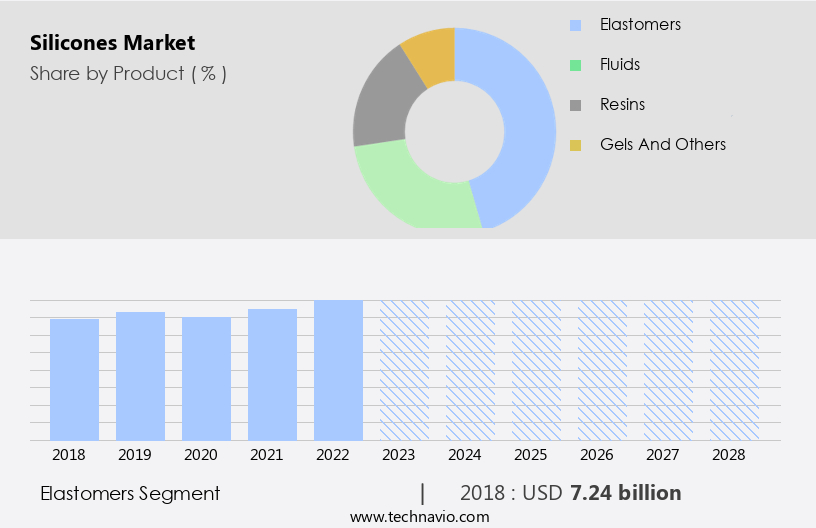
The Elastomers segment was valued at USD 7.24 billion in 2018 and showed a gradual increase during the forecast period.

Regional Analysis

APAC is estimated to contribute 41% to the growth of the global market during the forecast period.Technavio's analysts have elaborately explained the regional trends and drivers that shape the market during the forecast period.

Silicones Market Share by Geography

 Request Free Sample

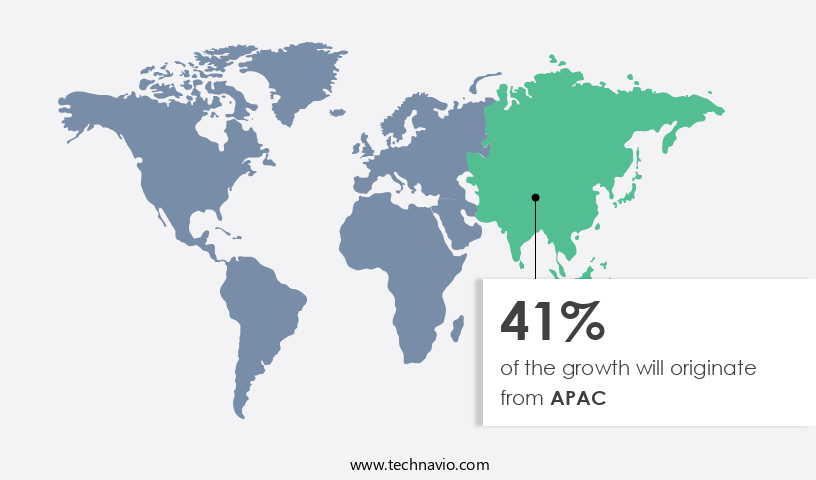
The market is experiencing significant growth due to the increasing demand from various industries such as industrial processing, construction, automobile, and personal care. The market's expansion is driven by the unique properties of silicones, including hydrophobicity, heat resistance, biocompatibility, and chemical resistance. In the manufacturing sector, particularly in Asia Pacific (APAC), the growing number of companies is fueling the demand for silicone-based industrial lubricants, coatings, and sealants. China, Japan, India, Australia, South Korea, and Indonesia are the major contributors to the APAC market's growth. During the forecast period, APAC is anticipated to register the fastest growth rate due to the increasing demand in rapidly developing economies.

Silicone resins, gels, rubbers, and polymers are used extensively in various applications such as silicone injection molding, crosslinking, calendaring, extrusion, casting, and transfer molding. Additionally, the market is witnessing an increasing focus on sustainability and biodegradability, leading to the development of eco-friendly silicone products. Silicone surface treatment, coatings, and sealants are used to enhance the dielectric properties, anti-fouling properties, anti-static properties, and water repellency of various materials. Silicone adhesives and adhesion promoters are essential in various industries, including medical applications, where biocompatibility is crucial. Overall, the market's growth is driven by its versatile applications, unique properties, and increasing demand from various industries.

Market Dynamics

Our researchers analyzed the data with 2023 as the base year, along with the key drivers, trends, and challenges. A holistic analysis of drivers will help companies refine their marketing strategies to gain a competitive advantage.

The market encompasses the production, distribution, and application of silicone-based materials, which offer exceptional properties such as durability, heat resistance, and water repellency. These versatile polymers are utilized extensively in various industries, including automotive, construction, electronics, healthcare, and cosmetics. Silicone rubber, sealants, adhesives, coatings, and elastomers are key product categories. Applications range from automotive parts, such as gaskets and hoses, to building insulation, solar panel encapsulants, and semiconductor manufacturing. Silicone's unique properties make it an indispensable component in numerous industries, ensuring its continued growth and demand in the global market.

What are the key market drivers leading to the rise in the adoption of Silicones Industry?

  • The construction industry's expansion is the primary catalyst fueling market growth. 
  • The global construction industry is experiencing notable expansion due to the escalating demand for office spaces, commercial complexes, and residential buildings. This growth trend is propelled by urbanization and substantial investments in infrastructure development, particularly in emerging economies. The increasing global population necessitates the construction of new residences and associated infrastructure, thereby fueling the demand for various construction materials, including silicones. In the realm of construction, silicones play a pivotal role due to their versatility and effectiveness in various applications. Silicone sealants are essential in creating dependable, pliable, and waterproof joints for a multitude of projects, ranging from small-scale domestic renovations to large-scale projects like skyscrapers and bridges.
  • Silicone's unique properties, such as biocompatibility, hydrophilicity, and water repellency, make it a preferred choice for numerous applications within the construction sector. The process of silicone production involves techniques like injection molding, crosslinking, calendaring, and reinforcement, which contribute to its durability and sustainability. Silicone additives further enhance its properties, ensuring optimal performance in diverse conditions. As the construction industry continues to evolve, the demand for silicone-based products is poised to increase, driven by the industry's growth and the inherent advantages of silicones.

What are the market trends shaping the Silicones Industry?

  • The electrical and electronics industry is experiencing a significant trend toward increased adoption of advanced technologies. This upward trend is a mandatory development, reflecting the industry's commitment to innovation and progress.
  • Silicones are a versatile class of materials widely used in the electrical and electronics industry due to their unique properties. Silicone gels, in particular, offer excellent protection to adjoining components by absorbing thermomechanical stress. This makes them an ideal choice for various applications, including printed circuit boards, semiconductors, electronic control units, LED devices, and automotive electronic controllers. The durability and flexibility of silicone gels enable them to encapsulate cable accessories in power transmission and distribution systems, ensuring superior electrical properties and heat stability. Silicone elastomers are another essential category of silicones, extensively used in the electrical and electronics industry.
  • They are particularly popular in automotive and general electronic components due to their excellent mechanical strength, electrical insulation properties, and resistance to extreme temperatures. The growing demand for advanced electronics in various industries, including automotive, aerospace, and telecommunications, is expected to fuel the growth of the market. In summary, the electrical and electronics industry relies heavily on silicones for their superior insulation, mechanical strength, and temperature resistance properties. Silicone gels and elastomers are widely used in various applications, from encapsulating electronic components to insulating cables in power transmission systems. The increasing demand for advanced electronics across various industries is expected to drive the growth of the market.

What challenges does the Silicones Industry face during its growth?

  • The unpredictable fluctuations in the prices of raw materials pose a significant challenge to the growth of the industry. 
  • Silicones, derived from silicon metal and methanol, are valued for their exceptional chemical resistance, adhesion, and anti-slip properties. The silicone market's growth is driven by the diverse range of applications for these properties in various industries, including automotive, construction, healthcare, and electronics. Silicone polymers, such as silicone gels, rubbers, and monomers, are produced through silicone casting and curing processes. However, the market faces challenges due to the increasing cost of raw materials. The limited availability of silicon metal has led to a rise in its price, which in turn affects the cost of silicone-based products.
  • Additionally, the energy-intensive production process of silicone fluids contributes to the escalating production costs. As a result, silicone companies are forced to increase their product prices, potentially hindering market growth. Despite these challenges, the demand for silicones remains strong due to their unique properties and versatile applications.

Exclusive Customer Landscape

The silicones market forecasting report includes the adoption lifecycle of the market, covering from the innovator's stage to the laggard's stage. It focuses on adoption rates in different regions based on penetration. Furthermore, the silicones market report also includes key purchase criteria and drivers of price sensitivity to help companies evaluate and develop their market growth analysis strategies.

Silicones Market Share by Geography

 Customer Landscape

Key Companies & Market Insights

Companies are implementing various strategies, such as strategic alliances, silicones market forecast, partnerships, mergers and acquisitions, geographical expansion, and product/service launches, to enhance their presence in the industry.

Ashland Global Holdings Inc. - The company specializes in providing a variety of silicone materials, formulated through silicone elastomers and emulsions. These offerings are optimized for fully automated industrial applications, including Liquid Injection Molding Systems. The diverse base chemistries cater to the specific demands of automated manufacturing processes, ensuring efficiency and consistency.

The industry research and growth report includes detailed analyses of the competitive landscape of the market and information about key companies, including:

  • Ashland Global Holdings Inc.
  • Avantor Inc.
  • Basf SE
  • Dow Inc.
  • Elkem ASA
  • Evonik Industries AG
  • Gelest, Inc. (Mitsubishi Chemical Corporation)
  • KCC Corporation
  • Momentive Performance Materials Inc.
  • Shin-Etsu Chemical Co., Ltd.
  • Wacker Chemie AG
  • Ashland Inc.
  • Clariant AG
  • Merck KGaA
  • Mitsui Chemicals, Inc.
  • Nippon Shokubai Co., Ltd.
  • PMC Biogenix Inc.
  • Silicone Engineering Ltd.
  • Specialty Silicone Products, Inc.
  • The Chemours Company

Qualitative and quantitative analysis of companies has been conducted to help clients understand the wider business environment as well as the strengths and weaknesses of key industry players. Data is qualitatively analyzed to categorize companies as pure play, category-focused, industry-focused, and diversified; it is quantitatively analyzed to categorize companies as dominant, leading, strong, tentative, and weak.

Recent Development and News in Silicones Market

  • In January 2024, Wacker Chemicals AG, a leading silicones manufacturer, announced the expansion of its production capacity for silicone fluids at its site in Nanjing, China. This expansion aimed to meet the growing demand for silicones in the automotive and electronics industries (Wacker Chemicals AG, 2024).
  • In March 2024, Dow Inc. And Corning Incorporated entered into a strategic collaboration to develop and commercialize silicon-based materials for the high-growth markets of 5G infrastructure and renewable energy. This partnership combined Dow's silicones expertise with Corning's advanced materials science capabilities (Dow Inc., 2024).
  • In May 2024, Momentive Performance Materials Inc. Completed the acquisition of the silicones business of Elkem ASA. This acquisition expanded Momentive's global footprint, particularly in Europe, and strengthened its position as a leading silicones supplier (Momentive Performance Materials Inc., 2024).
  • In April 2025, BASF SE received approval from the European Commission for its acquisition of Solvay's European silicones business. This acquisition added significant capacity and capabilities to BASF's portfolio, making it one of the largest silicones producers globally (BASF SE, 2025).

Research Analyst Overview

  • The market encompasses a diverse range of applications, from industrial to consumer goods. Quality control is paramount in ensuring the consistency and reliability of silicone-coated fabrics and silicone-reinforced plastics used in various industries. Silicone pricing remains a critical factor, influenced by supply chain dynamics and technological advancements in manufacturing processes, such as those used in producing polydimethylsiloxane (PDMS) and polyvinyl siloxane (PVS). Innovation continues to drive the market, with silicone biotechnology and nanotechnology leading the charge. PDMS and PVS are increasingly used in biomedical applications, while silicone nanoparticles are finding use in microfluidics and sensors. Silicone-based composites are gaining traction in aerospace applications, and silicone actuators are transforming automotive components.
  • Safety regulations and testing standards are essential in ensuring the safety and efficacy of silicone-impregnated materials used in food packaging, cosmetics, and pharmaceuticals. The electronics sector is another significant market, with silicone playing a crucial role in semiconductor manufacturing and electronic components. Silicone sensors are also gaining popularity in various industries, from automotive to healthcare. The market is dynamic, with trends shifting towards sustainable manufacturing processes and the development of new applications. Silicone-coated fabrics are being used in building materials to improve insulation and durability, while PDMS and PVS are being explored for use in renewable energy applications.
  • The future of the market is bright, with endless possibilities for innovation and growth.

Dive into Technavio's robust research methodology, blending expert interviews, extensive data synthesis, and validated models for unparalleled Silicones Market insights. See full methodology.

Market Scope

Report Coverage

Details

Page number

183

Base year

2023

Historic period

2018-2022

Forecast period

2024-2028

Growth momentum & CAGR

Accelerate at a CAGR of 7.32%

Market growth 2024-2028

USD 8.76 billion

Market structure

Fragmented

YoY growth 2023-2024(%)

6.74

Key countries

US, Canada, Germany, UK, Italy, France, China, India, Japan, Brazil, Egypt, UAE, Oman, Argentina, KSA, UAE, Brazil, and Rest of World (ROW)

Competitive landscape

Leading Companies, Market Positioning of Companies, Competitive Strategies, and Industry Risks

Request Free Sample

What are the Key Data Covered in this Silicones Market Research and Growth Report?

  • CAGR of the Silicones industry during the forecast period
  • Detailed information on factors that will drive the growth and forecasting between 2024 and 2028
  • Precise estimation of the size of the market and its contribution of the industry in focus to the parent market
  • Accurate predictions about upcoming growth and trends and changes in consumer behaviour
  • Growth of the market across APAC, North America, Europe, Middle East and Africa, and South America
  • Thorough analysis of the market's competitive landscape and detailed information about companies
  • Comprehensive analysis of factors that will challenge the silicones market growth of industry companies

We can help! Our analysts can customize this silicones market research report to meet your requirements.

Get in touch

1 Executive Summary

  • 1.1 Market overview
    • Exhibit 01: Executive Summary – Chart on Market Overview
    • Exhibit 02: Executive Summary – Data Table on Market Overview
    • Exhibit 03: Executive Summary – Chart on Global Market Characteristics
    • Exhibit 04: Executive Summary – Chart on Market by Geography
    • Exhibit 05: Executive Summary – Chart on Market Segmentation by Product
    • Exhibit 06: Executive Summary – Chart on Market Segmentation by End-user
    • Exhibit 07: Executive Summary – Chart on Incremental Growth
    • Exhibit 08: Executive Summary – Data Table on Incremental Growth
    • Exhibit 09: Executive Summary – Chart on Vendor Market Positioning

2 Market Landscape

  • 2.1 Market ecosystem
    • Exhibit 10: Parent market
    • Exhibit 11: Market Characteristics

3 Market Sizing

  • 3.1 Market definition
    • Exhibit 12: Offerings of vendors included in the market definition
  • 3.2 Market segment analysis
    • Exhibit 13: Market segments
  • 3.3 Market size 2023
    • 3.4 Market outlook: Forecast for 2023-2028
      • Exhibit 14: Chart on Global - Market size and forecast 2023-2028 ($ million)
      • Exhibit 15: Data Table on Global - Market size and forecast 2023-2028 ($ million)
      • Exhibit 16: Chart on Global Market: Year-over-year growth 2023-2028 (%)
      • Exhibit 17: Data Table on Global Market: Year-over-year growth 2023-2028 (%)

    4 Historic Market Size

    • 4.1 Global silicones market 2018 - 2022
      • Exhibit 18: Historic Market Size – Data Table on global silicones market 2018 - 2022 ($ million)
    • 4.2 Product Segment Analysis 2018 - 2022
      • Exhibit 19: Historic Market Size – Product Segment 2018 - 2022 ($ million)
    • 4.3 End-user Segment Analysis 2018 - 2022
      • Exhibit 20: Historic Market Size – End-user Segment 2018 - 2022 ($ million)
    • 4.4 Geography Segment Analysis 2018 - 2022
      • Exhibit 21: Historic Market Size – Geography Segment 2018 - 2022 ($ million)
    • 4.5 Country Segment Analysis 2018 - 2022
      • Exhibit 22: Historic Market Size – Country Segment 2018 - 2022 ($ million)

    5 Five Forces Analysis

    • 5.1 Five forces summary
      • Exhibit 23: Five forces analysis - Comparison between 2023 and 2028
    • 5.2 Bargaining power of buyers
      • Exhibit 24: Chart on Bargaining power of buyers – Impact of key factors 2023 and 2028
    • 5.3 Bargaining power of suppliers
      • Exhibit 25: Bargaining power of suppliers – Impact of key factors in 2023 and 2028
    • 5.4 Threat of new entrants
      • Exhibit 26: Threat of new entrants – Impact of key factors in 2023 and 2028
    • 5.5 Threat of substitutes
      • Exhibit 27: Threat of substitutes – Impact of key factors in 2023 and 2028
    • 5.6 Threat of rivalry
      • Exhibit 28: Threat of rivalry – Impact of key factors in 2023 and 2028
    • 5.7 Market condition
      • Exhibit 29: Chart on Market condition - Five forces 2023 and 2028

    6 Market Segmentation by Product

    • 6.1 Market segments
      • Chart on Product - Market share (2023-2028) (%)
      • Data Table on Product - Market share (2023-2028) (%)
    • 6.2 Comparison by Product
      • Chart on Comparison by Product
      • Data Table on Comparison by Product
    • 6.3 Elastomers - Market size and forecast (2023-2028)
      • Chart on Elastomers - Market size and forecast (2023-2028) ($ million)
      • Data Table on Elastomers - Market size and forecast (2023-2028) ($ million)
      • Chart on Elastomers - Year-over-year growth (2023-2028) (%)
      • Data Table on Elastomers - Year-over-year growth (2023-2028) (%)
    • 6.4 Fluids - Market size and forecast (2023-2028)
      • Chart on Fluids - Market size and forecast (2023-2028) ($ million)
      • Data Table on Fluids - Market size and forecast (2023-2028) ($ million)
      • Chart on Fluids - Year-over-year growth (2023-2028) (%)
      • Data Table on Fluids - Year-over-year growth (2023-2028) (%)
    • 6.5 Resins - Market size and forecast (2023-2028)
      • Chart on Resins - Market size and forecast (2023-2028) ($ million)
      • Data Table on Resins - Market size and forecast (2023-2028) ($ million)
      • Chart on Resins - Year-over-year growth (2023-2028) (%)
      • Data Table on Resins - Year-over-year growth (2023-2028) (%)
    • 6.6 Gels and others - Market size and forecast (2023-2028)
      • Chart on Gels and others - Market size and forecast (2023-2028) ($ million)
      • Data Table on Gels and others - Market size and forecast (2023-2028) ($ million)
      • Chart on Gels and others - Year-over-year growth (2023-2028) (%)
      • Data Table on Gels and others - Year-over-year growth (2023-2028) (%)
    • 6.7 Market opportunity by Product
      • Market opportunity by Product ($ million)
      • Data Table on Market opportunity by Product ($ million)

    7 Market Segmentation by End-user

    • 7.1 Market segments
      • Chart on End-user - Market share (2023-2028) (%)
      • Data Table on End-user - Market share (2023-2028) (%)
    • 7.2 Comparison by End-user
      • Chart on Comparison by End-user
      • Data Table on Comparison by End-user
    • 7.3 Industrial process - Market size and forecast (2023-2028)
      • Chart on Industrial process - Market size and forecast (2023-2028) ($ million)
      • Data Table on Industrial process - Market size and forecast (2023-2028) ($ million)
      • Chart on Industrial process - Year-over-year growth (2023-2028) (%)
      • Data Table on Industrial process - Year-over-year growth (2023-2028) (%)
    • 7.4 Construction - Market size and forecast (2023-2028)
      • Chart on Construction - Market size and forecast (2023-2028) ($ million)
      • Data Table on Construction - Market size and forecast (2023-2028) ($ million)
      • Chart on Construction - Year-over-year growth (2023-2028) (%)
      • Data Table on Construction - Year-over-year growth (2023-2028) (%)
    • 7.5 Personal care and consumer products - Market size and forecast (2023-2028)
      • Chart on Personal care and consumer products - Market size and forecast (2023-2028) ($ million)
      • Data Table on Personal care and consumer products - Market size and forecast (2023-2028) ($ million)
      • Chart on Personal care and consumer products - Year-over-year growth (2023-2028) (%)
      • Data Table on Personal care and consumer products - Year-over-year growth (2023-2028) (%)
    • 7.6 Transportation - Market size and forecast (2023-2028)
      • Chart on Transportation - Market size and forecast (2023-2028) ($ million)
      • Data Table on Transportation - Market size and forecast (2023-2028) ($ million)
      • Chart on Transportation - Year-over-year growth (2023-2028) (%)
      • Data Table on Transportation - Year-over-year growth (2023-2028) (%)
    • 7.7 Others - Market size and forecast (2023-2028)
      • Chart on Others - Market size and forecast (2023-2028) ($ million)
      • Data Table on Others - Market size and forecast (2023-2028) ($ million)
      • Chart on Others - Year-over-year growth (2023-2028) (%)
      • Data Table on Others - Year-over-year growth (2023-2028) (%)
    • 7.8 Market opportunity by End-user
      • Market opportunity by End-user ($ million)
      • Data Table on Market opportunity by End-user ($ million)

    8 Market Segmentation by Application

    • 8.1 Market segments
      • Chart on Application - Market share (2023-2028) (%)
      • Data Table on Application - Market share (2023-2028) (%)
      • Market opportunity by Application ($ million)
      • Data Table on Market opportunity by Application ($ million)
    • 8.2 Comparison by Application
      • Chart on Comparison by Application
      • Data Table on Comparison by Application
    • 8.3 Industrial Process - Market size and forecast (2023-2028)
      • Chart on Industrial Process - Market size and forecast (2023-2028) ($ million)
      • Data Table on Industrial Process - Market size and forecast (2023-2028) ($ million)
      • Chart on Industrial Process - Year-over-year growth (2023-2028) (%)
      • Data Table on Industrial Process - Year-over-year growth (2023-2028) (%)
    • 8.4 Construction - Market size and forecast (2023-2028)
      • Chart on Construction - Market size and forecast (2023-2028) ($ million)
      • Data Table on Construction - Market size and forecast (2023-2028) ($ million)
      • Chart on Construction - Year-over-year growth (2023-2028) (%)
      • Data Table on Construction - Year-over-year growth (2023-2028) (%)
    • 8.5 Automotive - Market size and forecast (2023-2028)
      • Chart on Automotive - Market size and forecast (2023-2028) ($ million)
      • Data Table on Automotive - Market size and forecast (2023-2028) ($ million)
      • Chart on Automotive - Year-over-year growth (2023-2028) (%)
      • Data Table on Automotive - Year-over-year growth (2023-2028) (%)
    • 8.6 Electronics - Market size and forecast (2023-2028)
      • Chart on Electronics - Market size and forecast (2023-2028) ($ million)
      • Data Table on Electronics - Market size and forecast (2023-2028) ($ million)
      • Chart on Electronics - Year-over-year growth (2023-2028) (%)
      • Data Table on Electronics - Year-over-year growth (2023-2028) (%)
    • 8.7 Personal Care & Consumer Products - Market size and forecast (2023-2028)
      • Chart on Personal Care & Consumer Products - Market size and forecast (2023-2028) ($ million)
      • Data Table on Personal Care & Consumer Products - Market size and forecast (2023-2028) ($ million)
      • Chart on Personal Care & Consumer Products - Year-over-year growth (2023-2028) (%)
      • Data Table on Personal Care & Consumer Products - Year-over-year growth (2023-2028) (%)
    • 8.8 Healthcare - Market size and forecast (2023-2028)
      • Chart on Healthcare - Market size and forecast (2023-2028) ($ million)
      • Data Table on Healthcare - Market size and forecast (2023-2028) ($ million)
      • Chart on Healthcare - Year-over-year growth (2023-2028) (%)
      • Data Table on Healthcare - Year-over-year growth (2023-2028) (%)
    • 8.9 Energy - Market size and forecast (2023-2028)
      • Chart on Energy - Market size and forecast (2023-2028) ($ million)
      • Data Table on Energy - Market size and forecast (2023-2028) ($ million)
      • Chart on Energy - Year-over-year growth (2023-2028) (%)
      • Data Table on Energy - Year-over-year growth (2023-2028) (%)

    8 Customer Landscape

    • 8.1 Customer landscape overview
      • Exhibit 78: Analysis of price sensitivity, lifecycle, customer purchase basket, adoption rates, and purchase criteria

    9 Geographic Landscape

    • 9.1 Geographic segmentation
      • Exhibit 79: Chart on Market share by geography 2023-2028 (%)
      • Exhibit 80: Data Table on Market share by geography 2023-2028 (%)
    • 9.2 Geographic comparison
      • Exhibit 81: Chart on Geographic comparison
      • Exhibit 82: Data Table on Geographic comparison
    • 9.3 APAC - Market size and forecast 2023-2028
      • Exhibit 83: Chart on APAC - Market size and forecast 2023-2028 ($ million)
      • Exhibit 84: Data Table on APAC - Market size and forecast 2023-2028 ($ million)
      • Exhibit 85: Chart on APAC - Year-over-year growth 2023-2028 (%)
      • Exhibit 86: Data Table on APAC - Year-over-year growth 2023-2028 (%)
    • 9.4 North America - Market size and forecast 2023-2028
      • Exhibit 87: Chart on North America - Market size and forecast 2023-2028 ($ million)
      • Exhibit 88: Data Table on North America - Market size and forecast 2023-2028 ($ million)
      • Exhibit 89: Chart on North America - Year-over-year growth 2023-2028 (%)
      • Exhibit 90: Data Table on North America - Year-over-year growth 2023-2028 (%)
    • 9.5 Europe - Market size and forecast 2023-2028
      • Exhibit 91: Chart on Europe - Market size and forecast 2023-2028 ($ million)
      • Exhibit 92: Data Table on Europe - Market size and forecast 2023-2028 ($ million)
      • Exhibit 93: Chart on Europe - Year-over-year growth 2023-2028 (%)
      • Exhibit 94: Data Table on Europe - Year-over-year growth 2023-2028 (%)
    • 9.6 Middle East and Africa - Market size and forecast 2023-2028
      • Exhibit 95: Chart on Middle East and Africa - Market size and forecast 2023-2028 ($ million)
      • Exhibit 96: Data Table on Middle East and Africa - Market size and forecast 2023-2028 ($ million)
      • Exhibit 97: Chart on Middle East and Africa - Year-over-year growth 2023-2028 (%)
      • Exhibit 98: Data Table on Middle East and Africa - Year-over-year growth 2023-2028 (%)
    • 9.7 South America - Market size and forecast 2023-2028
      • Exhibit 99: Chart on South America - Market size and forecast 2023-2028 ($ million)
      • Exhibit 100: Data Table on South America - Market size and forecast 2023-2028 ($ million)
      • Exhibit 101: Chart on South America - Year-over-year growth 2023-2028 (%)
      • Exhibit 102: Data Table on South America - Year-over-year growth 2023-2028 (%)
    • 9.8 China - Market size and forecast 2023-2028
      • Exhibit 103: Chart on China - Market size and forecast 2023-2028 ($ million)
      • Exhibit 104: Data Table on China - Market size and forecast 2023-2028 ($ million)
      • Exhibit 105: Chart on China - Year-over-year growth 2023-2028 (%)
      • Exhibit 106: Data Table on China - Year-over-year growth 2023-2028 (%)
    • 9.9 US - Market size and forecast 2023-2028
      • Exhibit 107: Chart on US - Market size and forecast 2023-2028 ($ million)
      • Exhibit 108: Data Table on US - Market size and forecast 2023-2028 ($ million)
      • Exhibit 109: Chart on US - Year-over-year growth 2023-2028 (%)
      • Exhibit 110: Data Table on US - Year-over-year growth 2023-2028 (%)
    • 9.10 Japan - Market size and forecast 2023-2028
      • Exhibit 111: Chart on Japan - Market size and forecast 2023-2028 ($ million)
      • Exhibit 112: Data Table on Japan - Market size and forecast 2023-2028 ($ million)
      • Exhibit 113: Chart on Japan - Year-over-year growth 2023-2028 (%)
      • Exhibit 114: Data Table on Japan - Year-over-year growth 2023-2028 (%)
    • 9.11 Germany - Market size and forecast 2023-2028
      • Exhibit 115: Chart on Germany - Market size and forecast 2023-2028 ($ million)
      • Exhibit 116: Data Table on Germany - Market size and forecast 2023-2028 ($ million)
      • Exhibit 117: Chart on Germany - Year-over-year growth 2023-2028 (%)
      • Exhibit 118: Data Table on Germany - Year-over-year growth 2023-2028 (%)
    • 9.12 India - Market size and forecast 2023-2028
      • Exhibit 119: Chart on India - Market size and forecast 2023-2028 ($ million)
      • Exhibit 120: Data Table on India - Market size and forecast 2023-2028 ($ million)
      • Exhibit 121: Chart on India - Year-over-year growth 2023-2028 (%)
      • Exhibit 122: Data Table on India - Year-over-year growth 2023-2028 (%)
    • 9.13 Market opportunity by geography
      • Exhibit 123: Market opportunity by geography ($ million)
      • Exhibit 124: Data Tables on Market opportunity by geography ($ million)
    • 10.14 Canada - Market size and forecast (2023-2028)
      • Chart on Canada - Market size and forecast (2023-2028) ($ million)
      • Data Table on Canada - Market size and forecast (2023-2028) ($ million)
      • Chart on Canada - Year-over-year growth (2023-2028) (%)
      • Data Table on Canada - Year-over-year growth (2023-2028) (%)
    • 10.15 UK - Market size and forecast (2023-2028)
      • Chart on UK - Market size and forecast (2023-2028) ($ million)
      • Data Table on UK - Market size and forecast (2023-2028) ($ million)
      • Chart on UK - Year-over-year growth (2023-2028) (%)
      • Data Table on UK - Year-over-year growth (2023-2028) (%)
    • 10.16 Italy - Market size and forecast (2023-2028)
      • Chart on Italy - Market size and forecast (2023-2028) ($ million)
      • Data Table on Italy - Market size and forecast (2023-2028) ($ million)
      • Chart on Italy - Year-over-year growth (2023-2028) (%)
      • Data Table on Italy - Year-over-year growth (2023-2028) (%)
    • 10.17 France - Market size and forecast (2023-2028)
      • Chart on France - Market size and forecast (2023-2028) ($ million)
      • Data Table on France - Market size and forecast (2023-2028) ($ million)
      • Chart on France - Year-over-year growth (2023-2028) (%)
      • Data Table on France - Year-over-year growth (2023-2028) (%)
    • 10.18 Brazil - Market size and forecast (2023-2028)
      • Chart on Brazil - Market size and forecast (2023-2028) ($ million)
      • Data Table on Brazil - Market size and forecast (2023-2028) ($ million)
      • Chart on Brazil - Year-over-year growth (2023-2028) (%)
      • Data Table on Brazil - Year-over-year growth (2023-2028) (%)
    • 10.19 Egypt - Market size and forecast (2023-2028)
      • Chart on Egypt - Market size and forecast (2023-2028) ($ million)
      • Data Table on Egypt - Market size and forecast (2023-2028) ($ million)
      • Chart on Egypt - Year-over-year growth (2023-2028) (%)
      • Data Table on Egypt - Year-over-year growth (2023-2028) (%)
    • 10.20 UAE - Market size and forecast (2023-2028)
      • Chart on UAE - Market size and forecast (2023-2028) ($ million)
      • Data Table on UAE - Market size and forecast (2023-2028) ($ million)
      • Chart on UAE - Year-over-year growth (2023-2028) (%)
      • Data Table on UAE - Year-over-year growth (2023-2028) (%)
    • 10.21 Oman - Market size and forecast (2023-2028)
      • Chart on Oman - Market size and forecast (2023-2028) ($ million)
      • Data Table on Oman - Market size and forecast (2023-2028) ($ million)
      • Chart on Oman - Year-over-year growth (2023-2028) (%)
      • Data Table on Oman - Year-over-year growth (2023-2028) (%)
    • 10.22 Argentina - Market size and forecast (2023-2028)
      • Chart on Argentina - Market size and forecast (2023-2028) ($ million)
      • Data Table on Argentina - Market size and forecast (2023-2028) ($ million)
      • Chart on Argentina - Year-over-year growth (2023-2028) (%)
      • Data Table on Argentina - Year-over-year growth (2023-2028) (%)
    • 10.23 KSA - Market size and forecast (2023-2028)
      • Chart on KSA - Market size and forecast (2023-2028) ($ million)
      • Data Table on KSA - Market size and forecast (2023-2028) ($ million)
      • Chart on KSA - Year-over-year growth (2023-2028) (%)
      • Data Table on KSA - Year-over-year growth (2023-2028) (%)
    • 10.24 Rest of World (ROW) - Market size and forecast (2023-2028)
      • Chart on Rest of World (ROW) - Market size and forecast (2023-2028) ($ million)
      • Data Table on Rest of World (ROW) - Market size and forecast (2023-2028) ($ million)
      • Chart on Rest of World (ROW) - Year-over-year growth (2023-2028) (%)
      • Data Table on Rest of World (ROW) - Year-over-year growth (2023-2028) (%)

    10 Drivers, Challenges, and Trends

    • 10.1 Market drivers
      • 10.2 Market challenges
        • 10.3 Impact of drivers and challenges
          • Exhibit 125: Impact of drivers and challenges in 2023 and 2028
        • 10.4 Market trends

          11 Vendor Landscape

          • 11.1 Overview
            • 11.2 Vendor landscape
              • Exhibit 126: Overview on Criticality of inputs and Factors of differentiation
            • 11.3 Landscape disruption
              • Exhibit 127: Overview on factors of disruption
            • 11.4 Industry risks
              • Exhibit 128: Impact of key risks on business

            13 Competitive Analysis

            • 13.1 Companies profiled
              • Companies covered
            • 13.2 Market positioning of companies
              • Matrix on companies position and classification
            • 13.3 Ashland Global Holdings Inc.
              • Ashland Global Holdings Inc. - Overview
              • Ashland Global Holdings Inc. - Product / Service
              • Ashland Global Holdings Inc. - Key offerings
            • 13.4 Avantor Inc.
              • Avantor Inc. - Overview
              • Avantor Inc. - Product / Service
              • Avantor Inc. - Key offerings
            • 13.5 Basf SE
              • Basf SE - Overview
              • Basf SE - Product / Service
              • Basf SE - Key offerings
            • 13.6 Dow Inc.
              • Dow Inc. - Overview
              • Dow Inc. - Product / Service
              • Dow Inc. - Key offerings
            • 13.7 Elkem ASA
              • Elkem ASA - Overview
              • Elkem ASA - Product / Service
              • Elkem ASA - Key offerings
            • 13.8 Evonik Industries AG
              • Evonik Industries AG - Overview
              • Evonik Industries AG - Product / Service
              • Evonik Industries AG - Key offerings
            • 13.9 Gelest, Inc. (Mitsubishi Chemical Corporation)
              • Gelest, Inc. (Mitsubishi Chemical Corporation) - Overview
              • Gelest, Inc. (Mitsubishi Chemical Corporation) - Product / Service
              • Gelest, Inc. (Mitsubishi Chemical Corporation) - Key offerings
            • 13.10 KCC Corporation
              • KCC Corporation - Overview
              • KCC Corporation - Product / Service
              • KCC Corporation - Key offerings
            • 13.11 Momentive Performance Materials Inc.
              • Momentive Performance Materials Inc. - Overview
              • Momentive Performance Materials Inc. - Product / Service
              • Momentive Performance Materials Inc. - Key offerings
            • 13.12 Shin-Etsu Chemical Co., Ltd.
              • Shin-Etsu Chemical Co., Ltd. - Overview
              • Shin-Etsu Chemical Co., Ltd. - Product / Service
              • Shin-Etsu Chemical Co., Ltd. - Key offerings
            • 13.13 Wacker Chemie AG
              • Wacker Chemie AG - Overview
              • Wacker Chemie AG - Product / Service
              • Wacker Chemie AG - Key offerings
            • 13.14 Ashland Inc.
              • Ashland Inc. - Overview
              • Ashland Inc. - Product / Service
              • Ashland Inc. - Key offerings
            • 13.15 Clariant AG
              • Clariant AG - Overview
              • Clariant AG - Product / Service
              • Clariant AG - Key offerings
            • 13.16 Merck KGaA
              • Merck KGaA - Overview
              • Merck KGaA - Product / Service
              • Merck KGaA - Key offerings
            • 13.17 Mitsui Chemicals, Inc.
              • Mitsui Chemicals, Inc. - Overview
              • Mitsui Chemicals, Inc. - Product / Service
              • Mitsui Chemicals, Inc. - Key offerings
            • 13.18 Nippon Shokubai Co., Ltd.
              • Nippon Shokubai Co., Ltd. - Overview
              • Nippon Shokubai Co., Ltd. - Product / Service
              • Nippon Shokubai Co., Ltd. - Key offerings
            • 13.19 PMC Biogenix Inc.
              • PMC Biogenix Inc. - Overview
              • PMC Biogenix Inc. - Product / Service
              • PMC Biogenix Inc. - Key offerings
            • 13.20 Silicone Engineering Ltd.
              • Silicone Engineering Ltd. - Overview
              • Silicone Engineering Ltd. - Product / Service
              • Silicone Engineering Ltd. - Key offerings
            • 13.21 Specialty Silicone Products, Inc.
              • Specialty Silicone Products, Inc. - Overview
              • Specialty Silicone Products, Inc. - Product / Service
              • Specialty Silicone Products, Inc. - Key offerings
            • 13.22 The Chemours Company
              • The Chemours Company - Overview
              • The Chemours Company - Product / Service
              • The Chemours Company - Key offerings
            • 13.23 CHT Germany GmbH
              • CHT Germany GmbH - Overview
              • CHT Germany GmbH - Product / Service
              • CHT Germany GmbH - Key offerings
            • 13.24 Dow Chemical Co.
              • Dow Chemical Co. - Overview
              • Dow Chemical Co. - Product / Service
              • Dow Chemical Co. - Key offerings
            • 13.25 DuPont de Nemours Inc.
              • DuPont de Nemours Inc. - Overview
              • DuPont de Nemours Inc. - Product / Service
              • DuPont de Nemours Inc. - Key offerings
            • 13.26 Elkem ASA
              • Elkem ASA - Overview
              • Elkem ASA - Product / Service
              • Elkem ASA - Key offerings
            • 13.27 Hoshine Silicon Industry Co. Ltd.
              • Hoshine Silicon Industry Co. Ltd. - Overview
              • Hoshine Silicon Industry Co. Ltd. - Product / Service
              • Hoshine Silicon Industry Co. Ltd. - Key offerings
            • 13.28 Innospec Inc.
              • Innospec Inc. - Overview
              • Innospec Inc. - Product / Service
              • Innospec Inc. - Key offerings
            • 13.29 Kaneka Corp.
              • Kaneka Corp. - Overview
              • Kaneka Corp. - Product / Service
              • Kaneka Corp. - Key offerings
            • 13.30 KONARK SILICONE TECHNOLOGIES
              • KONARK SILICONE TECHNOLOGIES - Overview
              • KONARK SILICONE TECHNOLOGIES - Product / Service
              • KONARK SILICONE TECHNOLOGIES - Key offerings
            • 13.31 Milliken and Co.
              • Milliken and Co. - Overview
              • Milliken and Co. - Product / Service
              • Milliken and Co. - Key offerings
            • 13.32 Mitsubishi Chemical Group Corp.
              • Mitsubishi Chemical Group Corp. - Overview
              • Mitsubishi Chemical Group Corp. - Product / Service
              • Mitsubishi Chemical Group Corp. - Key offerings
            • 13.33 Momentive Performance Materials Inc.
              • Momentive Performance Materials Inc. - Overview
              • Momentive Performance Materials Inc. - Product / Service
              • Momentive Performance Materials Inc. - Key offerings
            • 13.34 RAG Stiftung
              • RAG Stiftung - Overview
              • RAG Stiftung - Product / Service
              • RAG Stiftung - Key offerings
            • 13.35 Shin Etsu Chemical Co. Ltd.
              • Shin Etsu Chemical Co. Ltd. - Overview
              • Shin Etsu Chemical Co. Ltd. - Product / Service
              • Shin Etsu Chemical Co. Ltd. - Key offerings
            • 13.36 Silicone Solutions
              • Silicone Solutions - Overview
              • Silicone Solutions - Product / Service
              • Silicone Solutions - Key offerings
            • 13.37 Silicones Inc
              • Silicones Inc - Overview
              • Silicones Inc - Product / Service
              • Silicones Inc - Key offerings
            • 13.38 Siltech Corp.
              • Siltech Corp. - Overview
              • Siltech Corp. - Product / Service
              • Siltech Corp. - Key offerings
            • 13.39 US Silicones LLC
              • US Silicones LLC - Overview
              • US Silicones LLC - Product / Service
              • US Silicones LLC - Key offerings
            • 13.40 Vanguard Products Corp.
              • Vanguard Products Corp. - Overview
              • Vanguard Products Corp. - Product / Service
              • Vanguard Products Corp. - Key offerings
            • 13.41 Wacker Chemie AG
              • Wacker Chemie AG - Overview
              • Wacker Chemie AG - Product / Service
              • Wacker Chemie AG - Key offerings
            • 13.42 Alliance Rubber Co.
              • Alliance Rubber Co. - Overview
              • Alliance Rubber Co. - Product / Service
              • Alliance Rubber Co. - Key offerings

            13 Appendix

            • 13.1 Scope of the report
              • 13.2 Inclusions and exclusions checklist
                • Exhibit 187: Inclusions checklist
                • Exhibit 188: Exclusions checklist
              • 13.3 Currency conversion rates for US$
                • Exhibit 189: Currency conversion rates for US$
              • 13.4 Research methodology
                • Exhibit 190: Research methodology
                • Exhibit 191: Validation techniques employed for market sizing
                • Exhibit 192: Information sources
              • 13.5 List of abbreviations
                • Exhibit 193: List of abbreviations

              Research Methodology

              Technavio presents a detailed picture of the market by way of study, synthesis, and summation of data from multiple sources. The analysts have presented the various facets of the market with a particular focus on identifying the key industry influencers. The data thus presented is comprehensive, reliable, and the result of extensive research, both primary and secondary.

              INFORMATION SOURCES

              Primary sources

              • Manufacturers and suppliers
              • Channel partners
              • Industry experts
              • Strategic decision makers

              Secondary sources

              • Industry journals and periodicals
              • Government data
              • Financial reports of key industry players
              • Historical data
              • Press releases

              DATA ANALYSIS

              Data Synthesis

              • Collation of data
              • Estimation of key figures
              • Analysis of derived insights

              Data Validation

              • Triangulation with data models
              • Reference against proprietary databases
              • Corroboration with industry experts

              REPORT WRITING

              Qualitative

              • Market drivers
              • Market challenges
              • Market trends
              • Five forces analysis

              Quantitative

              • Market size and forecast
              • Market segmentation
              • Geographical insights
              • Competitive landscape

              Interested in this report?

              Get your sample now to see our research methodology and insights!

              Download Now

              Frequently Asked Questions

              Silicones market growth will increase by $ 8.76 bn during 2024-2028.

              The Silicones market is expected to grow at a CAGR of 7.32% during 2024-2028.

              Silicones market is segmented by Product( Elastomers, Fluids, Resins, Gels and others) End-user( Industrial process, Construction, Personal care and consumer products, Transportation, Others)

              Ashland Global Holdings Inc., Avantor Inc., Basf SE, Dow Inc., Elkem ASA, Evonik Industries AG, Gelest, Inc. (Mitsubishi Chemical Corporation), KCC Corporation, Momentive Performance Materials Inc., Shin-Etsu Chemical Co., Ltd., Wacker Chemie AG, Ashland Inc., Clariant AG, Merck KGaA, Mitsui Chemicals, Inc., Nippon Shokubai Co., Ltd., PMC Biogenix Inc., Silicone Engineering Ltd., Specialty Silicone Products, Inc., The Chemours Company are a few of the key vendors in the Silicones market.

              APAC will register the highest growth rate of 41% among the other regions. Therefore, the Silicones market in APAC is expected to garner significant business opportunities for the vendors during the forecast period.

              US, Canada, Germany, UK, Italy, France, China, India, Japan, Brazil, Egypt, UAE, Oman, Argentina, KSA, UAE, Brazil, Rest of World (ROW)

              • Increasing growth of construction industryThe global real estate and construction industry is witnessing significant growth owing to the rising demand for office spaces is the driving factor this market.
              • commercial complexes is the driving factor this market.
              • and residential buildings. Thus is the driving factor this market.
              • the demand for various construction materials is the driving factor this market.
              • such as construction aggregates is the driving factor this market.
              • metal products is the driving factor this market.
              • and silicone-based products is increasing. In the construction industry is the driving factor this market.
              • silicones are widely used in a variety of applications. Rapid urbanization and significant investments in infrastructure development are driving the growth of the construction industry in developing countries. The growth of the global population is increasing the demand for residences and associated infrastructure. Silicone sealants are used in the construction industry to establish reliable is the driving factor this market.
              • flexible is the driving factor this market.
              • and waterproof joints in many applications is the driving factor this market.
              • ranging from small domestic renovations and building skyscrapers to river-spanning bridges. Silicone sealants are also commonly used in facade and roofing systems is the driving factor this market.
              • windows is the driving factor this market.
              • and wall panels and partitions owing to their various properties is the driving factor this market.
              • such as better adhesion to all substrates as well as moisture and weather resistance. The growing demand for silicone sealants for glazing is the driving factor this market.
              • flooring is the driving factor this market.
              • and joining applications in the construction industry is expected to drive the silicones market. Sealants for glazing are mainly used to enhance the building design is the driving factor this market.
              • improve aesthetics is the driving factor this market.
              • and confer UV and weather resistance is the driving factor this market.
              • flexibility is the driving factor this market.
              • durability is the driving factor this market.
              • and longevity is the driving factor this market.
              • among others. The growing demand for silicones and silicone-derived products is likely to drive the growth of the global silicones market during the forecast period. Construction activities have been increasing across the world for the last five years owing to the economic recovery of several countries. The economic recession of 2008 had a severe impact on the construction industry is the driving factor this market.
              • especially in the US is the driving factor this market.
              • which was one of the largest construction markets in the world. The US is one of the key markets for silicones in North America is the driving factor this market.
              • owing to the increase in construction activities. The growth of the real estate industry in the country has increased the number of office spaces is the driving factor this market.
              • commercial complexes is the driving factor this market.
              • and residential buildings. The rising demand for residences and the low rates of unemployment are also boosting the construction industry in the US. The construction sector in China and India is also progressing at a rapid rate is the driving factor this market.
              • which is driving the growth of the global silicones market. The growing population and rapid urbanization are propelling the construction sector in these countries. In India is the driving factor this market.
              • government initiatives such as the Smart Cities Mission is the driving factor this market.
              • the Pradhan Mantri Awas Yojana (PMAY) is the driving factor this market.
              • and the Sardar Patel National Urban Housing Mission are estimated to increase the number of people living in urban areas. The increasing number of single-person and two-person households will also drive the growth of construction activities in the near future. Therefore is the driving factor this market.
              • all these factors will drive the growth of the global silicones market during the forecast period. is the driving factor this market.

              The Silicones market vendors should focus on grabbing business opportunities from the Elastomers segment as it accounted for the largest market share in the base year.
              RIA - Research AI Assistant
              Ask RIA