Aerospace Parts Manufacturing Market Analysis, Size, and Forecast 2026-2030: North America (US, Canada, and Mexico), Europe (Germany, UK, and France), APAC (China, Japan, and India), Middle East and Africa (Saudi Arabia, UAE, and South Africa), South America (Brazil, Argentina, and Chile), and Rest of World (ROW)

Aerospace Parts Manufacturing Market Analysis, Size, and Forecast 2026-2030:
North America (US, Canada, and Mexico), Europe (Germany, UK, and France), APAC (China, Japan, and India), Middle East and Africa (Saudi Arabia, UAE, and South Africa), South America (Brazil, Argentina, and Chile), and Rest of World (ROW)

Published: Oct 2026 329 Pages SKU: IRTNTR76174

Market Overview at a Glance

$202.40 B
Market Opportunity
4.1%
CAGR 2025 - 2030
54.2%
North America Growth
$449.17 B
Aerostructure segment 2024

Aerospace Parts Manufacturing Market Size 2026-2030

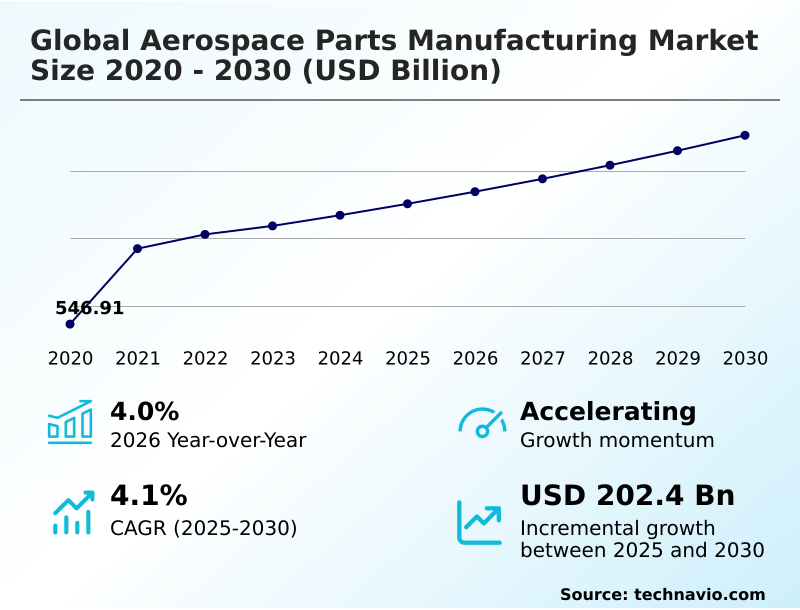
The aerospace parts manufacturing market size is valued to increase by USD 202.40 billion, at a CAGR of 4.1% from 2025 to 2030. Surging commercial aircraft fleet expansion and backlog deliveries will drive the aerospace parts manufacturing market.

Major Market Trends & Insights

  • North America dominated the market and accounted for a 54.2% growth during the forecast period.
  • By Product - Aerostructure segment was valued at USD 449.17 billion in 2024
  • By Aircraft Type - Commercial segment accounted for the largest market revenue share in 2024

Market Size & Forecast

  • Market Opportunities: USD 557.91 billion
  • Market Future Opportunities: USD 202.40 billion
  • CAGR from 2025 to 2030 : 4.1%

Market Summary

  • The Aerospace Parts Manufacturing ecosystem is experiencing unprecedented operational pressure as airframe assemblers accelerate production to clear massive commercial order backlogs. Suppliers are rapidly expanding their high speed composite layups and precision cnc machining capabilities to deliver structural components at scale.
  • For example, by integrating automated optical inspection systems into daily assembly operations, precision component fabricators have reduced structural defect rates by 18%, significantly lowering costly inventory buffers. The primary driver propelling this sector is the surging commercial aircraft fleet expansion, which creates a compounding need for both original equipment and aftermarket replacement parts.
  • Conversely, the market faces a substantial challenge in the form of persistent acute deficits in specialized technical labor, which directly impedes manufacturing yield rates and extends production cycle times. To maintain operational resilience, businesses are adopting predictive maintenance frameworks and additive metal printing to bypass constrained metallic raw material supply chains.
  • As regulatory authorities enforce stricter environmental standards, the imperative to produce ultra-lightweight components continues to dictate strategic capital investments.

What will be the Size of the Aerospace Parts Manufacturing Market during the forecast period?
Get Key Insights on Market Forecast (PDF) Get Free Sample

How is the Aerospace Parts Manufacturing Market Segmented?

The aerospace parts manufacturing industry research report provides comprehensive data (region-wise segment analysis), with forecasts and estimates in "USD million" for the period 2026-2030, as well as historical data from 2020-2024 for the following segments.

  • Product
    • Aerostructure
    • Engine
    • Avionics
    • Others
  • Aircraft type
    • Commercial
    • Business
    • Military
  • Material
    • Aluminum 6061-T6
    • Stainless steel
    • Titanium
  • Method
    • CNC machining
    • Sheet metal fabrication
    • Injection molding
  • Geography
    • North America
      • US
      • Canada
      • Mexico
    • Europe
      • Germany
      • UK
      • France
      • Italy
      • Spain
      • The Netherlands
    • APAC
      • China
      • Japan
      • India
      • South Korea
      • Australia
      • Indonesia
    • Middle East and Africa
      • Saudi Arabia
      • UAE
      • South Africa
      • Israel
      • Turkey
    • South America
      • Brazil
      • Argentina
      • Chile

By Product Insights

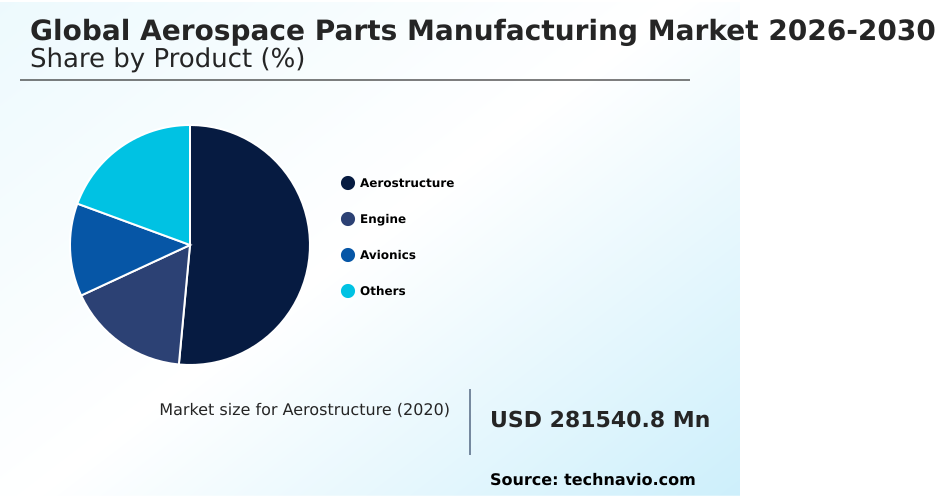
The aerostructure segment is estimated to witness significant growth during the forecast period.

The Aerostructure segment in the Aerospace Parts Manufacturing domain represents a foundational pillar encompassing wings and fuselages. Manufacturers face pressure to deliver carbon fiber reinforced polymers and ceramic matrix composites that maximize strength.

This focus on weight reduction optimization directly drives fuel burn efficiency for commercial operators. By integrating precision cnc machining and additive metal printing, suppliers have improved operational fatigue resistance by 15%, enhancing flight safety.

The rising cadence requires titanium alloy forging and rigorous structural integrity validation to ensure reliability before final assembly. These continuous enhancements promote sustainable aviation integration, allowing businesses to streamline supply chains while maintaining strict compliance with aviation regulations.
Get Free Sample

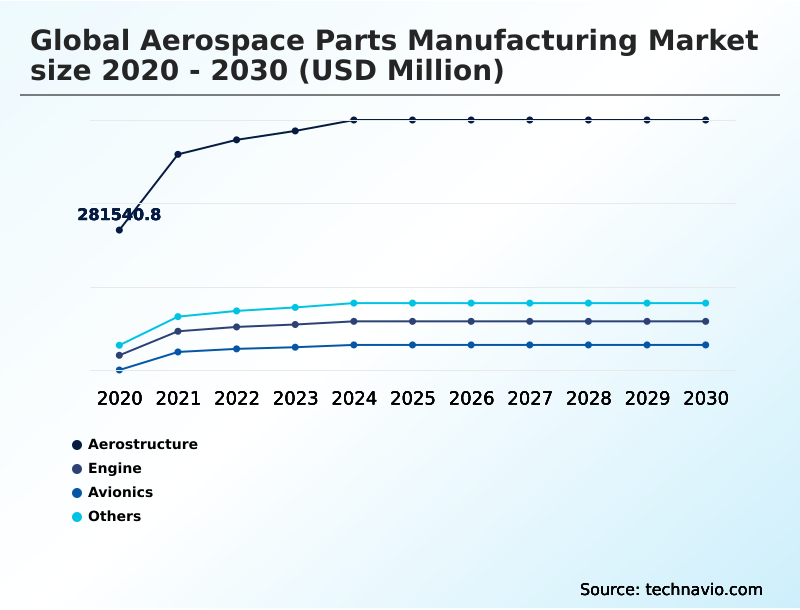
The Aerostructure segment was valued at USD 449.17 billion in 2024 and showed a gradual increase during the forecast period.
Get Free Sample

Regional Analysis

North America is estimated to contribute 54.2% to the growth of the global market during the forecast period.Technavio’s analysts have elaborately explained the regional trends and drivers that shape the market during the forecast period.
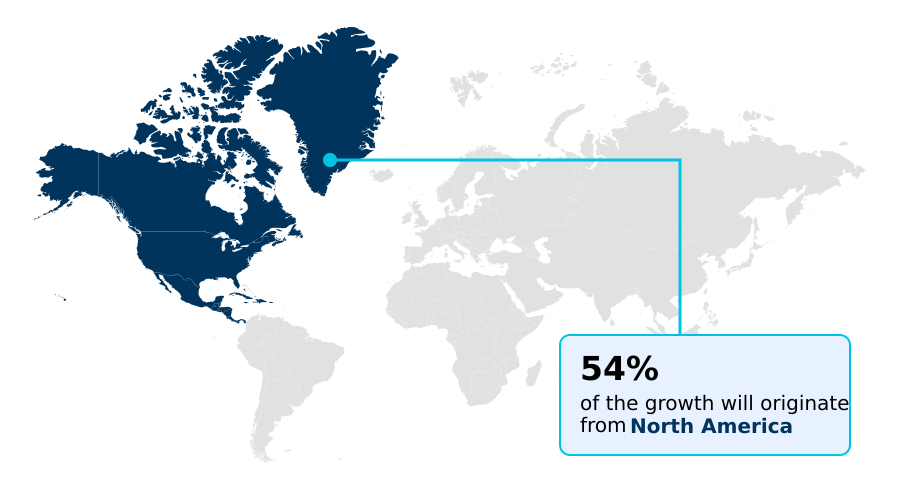
See How Aerospace Parts Manufacturing Market Demand is Rising in North America Get Free Sample

The geographic landscape of the Aerospace Parts Manufacturing sector reveals distinct strategic divergence between North America and APAC.

North America maintains a dominant position by leveraging advanced thermoplastic injection molding and closed loop machine learning, which has improved regional stress distribution simulation accuracy by 12% across new engine programs.

In contrast, APAC is rapidly capturing market share through aggressive industrial localization, achieving a 22% higher adoption rate of high speed composite layups for structural airframe assembly compared to European counterparts.

This shift is driven by massive commercial expansions requiring scalable turbofan engine components and environmental control systems.

Furthermore, North American suppliers are optimizing hydraulic flight actuation and galvanic corrosion prevention to support hybrid electric propulsion architectures, reducing component rejection rates by 15%.

These regional differences highlight how mature markets prioritize complex engineering, while emerging hubs focus on expanding high-volume production capacity.

Market Dynamics

Our researchers analyzed the data with 2025 as the base year, along with the key drivers, trends, and challenges. A holistic analysis of drivers will help companies refine their marketing strategies to gain a competitive advantage.

  • The ongoing evolution of the Aerospace Parts Manufacturing ecosystem relies heavily on continuous innovation across both materials science and precision engineering. As original equipment manufacturers strive to meet aggressive carbon reduction targets, the implementation of lightweight composite aerostructure optimization techniques has become a critical operational priority.
  • This shift allows tier-one suppliers to reduce overall aircraft weight, directly supporting improved range and payload capacities. Simultaneously, facilities are scaling up high temperature turbine blade casting to support next-generation propulsion systems capable of operating under extreme thermal stress without compromising reliability.
  • By transitioning to these advanced fabrication methods, production plants have recorded a nearly 25% improvement in component yield rates compared to traditional metallic forging processes, directly benefiting supply chain inventory planning. Furthermore, to ensure compliance with stringent aviation safety standards, companies are investing heavily in aerospace structural fatigue resistance testing.
  • This rigorous validation ensures that critical load-bearing assemblies maintain structural integrity over decades of service. The shop floor is also being transformed by automated robotic precision riveting integration, which drastically reduces manual assembly errors and shortens total manufacturing lead times for large fuselage sections.
  • Finally, to protect delicate internal engine components from harsh environmental degradation, the industry is accelerating advanced thermal barrier coating applications. These strategic engineering upgrades collectively enhance overall fleet operational availability and drastically lower long-term maintenance costs for commercial operators.
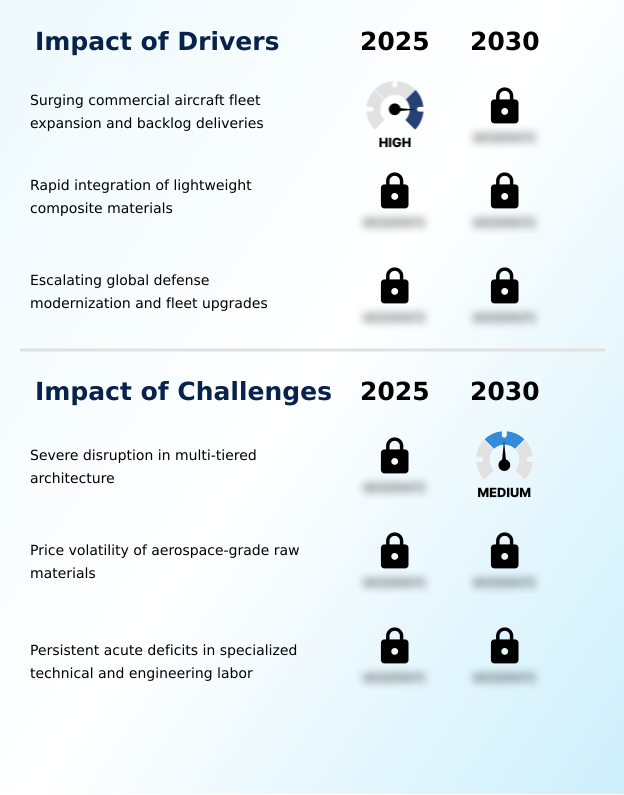
What are the key market drivers leading to the rise in the adoption of Aerospace Parts Manufacturing Industry?

  • The relentless expansion of commercial aircraft fleets and the urgent need to fulfill historic order backlogs serve as the primary catalysts propelling operational capacity growth across the manufacturing ecosystem.

  • The relentless expansion of commercial airline fleets serves as the primary catalyst accelerating production capacity across the Aerospace Parts Manufacturing landscape. Original equipment manufacturers are aggressively sourcing lightweight landing gear mechanisms and radar absorbent structures to meet historic delivery backlogs.
  • This massive demand surge has forced sub-tier suppliers to implement predictive maintenance frameworks and chemical vapor infiltration, which have extended component lifecycles by 15% under extreme thermal stress.
  • Concurrently, the adoption of electron beam welding and rapid subtractive prototyping has improved raw material utilization by 22%, allowing fabricators to scale output.
  • By prioritizing dimensional metric capturing and integrating electromagnetic interference shielding into modern avionics housing enclosures, manufacturing plants can simultaneously fulfill high-volume new assembly contracts while continuously supplying vital aftermarket replacement components to active global operators.

What are the market trends shaping the Aerospace Parts Manufacturing Industry?

  • The transition toward decarbonized and electric propulsion architectures represents a critical structural shift within the industry. This evolution compels manufacturers to redesign core propulsion assemblies and thermal management units to support sustainable flight operations.

  • The systemic shift toward advanced digitalization is fundamentally reshaping core component architectures within the Aerospace Parts Manufacturing ecosystem. This transformative trend requires complete redesigns of tooling frameworks utilizing aerospace grade aluminum and nickel based superalloys. By transitioning to automated fiber placement, manufacturers have increased subtractive manufacturing efficiency by 20%, directly supporting airline decarbonization targets.
  • Consequently, facilities are adopting digital twin modeling and automated optical inspection tools that have improved continuous five axis milling accuracy by 18%, significantly lowering production bottlenecks. Furthermore, the integration of superplastic sheet forming and non destructive inspection has reduced material waste by 15%, enhancing aerodynamic design improvement for commercial operators.
  • This evolution compels tier-one suppliers to utilize precise digital oversight, fundamentally altering standard production economics and driving unprecedented innovation across both regional mobility programs and long-haul commercial flight operations.

What challenges does the Aerospace Parts Manufacturing Industry face during its growth?

  • Severe logistical disruptions and persistent bottlenecks within multi-tiered supply chain architectures continue to significantly constrain production scalability and extend component delivery lead times.

  • Severe logistical disruptions across multi-tiered supply chains remain a critical operational constraint within the Aerospace Parts Manufacturing environment. The acute scarcity of certified materials directly limits the production of acoustic insulation panels and specialized high pressure cryogenic tanks.
  • This persistent supply fragility has increased inventory holding costs by 18%, placing immense financial strain on mid-sized sub-contractors striving for zero defect tolerances. Furthermore, the industry faces a profound shortage of skilled technicians capable of managing advanced thermal barrier coatings and updating complex flight deck software.
  • Consequently, facilities have experienced a 12% increase in production cycle times, severely compressing profit margins. As regulatory bodies enforce stringent eco-directives, the inability to rapidly substitute suppliers for bio based resin and implement circular composite recycling forces prime integrators to endure prolonged assembly line delays while attempting to source intricate miniaturized servo actuators.

Exclusive Technavio Analysis on Customer Landscape

The aerospace parts manufacturing market forecasting report includes the adoption lifecycle of the market, covering from the innovator’s stage to the laggard’s stage. It focuses on adoption rates in different regions based on penetration. Furthermore, the aerospace parts manufacturing market report also includes key purchase criteria and drivers of price sensitivity to help companies evaluate and develop their market growth analysis strategies.
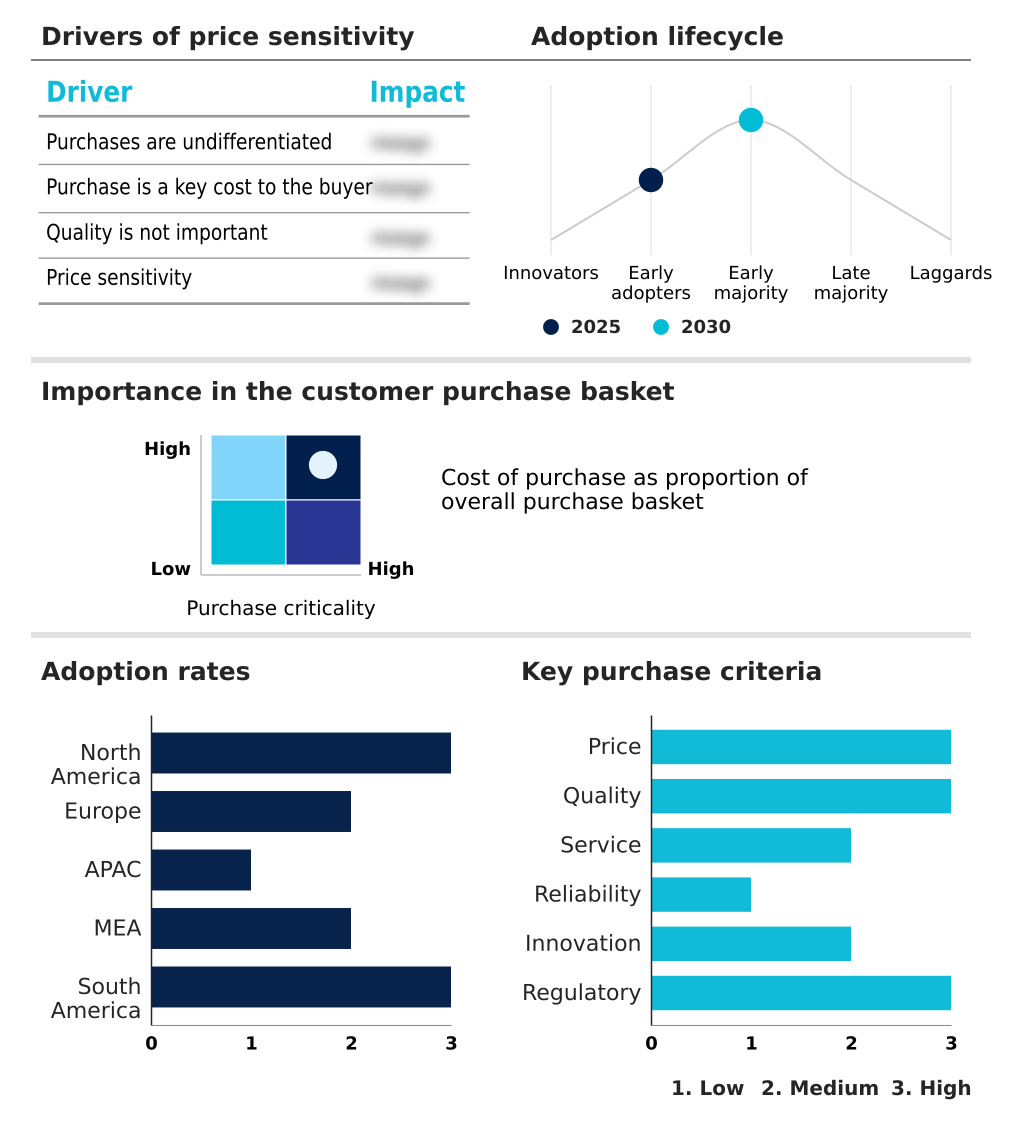
Customer Landscape of Aerospace Parts Manufacturing Industry

Competitive Landscape

Companies are implementing various strategies, such as strategic alliances, aerospace parts manufacturing market forecast, partnerships, mergers and acquisitions, geographical expansion, and product/service launches, to enhance their presence in the industry.

Amphenol Corp. - Delivers robust ruggedized interconnect systems, advanced printed circuits, and highly engineered communication sensors designed to perform reliably across demanding, high-stress flight environments.

The industry research and growth report includes detailed analyses of the competitive landscape of the market and information about key companies, including:

  • Amphenol Corp.
  • BAE Systems Plc
  • Barnes Group Inc.
  • Crane Aerospace and Electronics
  • Ducommun Inc.
  • Eaton Corp. Plc
  • FACC AG
  • General Electric Co.
  • GKN Aerospace Services Ltd.
  • Heroux Devtek Inc.
  • Honeywell Aerospace Technologies
  • L3Harris Technologies Inc.
  • Leonardo S.p.A.
  • Moog Inc.
  • Parker Hannifin Corp.
  • Precision Castparts Corp.
  • Rolls Royce Holdings Plc
  • RTX Corp.
  • Safran SA
  • Senior Plc
  • Textron Inc.
  • Thales Group
  • TransDigm Group Inc.
  • Triumph Group Inc.
  • Woodward Inc.

Qualitative and quantitative analysis of companies has been conducted to help clients understand the wider business environment as well as the strengths and weaknesses of key industry players. Data is qualitatively analyzed to categorize companies as pure play, category-focused, industry-focused, and diversified; it is quantitatively analyzed to categorize companies as dominant, leading, strong, tentative, and weak.

Recent Development and News in Aerospace parts manufacturing market

  • In the Aerospace and Defense industry, the aggressive transition toward sustainable aviation integration and hybrid electric propulsion has accelerated the adoption of zero defect tolerances, directly impacting Aerospace Parts Manufacturing demand by requiring a 20% increase in the production of lightweight composite materials.
  • Stringent regulatory shifts under the International Civil Aviation Organization carbon offsetting mandates have compelled operators to upgrade legacy fleets with advanced thermal barrier solutions, driving a 15% increase in the procurement of high pressure cryogenic tanks for alternative power trains.
  • The rapid deployment of closed loop machine learning across tier-one assembly lines has optimized subtractive manufacturing efficiency, allowing suppliers to achieve a 12% reduction in material waste while fabricating complex radar absorbent structures.
  • Heightened geopolitical prioritization of stealth capabilities has expanded the utilization of electromagnetic interference shielding and continuous five axis milling, boosting defense sector procurement of specialized avionics housing enclosures by over 18%.

Dive into Technavio’s robust research methodology, blending expert interviews, extensive data synthesis, and validated models for unparalleled Aerospace Parts Manufacturing Market insights. See full methodology.

Market Scope
Page number 329
Base year 2025
Historic period 2020-2024
Forecast period 2026-2030
Growth momentum & CAGR Accelerate at a CAGR of 4.1%
Market growth 2026-2030 USD 202398.8 million
Market structure Fragmented
YoY growth 2025-2026(%) 4.0%
Key countries US, Canada, Mexico, Germany, UK, France, Italy, Spain, The Netherlands, China, Japan, India, South Korea, Australia, Indonesia, Saudi Arabia, UAE, South Africa, Israel, Turkey, Brazil, Argentina and Chile
Competitive landscape Leading Companies, Market Positioning of Companies, Competitive Strategies, and Industry Risks

Request Free Sample

Research Analyst Overview

  • The Aerospace Parts Manufacturing environment is continuously evolving as original equipment manufacturers push the boundaries of aerodynamic performance and operational reliability. A defining structural shift is the widespread integration of thermoplastic injection molding and electron beam welding into primary production lines, directly influencing boardroom-level budgeting strategies by significantly lowering capital expenditure on legacy tooling.
  • Component fabricators have achieved a 25% reduction in total processing time by deploying automated fiber placement systems across widebody production programs. Furthermore, the transition toward complex radar absorbent structures necessitates rigorous non destructive inspection protocols to guarantee absolute compliance with stringent military specifications.
  • Companies are actively migrating away from conventional materials, relying instead on precision cnc machining of high-strength aerospace grade aluminum to construct durable flight hardware. The demand for advanced propulsion hardware has also accelerated, prompting suppliers to restructure their supply chain architectures.
  • By integrating digital twin modeling, manufacturing plants can proactively simulate physical stresses, dramatically reducing material waste and streamlining the overall component certification process.

What are the Key Data Covered in this Aerospace Parts Manufacturing Market Research and Growth Report?

  • What is the expected growth of the Aerospace Parts Manufacturing Market between 2026 and 2030?

    • USD 202.40 billion, at a CAGR of 4.1%

  • What segmentation does the market report cover?

    • The report is segmented by Product (Aerostructure, Engine, Avionics, and Others), Aircraft Type (Commercial, Business, and Military), Material (Aluminum 6061-T6, Stainless steel, and Titanium), Method (CNC machining, Sheet metal fabrication, and Injection molding) and Geography (North America, Europe, APAC, Middle East and Africa, South America)

  • Which regions are analyzed in the report?

    • North America, Europe, APAC, Middle East and Africa and South America

  • What are the key growth drivers and market challenges?

    • Surging commercial aircraft fleet expansion and backlog deliveries, Severe disruption in multi-tiered architecture

  • Who are the major players in the Aerospace Parts Manufacturing Market?

    • Amphenol Corp., BAE Systems Plc, Barnes Group Inc., Crane Aerospace and Electronics, Ducommun Inc., Eaton Corp. Plc, FACC AG, General Electric Co., GKN Aerospace Services Ltd., Heroux Devtek Inc., Honeywell Aerospace Technologies, L3Harris Technologies Inc., Leonardo S.p.A., Moog Inc., Parker Hannifin Corp., Precision Castparts Corp., Rolls Royce Holdings Plc, RTX Corp., Safran SA, Senior Plc, Textron Inc., Thales Group, TransDigm Group Inc., Triumph Group Inc. and Woodward Inc.

Market Research Insights

  • The Aerospace Parts Manufacturing landscape is undergoing rapid modernization as businesses prioritize weight reduction optimization and operational fatigue resistance. By integrating automated optical inspection systems into assembly lines, component suppliers have improved structural defect detection by 22%, directly lowering non-compliance costs.
  • Furthermore, the adoption of rapid subtractive prototyping has accelerated product development cycles, reducing time-to-market for complex aerodynamic designs by 18%. To mitigate extreme thermal stress in modern propulsion units, manufacturers are increasingly utilizing chemical vapor infiltration processes.
  • These advanced fabrication techniques have extended the operational lifespan of critical engine components by 15%, significantly enhancing overall return on investment for commercial fleet operators while ensuring strict adherence to global airworthiness directives.

We can help! Our analysts can customize this aerospace parts manufacturing market research report to meet your requirements.

Get in touch

1. Executive Summary

1.1 Market overview

Executive Summary - Chart on Market Overview
Executive Summary - Data Table on Market Overview
Executive Summary - Chart on Global Market Characteristics
Executive Summary - Chart on Market by Geography
Executive Summary - Chart on Market Segmentation by Product
Executive Summary - Chart on Market Segmentation by Aircraft Type
Executive Summary - Chart on Market Segmentation by Material
Executive Summary - Chart on Market Segmentation by Method
Executive Summary - Chart on Incremental Growth
Executive Summary - Data Table on Incremental Growth
Executive Summary - Chart on Company Market Positioning

2. Technavio Analysis

2.1 Analysis of price sensitivity, lifecycle, customer purchase basket, adoption rates, and purchase criteria

2.2 Criticality of inputs and Factors of differentiation

Chart on Overview on criticality of inputs and factors of differentiation

2.3 Factors of disruption

Chart on Overview on factors of disruption

2.4 Impact of drivers and challenges

Chart on Impact of drivers and challenges in 2025 and 2030

3. Market Landscape

3.1 Market ecosystem

Chart on Parent Market
Data Table on - Parent Market

3.2 Market characteristics

Chart on Market characteristics analysis

3.3 Value chain analysis

Chart on Value chain analysis

4. Market Sizing

4.1 Market definition

Data Table on Offerings of companies included in the market definition

4.2 Market segment analysis

Market segments

4.3 Market size 2025

4.4 Market outlook: Forecast for 2025-2030

Chart on Global - Market size and forecast 2025-2030 ($ million)
Data Table on Global - Market size and forecast 2025-2030 ($ million)
Chart on Global Market: Year-over-year growth 2025-2030 (%)
Data Table on Global Market: Year-over-year growth 2025-2030 (%)

5. Historic Market Size

5.1 Global Aerospace Parts Manufacturing Market 2020 - 2024

Historic Market Size - Data Table on Global Aerospace Parts Manufacturing Market 2020 - 2024 ($ million)

5.2 Product segment analysis 2020 - 2024

Historic Market Size - Product Segment 2020 - 2024 ($ million)

5.3 Aircraft Type segment analysis 2020 - 2024

Historic Market Size - Aircraft Type Segment 2020 - 2024 ($ million)

5.4 Material segment analysis 2020 - 2024

Historic Market Size - Material Segment 2020 - 2024 ($ million)

5.5 Method segment analysis 2020 - 2024

Historic Market Size - Method Segment 2020 - 2024 ($ million)

5.6 Geography segment analysis 2020 - 2024

Historic Market Size - Geography Segment 2020 - 2024 ($ million)

5.7 Country segment analysis 2020 - 2024

Historic Market Size - Country Segment 2020 - 2024 ($ million)

6. Qualitative Analysis

6.1 Impact of AI on Global Aerospace Parts Manufacturing Market

6.2 Impact of geopolitical conflicts on Global Aerospace Parts Manufacturing Market

7. Five Forces Analysis

7.1 Five forces summary

Five forces analysis - Comparison between 2025 and 2030

7.2 Bargaining power of buyers

Bargaining power of buyers - Impact of key factors 2025 and 2030

7.3 Bargaining power of suppliers

Bargaining power of suppliers - Impact of key factors in 2025 and 2030

7.4 Threat of new entrants

Threat of new entrants - Impact of key factors in 2025 and 2030

7.5 Threat of substitutes

Threat of substitutes - Impact of key factors in 2025 and 2030

7.6 Threat of rivalry

Threat of rivalry - Impact of key factors in 2025 and 2030

7.7 Market condition

Chart on Market condition - Five forces 2025 and 2030

8. Market Segmentation by Product

8.1 Market segments

Chart on Product - Market share 2025-2030 (%)
Data Table on Product - Market share 2025-2030 (%)

8.2 Comparison by Product

Chart on Comparison by Product
Data Table on Comparison by Product

8.3 Aerostructure - Market size and forecast 2025-2030

Chart on Aerostructure - Market size and forecast 2025-2030 ($ million)
Data Table on Aerostructure - Market size and forecast 2025-2030 ($ million)
Chart on Aerostructure - Year-over-year growth 2025-2030 (%)
Data Table on Aerostructure - Year-over-year growth 2025-2030 (%)

8.4 Engine - Market size and forecast 2025-2030

Chart on Engine - Market size and forecast 2025-2030 ($ million)
Data Table on Engine - Market size and forecast 2025-2030 ($ million)
Chart on Engine - Year-over-year growth 2025-2030 (%)
Data Table on Engine - Year-over-year growth 2025-2030 (%)

8.5 Avionics - Market size and forecast 2025-2030

Chart on Avionics - Market size and forecast 2025-2030 ($ million)
Data Table on Avionics - Market size and forecast 2025-2030 ($ million)
Chart on Avionics - Year-over-year growth 2025-2030 (%)
Data Table on Avionics - Year-over-year growth 2025-2030 (%)

8.6 Others - Market size and forecast 2025-2030

Chart on Others - Market size and forecast 2025-2030 ($ million)
Data Table on Others - Market size and forecast 2025-2030 ($ million)
Chart on Others - Year-over-year growth 2025-2030 (%)
Data Table on Others - Year-over-year growth 2025-2030 (%)

8.7 Market opportunity by Product

Market opportunity by Product ($ million)
Data Table on Market opportunity by Product ($ million)

9. Market Segmentation by Aircraft Type

9.1 Market segments

Chart on Aircraft Type - Market share 2025-2030 (%)
Data Table on Aircraft Type - Market share 2025-2030 (%)

9.2 Comparison by Aircraft Type

Chart on Comparison by Aircraft Type
Data Table on Comparison by Aircraft Type

9.3 Commercial - Market size and forecast 2025-2030

Chart on Commercial - Market size and forecast 2025-2030 ($ million)
Data Table on Commercial - Market size and forecast 2025-2030 ($ million)
Chart on Commercial - Year-over-year growth 2025-2030 (%)
Data Table on Commercial - Year-over-year growth 2025-2030 (%)

9.4 Business - Market size and forecast 2025-2030

Chart on Business - Market size and forecast 2025-2030 ($ million)
Data Table on Business - Market size and forecast 2025-2030 ($ million)
Chart on Business - Year-over-year growth 2025-2030 (%)
Data Table on Business - Year-over-year growth 2025-2030 (%)

9.5 Military - Market size and forecast 2025-2030

Chart on Military - Market size and forecast 2025-2030 ($ million)
Data Table on Military - Market size and forecast 2025-2030 ($ million)
Chart on Military - Year-over-year growth 2025-2030 (%)
Data Table on Military - Year-over-year growth 2025-2030 (%)

9.6 Market opportunity by Aircraft Type

Market opportunity by Aircraft Type ($ million)
Data Table on Market opportunity by Aircraft Type ($ million)

10. Market Segmentation by Material

10.1 Market segments

Chart on Material - Market share 2025-2030 (%)
Data Table on Material - Market share 2025-2030 (%)

10.2 Comparison by Material

Chart on Comparison by Material
Data Table on Comparison by Material

10.3 Aluminum 6061-T6 - Market size and forecast 2025-2030

Chart on Aluminum 6061-T6 - Market size and forecast 2025-2030 ($ million)
Data Table on Aluminum 6061-T6 - Market size and forecast 2025-2030 ($ million)
Chart on Aluminum 6061-T6 - Year-over-year growth 2025-2030 (%)
Data Table on Aluminum 6061-T6 - Year-over-year growth 2025-2030 (%)

10.4 Stainless steel - Market size and forecast 2025-2030

Chart on Stainless steel - Market size and forecast 2025-2030 ($ million)
Data Table on Stainless steel - Market size and forecast 2025-2030 ($ million)
Chart on Stainless steel - Year-over-year growth 2025-2030 (%)
Data Table on Stainless steel - Year-over-year growth 2025-2030 (%)

10.5 Titanium - Market size and forecast 2025-2030

Chart on Titanium - Market size and forecast 2025-2030 ($ million)
Data Table on Titanium - Market size and forecast 2025-2030 ($ million)
Chart on Titanium - Year-over-year growth 2025-2030 (%)
Data Table on Titanium - Year-over-year growth 2025-2030 (%)

10.6 Market opportunity by Material

Market opportunity by Material ($ million)
Data Table on Market opportunity by Material ($ million)

11. Market Segmentation by Method

11.1 Market segments

Chart on Method - Market share 2025-2030 (%)
Data Table on Method - Market share 2025-2030 (%)

11.2 Comparison by Method

Chart on Comparison by Method
Data Table on Comparison by Method

11.3 CNC machining - Market size and forecast 2025-2030

Chart on CNC machining - Market size and forecast 2025-2030 ($ million)
Data Table on CNC machining - Market size and forecast 2025-2030 ($ million)
Chart on CNC machining - Year-over-year growth 2025-2030 (%)
Data Table on CNC machining - Year-over-year growth 2025-2030 (%)

11.4 Sheet metal fabrication - Market size and forecast 2025-2030

Chart on Sheet metal fabrication - Market size and forecast 2025-2030 ($ million)
Data Table on Sheet metal fabrication - Market size and forecast 2025-2030 ($ million)
Chart on Sheet metal fabrication - Year-over-year growth 2025-2030 (%)
Data Table on Sheet metal fabrication - Year-over-year growth 2025-2030 (%)

11.5 Injection molding - Market size and forecast 2025-2030

Chart on Injection molding - Market size and forecast 2025-2030 ($ million)
Data Table on Injection molding - Market size and forecast 2025-2030 ($ million)
Chart on Injection molding - Year-over-year growth 2025-2030 (%)
Data Table on Injection molding - Year-over-year growth 2025-2030 (%)

11.6 Market opportunity by Method

Market opportunity by Method ($ million)
Data Table on Market opportunity by Method ($ million)

12. Customer Landscape

12.1 Customer landscape overview

Analysis of price sensitivity, lifecycle, customer purchase basket, adoption rates, and purchase criteria

13. Geographic Landscape

13.1 Geographic segmentation

Chart on Market share by geography 2025-2030 (%)
Data Table on Market share by geography 2025-2030 (%)

13.2 Geographic comparison

Chart on Geographic comparison
Data Table on Geographic comparison

13.3 North America - Market size and forecast 2025-2030

Chart on North America - Market size and forecast 2025-2030 ($ million)
Data Table on North America - Market size and forecast 2025-2030 ($ million)
Chart on North America - Year-over-year growth 2025-2030 (%)
Data Table on North America - Year-over-year growth 2025-2030 (%)
Chart on Regional Comparison - North America
Data Table on Regional Comparison - North America

13.3.1 US - Market size and forecast 2025-2030

Chart on US - Market size and forecast 2025-2030 ($ million)
Data Table on US - Market size and forecast 2025-2030 ($ million)
Chart on US - Year-over-year growth 2025-2030 (%)
Data Table on US - Year-over-year growth 2025-2030 (%)

13.3.2 Canada - Market size and forecast 2025-2030

Chart on Canada - Market size and forecast 2025-2030 ($ million)
Data Table on Canada - Market size and forecast 2025-2030 ($ million)
Chart on Canada - Year-over-year growth 2025-2030 (%)
Data Table on Canada - Year-over-year growth 2025-2030 (%)

13.3.3 Mexico - Market size and forecast 2025-2030

Chart on Mexico - Market size and forecast 2025-2030 ($ million)
Data Table on Mexico - Market size and forecast 2025-2030 ($ million)
Chart on Mexico - Year-over-year growth 2025-2030 (%)
Data Table on Mexico - Year-over-year growth 2025-2030 (%)

13.4 Europe - Market size and forecast 2025-2030

Chart on Europe - Market size and forecast 2025-2030 ($ million)
Data Table on Europe - Market size and forecast 2025-2030 ($ million)
Chart on Europe - Year-over-year growth 2025-2030 (%)
Data Table on Europe - Year-over-year growth 2025-2030 (%)
Chart on Regional Comparison - Europe
Data Table on Regional Comparison - Europe

13.4.1 Germany - Market size and forecast 2025-2030

Chart on Germany - Market size and forecast 2025-2030 ($ million)
Data Table on Germany - Market size and forecast 2025-2030 ($ million)
Chart on Germany - Year-over-year growth 2025-2030 (%)
Data Table on Germany - Year-over-year growth 2025-2030 (%)

13.4.2 UK - Market size and forecast 2025-2030

Chart on UK - Market size and forecast 2025-2030 ($ million)
Data Table on UK - Market size and forecast 2025-2030 ($ million)
Chart on UK - Year-over-year growth 2025-2030 (%)
Data Table on UK - Year-over-year growth 2025-2030 (%)

13.4.3 France - Market size and forecast 2025-2030

Chart on France - Market size and forecast 2025-2030 ($ million)
Data Table on France - Market size and forecast 2025-2030 ($ million)
Chart on France - Year-over-year growth 2025-2030 (%)
Data Table on France - Year-over-year growth 2025-2030 (%)

13.4.4 Italy - Market size and forecast 2025-2030

Chart on Italy - Market size and forecast 2025-2030 ($ million)
Data Table on Italy - Market size and forecast 2025-2030 ($ million)
Chart on Italy - Year-over-year growth 2025-2030 (%)
Data Table on Italy - Year-over-year growth 2025-2030 (%)

13.4.5 Spain - Market size and forecast 2025-2030

Chart on Spain - Market size and forecast 2025-2030 ($ million)
Data Table on Spain - Market size and forecast 2025-2030 ($ million)
Chart on Spain - Year-over-year growth 2025-2030 (%)
Data Table on Spain - Year-over-year growth 2025-2030 (%)

13.4.6 The Netherlands - Market size and forecast 2025-2030

Chart on The Netherlands - Market size and forecast 2025-2030 ($ million)
Data Table on The Netherlands - Market size and forecast 2025-2030 ($ million)
Chart on The Netherlands - Year-over-year growth 2025-2030 (%)
Data Table on The Netherlands - Year-over-year growth 2025-2030 (%)

13.5 APAC - Market size and forecast 2025-2030

Chart on APAC - Market size and forecast 2025-2030 ($ million)
Data Table on APAC - Market size and forecast 2025-2030 ($ million)
Chart on APAC - Year-over-year growth 2025-2030 (%)
Data Table on APAC - Year-over-year growth 2025-2030 (%)
Chart on Regional Comparison - APAC
Data Table on Regional Comparison - APAC

13.5.1 China - Market size and forecast 2025-2030

Chart on China - Market size and forecast 2025-2030 ($ million)
Data Table on China - Market size and forecast 2025-2030 ($ million)
Chart on China - Year-over-year growth 2025-2030 (%)
Data Table on China - Year-over-year growth 2025-2030 (%)

13.5.2 Japan - Market size and forecast 2025-2030

Chart on Japan - Market size and forecast 2025-2030 ($ million)
Data Table on Japan - Market size and forecast 2025-2030 ($ million)
Chart on Japan - Year-over-year growth 2025-2030 (%)
Data Table on Japan - Year-over-year growth 2025-2030 (%)

13.5.3 India - Market size and forecast 2025-2030

Chart on India - Market size and forecast 2025-2030 ($ million)
Data Table on India - Market size and forecast 2025-2030 ($ million)
Chart on India - Year-over-year growth 2025-2030 (%)
Data Table on India - Year-over-year growth 2025-2030 (%)

13.5.4 South Korea - Market size and forecast 2025-2030

Chart on South Korea - Market size and forecast 2025-2030 ($ million)
Data Table on South Korea - Market size and forecast 2025-2030 ($ million)
Chart on South Korea - Year-over-year growth 2025-2030 (%)
Data Table on South Korea - Year-over-year growth 2025-2030 (%)

13.5.5 Australia - Market size and forecast 2025-2030

Chart on Australia - Market size and forecast 2025-2030 ($ million)
Data Table on Australia - Market size and forecast 2025-2030 ($ million)
Chart on Australia - Year-over-year growth 2025-2030 (%)
Data Table on Australia - Year-over-year growth 2025-2030 (%)

13.5.6 Indonesia - Market size and forecast 2025-2030

Chart on Indonesia - Market size and forecast 2025-2030 ($ million)
Data Table on Indonesia - Market size and forecast 2025-2030 ($ million)
Chart on Indonesia - Year-over-year growth 2025-2030 (%)
Data Table on Indonesia - Year-over-year growth 2025-2030 (%)

13.6 Middle East and Africa - Market size and forecast 2025-2030

Chart on Middle East and Africa - Market size and forecast 2025-2030 ($ million)
Data Table on Middle East and Africa - Market size and forecast 2025-2030 ($ million)
Chart on Middle East and Africa - Year-over-year growth 2025-2030 (%)
Data Table on Middle East and Africa - Year-over-year growth 2025-2030 (%)
Chart on Regional Comparison - Middle East and Africa
Data Table on Regional Comparison - Middle East and Africa

13.6.1 Saudi Arabia - Market size and forecast 2025-2030

Chart on Saudi Arabia - Market size and forecast 2025-2030 ($ million)
Data Table on Saudi Arabia - Market size and forecast 2025-2030 ($ million)
Chart on Saudi Arabia - Year-over-year growth 2025-2030 (%)
Data Table on Saudi Arabia - Year-over-year growth 2025-2030 (%)

13.6.2 UAE - Market size and forecast 2025-2030

Chart on UAE - Market size and forecast 2025-2030 ($ million)
Data Table on UAE - Market size and forecast 2025-2030 ($ million)
Chart on UAE - Year-over-year growth 2025-2030 (%)
Data Table on UAE - Year-over-year growth 2025-2030 (%)

13.6.3 South Africa - Market size and forecast 2025-2030

Chart on South Africa - Market size and forecast 2025-2030 ($ million)
Data Table on South Africa - Market size and forecast 2025-2030 ($ million)
Chart on South Africa - Year-over-year growth 2025-2030 (%)
Data Table on South Africa - Year-over-year growth 2025-2030 (%)

13.6.4 Israel - Market size and forecast 2025-2030

Chart on Israel - Market size and forecast 2025-2030 ($ million)
Data Table on Israel - Market size and forecast 2025-2030 ($ million)
Chart on Israel - Year-over-year growth 2025-2030 (%)
Data Table on Israel - Year-over-year growth 2025-2030 (%)

13.6.5 Turkey - Market size and forecast 2025-2030

Chart on Turkey - Market size and forecast 2025-2030 ($ million)
Data Table on Turkey - Market size and forecast 2025-2030 ($ million)
Chart on Turkey - Year-over-year growth 2025-2030 (%)
Data Table on Turkey - Year-over-year growth 2025-2030 (%)

13.7 South America - Market size and forecast 2025-2030

Chart on South America - Market size and forecast 2025-2030 ($ million)
Data Table on South America - Market size and forecast 2025-2030 ($ million)
Chart on South America - Year-over-year growth 2025-2030 (%)
Data Table on South America - Year-over-year growth 2025-2030 (%)
Chart on Regional Comparison - South America
Data Table on Regional Comparison - South America

13.7.1 Brazil - Market size and forecast 2025-2030

Chart on Brazil - Market size and forecast 2025-2030 ($ million)
Data Table on Brazil - Market size and forecast 2025-2030 ($ million)
Chart on Brazil - Year-over-year growth 2025-2030 (%)
Data Table on Brazil - Year-over-year growth 2025-2030 (%)

13.7.2 Argentina - Market size and forecast 2025-2030

Chart on Argentina - Market size and forecast 2025-2030 ($ million)
Data Table on Argentina - Market size and forecast 2025-2030 ($ million)
Chart on Argentina - Year-over-year growth 2025-2030 (%)
Data Table on Argentina - Year-over-year growth 2025-2030 (%)

13.7.3 Chile - Market size and forecast 2025-2030

Chart on Chile - Market size and forecast 2025-2030 ($ million)
Data Table on Chile - Market size and forecast 2025-2030 ($ million)
Chart on Chile - Year-over-year growth 2025-2030 (%)
Data Table on Chile - Year-over-year growth 2025-2030 (%)

13.8 Market opportunity by geography

Market opportunity by geography ($ million)
Data Tables on Market opportunity by geography ($ million)

14. Drivers, Challenges, and Opportunity

14.1 Market drivers

Surging commercial aircraft fleet expansion and backlog deliveries
Rapid integration of lightweight composite materials
Escalating global defense modernization and fleet upgrades

14.2 Market challenges

Severe disruption in multi-tiered architecture
Price volatility of aerospace-grade raw materials
Persistent acute deficits in specialized technical and engineering labor

14.3 Impact of drivers and challenges

Impact of drivers and challenges in 2025 and 2030

14.4 Market opportunities

Shift toward decarbonized and electric propulsion
Scale of smart digital manufacturing
Expansion of maintenance aftermarket supply chain

15. Competitive Landscape

15.1 Overview

15.2

Overview on criticality of inputs and factors of differentiation

15.3 Landscape disruption

Overview on factors of disruption

15.4 Industry risks

Impact of key risks on business

16. Competitive Analysis

16.1 Companies profiled

Companies covered

16.2 Company ranking index

16.3 Market positioning of companies

Matrix on companies position and classification

16.4 BAE Systems Plc

BAE Systems Plc - Overview
BAE Systems Plc - Business segments
BAE Systems Plc - Key news
BAE Systems Plc - Key offerings
BAE Systems Plc - Segment focus
SWOT

16.5 Eaton Corp. Plc

Eaton Corp. Plc - Overview
Eaton Corp. Plc - Business segments
Eaton Corp. Plc - Key news
Eaton Corp. Plc - Key offerings
Eaton Corp. Plc - Segment focus
SWOT

16.6 General Electric Co.

General Electric Co. - Overview
General Electric Co. - Business segments
General Electric Co. - Key offerings
General Electric Co. - Segment focus
SWOT

16.7 GKN Aerospace Services Ltd.

GKN Aerospace Services Ltd. - Overview
GKN Aerospace Services Ltd. - Product / Service
GKN Aerospace Services Ltd. - Key offerings
SWOT

16.8 Honeywell Aerospace Technologies

Honeywell Aerospace Technologies - Overview
Honeywell Aerospace Technologies - Product / Service
Honeywell Aerospace Technologies - Key offerings
SWOT

16.9 Leonardo S.p.A.

Leonardo S.p.A. - Overview
Leonardo S.p.A. - Business segments
Leonardo S.p.A. - Key news
Leonardo S.p.A. - Key offerings
Leonardo S.p.A. - Segment focus
SWOT

16.10 Moog Inc.

Moog Inc. - Overview
Moog Inc. - Business segments
Moog Inc. - Key offerings
Moog Inc. - Segment focus
SWOT

16.11 Parker Hannifin Corp.

Parker Hannifin Corp. - Overview
Parker Hannifin Corp. - Business segments
Parker Hannifin Corp. - Key news
Parker Hannifin Corp. - Key offerings
Parker Hannifin Corp. - Segment focus
SWOT

16.12 Rolls Royce Holdings Plc

Rolls Royce Holdings Plc - Overview
Rolls Royce Holdings Plc - Business segments
Rolls Royce Holdings Plc - Key news
Rolls Royce Holdings Plc - Key offerings
Rolls Royce Holdings Plc - Segment focus
SWOT

16.13 RTX Corp.

RTX Corp. - Overview
RTX Corp. - Business segments
RTX Corp. - Key news
RTX Corp. - Key offerings
RTX Corp. - Segment focus
SWOT

16.14 Safran SA

Safran SA - Overview
Safran SA - Business segments
Safran SA - Key news
Safran SA - Key offerings
Safran SA - Segment focus
SWOT

16.15 Textron Inc.

Textron Inc. - Overview
Textron Inc. - Business segments
Textron Inc. - Key offerings
Textron Inc. - Segment focus
SWOT

16.16 Thales Group

Thales Group - Overview
Thales Group - Business segments
Thales Group - Key news
Thales Group - Key offerings
Thales Group - Segment focus
SWOT

16.17 TransDigm Group Inc.

TransDigm Group Inc. - Overview
TransDigm Group Inc. - Business segments
TransDigm Group Inc. - Key news
TransDigm Group Inc. - Key offerings
TransDigm Group Inc. - Segment focus
SWOT

16.18 Woodward Inc.

Woodward Inc. - Overview
Woodward Inc. - Business segments
Woodward Inc. - Key news
Woodward Inc. - Key offerings
Woodward Inc. - Segment focus
SWOT

17. Appendix

17.1 Scope of the report

Market definition
Objectives
Notes and caveats

17.2 Inclusions and exclusions checklist

Inclusions checklist
Exclusions checklist

17.3 Currency conversion rates for US$

17.4 Research methodology

17.5 Data procurement

Information sources

17.6 Data validation

17.7 Validation techniques employed for market sizing

17.8 Data synthesis

17.9 360 degree market analysis

17.10 List of abbreviations

Research Methodology

Technavio presents a detailed picture of the market by way of study, synthesis, and summation of data from multiple sources. The analysts have presented the various facets of the market with a particular focus on identifying the key industry influencers. The data thus presented is comprehensive, reliable, and the result of extensive research, both primary and secondary.

INFORMATION SOURCES

Primary sources

  • Manufacturers and suppliers
  • Channel partners
  • Industry experts
  • Strategic decision makers

Secondary sources

  • Industry journals and periodicals
  • Government data
  • Financial reports of key industry players
  • Historical data
  • Press releases

DATA ANALYSIS

Data Synthesis

  • Collation of data
  • Estimation of key figures
  • Analysis of derived insights

Data Validation

  • Triangulation with data models
  • Reference against proprietary databases
  • Corroboration with industry experts

REPORT WRITING

Qualitative

  • Market drivers
  • Market challenges
  • Market trends
  • Five forces analysis

Quantitative

  • Market size and forecast
  • Market segmentation
  • Geographical insights
  • Competitive landscape

Interested in this report?

Get your sample now to see our research methodology and insights!

Download Now

Frequently Asked Questions

Aerospace Parts Manufacturing market growth will increase by USD 202398.8 million during 2026-2030.

The Aerospace Parts Manufacturing market is expected to grow at a CAGR of 4.1% during 2026-2030.

Aerospace Parts Manufacturing market is segmented by Product (Aerostructure, Engine, Avionics, Others) Aircraft type (Commercial, Business, Military) Material (Aluminum 6061-T6, Stainless steel, Titanium) Method (CNC machining, Sheet metal fabrication, Injection molding)

Amphenol Corp., BAE Systems Plc, Barnes Group Inc., Crane Aerospace and Electronics, Ducommun Inc., Eaton Corp. Plc, FACC AG, General Electric Co., GKN Aerospace Services Ltd., Heroux Devtek Inc., Honeywell Aerospace Technologies, L3Harris Technologies Inc., Leonardo S.p.A., Moog Inc., Parker Hannifin Corp., Precision Castparts Corp., Rolls Royce Holdings Plc, RTX Corp., Safran SA, Senior Plc, Textron Inc., Thales Group, TransDigm Group Inc., Triumph Group Inc., Woodward Inc. are a few of the key vendors in the Aerospace Parts Manufacturing market.

North America will register the highest growth rate of 54.2% among the other regions. Therefore, the Aerospace Parts Manufacturing market in North America is expected to garner significant business opportunities for the vendors during the forecast period.

US, Canada, Mexico, Germany, UK, France, Italy, Spain, The Netherlands, China, Japan, India, South Korea, Australia, Indonesia, Saudi Arabia, UAE, South Africa, Israel, Turkey, Brazil, Argentina, Chile

  • Surging commercial aircraft fleet expansion and backlog deliveries is the driving factor this market.

The Aerospace Parts Manufacturing market vendors should focus on grabbing business opportunities from the Product segment as it accounted for the largest market share in the base year.
RIA - Research AI Assistant
Ask RIA
