
AI Analytics In Military Defense Market Size 2025-2029
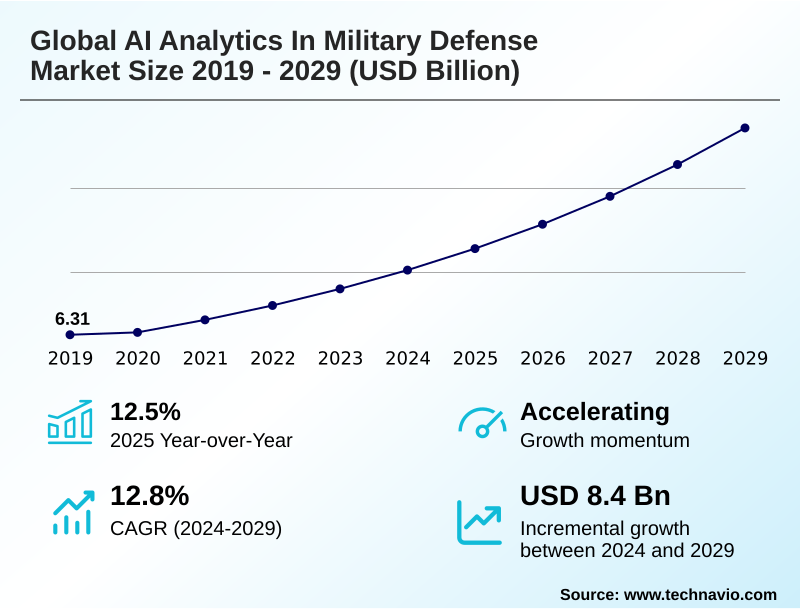
The ai analytics in military defense market size is valued to increase by USD 8.40 billion, at a CAGR of 12.8% from 2024 to 2029. Rising geopolitical tensions will drive the ai analytics in military defense market.
Major Market Trends & Insights
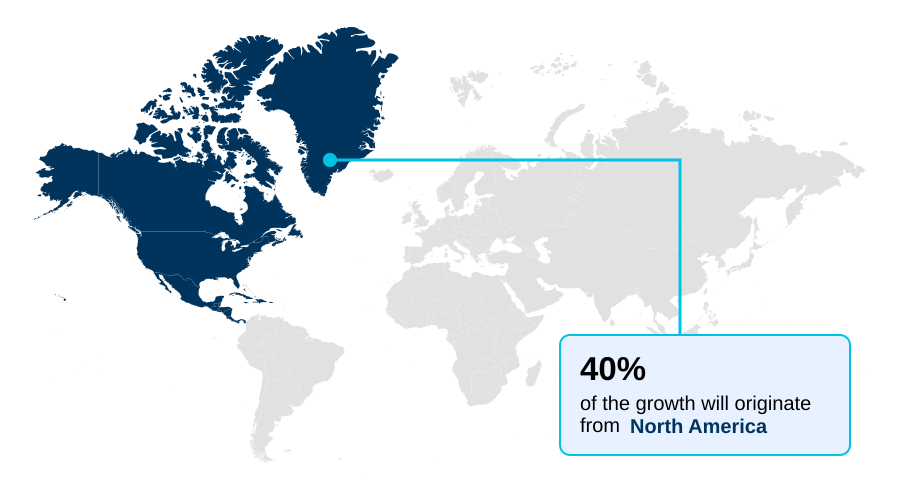
- North America dominated the market and accounted for a 40.5% growth during the forecast period.
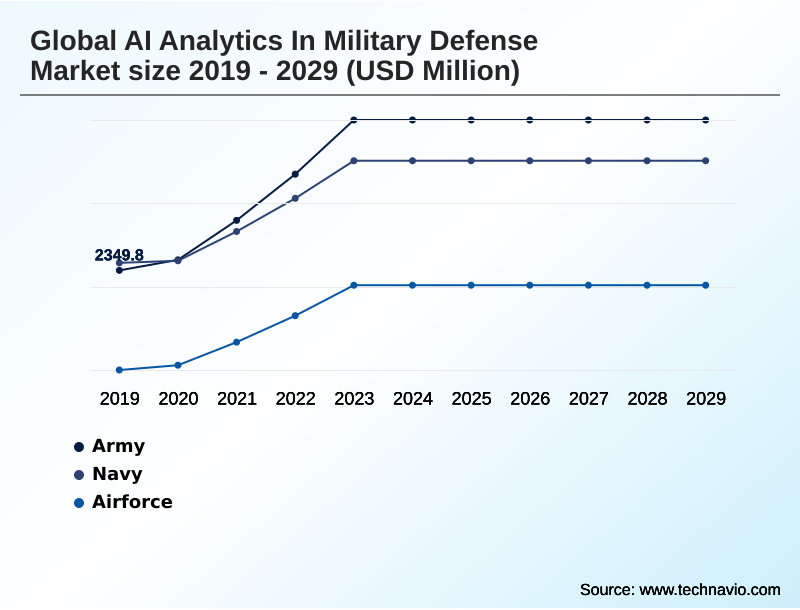
- By Platform - Army segment was valued at USD 3.56 billion in 2023
- By Application - Surveillance and situational awareness segment accounted for the largest market revenue share in 2023
Market Size & Forecast
- Market Opportunities: USD 12.21 billion
- Market Future Opportunities: USD 8.40 billion
- CAGR from 2024 to 2029 : 12.8%
Market Summary
- The AI analytics in military defense market is defined by the application of advanced computational techniques to bolster national security. This involves leveraging machine learning and deep learning to derive actionable intelligence from vast datasets, enabling capabilities like predictive maintenance, real-time threat detection, and autonomous surveillance.
- The technology functions by analyzing diverse inputs, from sensor data to intelligence feeds, to identify patterns and optimize operations. For instance, in naval operations, AI systems analyze vessel performance data to forecast component failures, scheduling maintenance proactively to improve fleet readiness and reduce downtime. This shift toward data-driven decision-making is transforming military intelligence, logistics, and command and control.
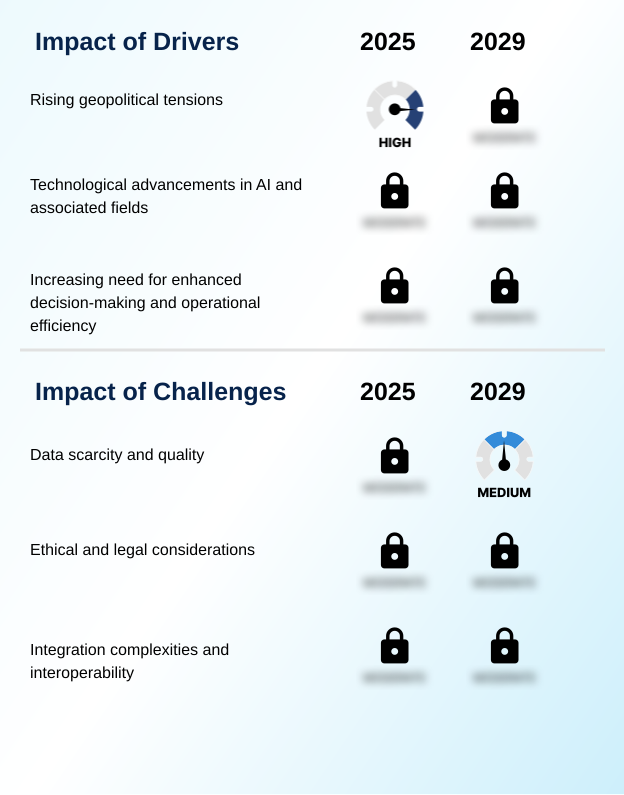
- However, progress is contingent on overcoming challenges related to data quality, system integration, and ethical governance. The market is propelled by the need for enhanced situational awareness and operational efficiency in an increasingly complex and technologically advanced global security environment, where the speed and accuracy of information processing are paramount.
What will be the Size of the AI Analytics In Military Defense Market during the forecast period?
Get Key Insights on Market Forecast (PDF) Get Free Sample
How is the AI Analytics In Military Defense Market Segmented?
The ai analytics in military defense industry research report provides comprehensive data (region-wise segment analysis), with forecasts and estimates in "USD million" for the period 2025-2029, as well as historical data from 2019-2023 for the following segments.
- Platform
- Army
- Navy
- Airforce
- Application
- Surveillance and situational awareness
- Cybersecurity
- Information processing
- Logistics and transportation
- Others
- Technology
- Machine learning
- Computer vision
- Natural language processing
- Context aware computing
- Others
- Geography
- North America
- US
- Canada
- Mexico
- APAC
- China
- India
- Japan
- Europe
- Germany
- France
- UK
- Middle East and Africa
- Saudi Arabia
- UAE
- South Africa
- South America
- Brazil
- Argentina
- Colombia
- Rest of World (ROW)
- North America
By Platform Insights
The army segment is estimated to witness significant growth during the forecast period.
The army segment is advancing with the integration of AI analytics, driven by the need for superior situational awareness and autonomous ground operations.
These systems are transforming intelligence analysis and mission planning by processing real-time data feeds to enhance battlefield decisions.
Core applications include predictive maintenance for land vehicles, which improves asset readiness by over 15%, and the use of unmanned aerial vehicles (UAVs) for advanced reconnaissance and threat detection.
AI-driven decision support tools are crucial in reducing cognitive load on commanders.
This technological shift enables predictive logistics and automated threat assessment, allowing ground forces to leverage real-time data analysis for more effective and adaptable responses to emerging threats, ultimately boosting force readiness improvement.
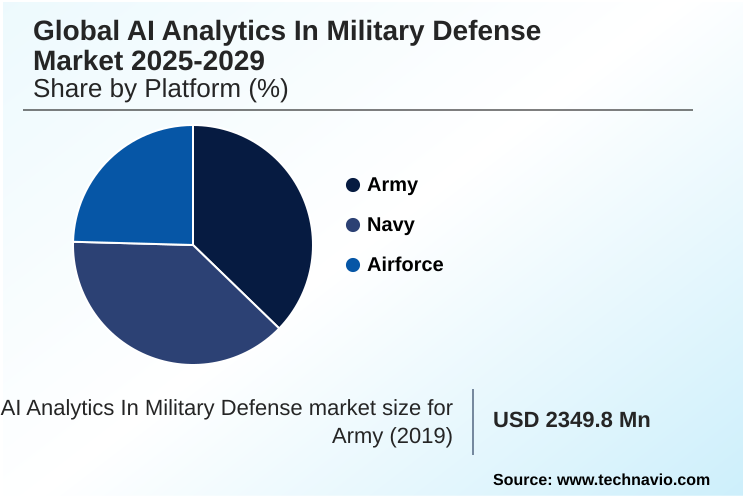
The Army segment was valued at USD 3.56 billion in 2023 and showed a gradual increase during the forecast period.
Regional Analysis
North America is estimated to contribute 40.5% to the growth of the global market during the forecast period.Technavio’s analysts have elaborately explained the regional trends and drivers that shape the market during the forecast period.
See How AI Analytics In Military Defense Market Demand is Rising in North America Get Free Sample
The geographic landscape of the market is led by North America, with significant investments in computer vision and command and control systems.
In this region, battlefield management systems are being upgraded to include AI for cybersecurity, reducing false positive alerts by over 60%. Meanwhile, the APAC region is rapidly advancing, focusing on intelligent surveillance and the development of autonomous swarms.
Key countries in Europe are leveraging natural language processing and signals intelligence for multi-source intelligence fusion, enhancing their combat information systems.
Across these regions, the adoption of counter-uncrewed aircraft systems (C-UAS) is growing, with AI-powered target recognition improving interception success rates by 25%.
This global push toward AI integration is essential for force readiness improvement and is reshaping defense strategies worldwide, with a strong emphasis on geospatial intelligence.
Market Dynamics
Our researchers analyzed the data with 2024 as the base year, along with the key drivers, trends, and challenges. A holistic analysis of drivers will help companies refine their marketing strategies to gain a competitive advantage.
- The scope of AI analytics for military defense is rapidly expanding, driven by the increasing sophistication of machine learning in defense applications. The use of computer vision for target recognition and NLP in military intelligence analysis is becoming standard for processing vast information streams.
- Key applications such as predictive maintenance for military assets and AI in military logistics optimization are delivering tangible efficiency gains, leading to enhanced AI for military fleet readiness. Concurrently, the imperative for ethical AI in autonomous systems is shaping development, ensuring human-AI teaming in combat aligns with legal and moral frameworks.
- The deployment of edge computing for tactical operations and the exploration of quantum computing for defense simulation are pushing technological boundaries. In parallel, cybersecurity AI for threat detection is critical for securing networks against AI based cyber warfare. Ultimately, these technologies converge in AI-powered decision support systems, which are central to modernizing AI in command and control.
- The development of autonomous drone swarm technology for advanced AI for situational awareness and AI for battlefield management showcases the future of integrated warfare. This focus on deep learning for threat prediction can improve force readiness at a rate twice that of legacy systems.
What are the key market drivers leading to the rise in the adoption of AI Analytics In Military Defense Industry?
- The continuous rise in geopolitical tensions worldwide is a primary driver for the increased adoption of AI analytics in military defense.
- Market growth is significantly driven by technological breakthroughs in machine learning and deep learning, which are enhancing multi-domain operations. These advancements enable sophisticated sensor fusion and decision support systems, allowing for superior operational efficiency gains.
- For instance, AI-powered ISR platforms can process intelligence data up to 90% faster than manual methods, directly improving military asset management.
- The imperative for logistics optimization is also a major factor, with AI analytics improving supply chain forecast accuracy by over 30%. Furthermore, persistent geopolitical tensions necessitate robust cyber warfare defense and advanced capabilities for multi-source intelligence fusion.
- This drives investment in AI to achieve resource allocation optimization and maintain a strategic advantage, making cyber threat intelligence a critical component of modern defense.
What are the market trends shaping the AI Analytics In Military Defense Industry?
- The adoption of edge AI and decentralized processing is an important trend. This shift enables real-time data analysis and autonomous operations at the tactical edge, even in disconnected environments.
- Key market trends are centered on deploying intelligence at the tactical edge through edge AI and decentralized processing. This approach reduces latency in autonomous navigation and enhances security by minimizing data transmission, with some systems demonstrating a 60% reduction in decision-making time in disconnected environments.
- The growing emphasis on human-AI teaming and explainable AI (XAI) is critical for building trust and ensuring effective collaboration, leading to a 40% improvement in operator adoption rates for new combat information systems. These developments enable responsible AI development.
- Further, the fusion of AI with quantum computing is being explored for complex combat simulation and digital twin simulation, promising to solve computational problems thousands of times faster than current systems. This convergence of data fusion technologies and AI algorithm validation is paving the way for more resilient, responsive, and secure military capabilities through secure data sharing.
What challenges does the AI Analytics In Military Defense Industry face during its growth?
- The scarcity of high-quality, relevant, and properly labeled data presents a significant challenge to the effective implementation of AI analytics in military defense.
- Significant challenges constrain the market, primarily the complexities of integrating new AI capabilities with legacy systems, where over 70% of platforms require custom tactical data links. This fragmentation hinders a cohesive, network-centric warfare approach.
- Furthermore, AI ethics in defense and the development of robust AI ethics frameworks remain critical hurdles, particularly concerning autonomous weapon systems and the rules of engagement in hybrid warfare defense. Ensuring the security of AI models against adversarial attacks is another concern, as vulnerabilities in information processing or pattern recognition algorithms could be exploited.
- The need for continuous AI model retraining to counter evolving threats in information warfare analytics and cognitive EW places a heavy demand on data and resources, while the looming threat to current encryption standards from quantum computing necessitates urgent development in post-quantum cryptography and electronic warfare (EW) systems.
Exclusive Technavio Analysis on Customer Landscape
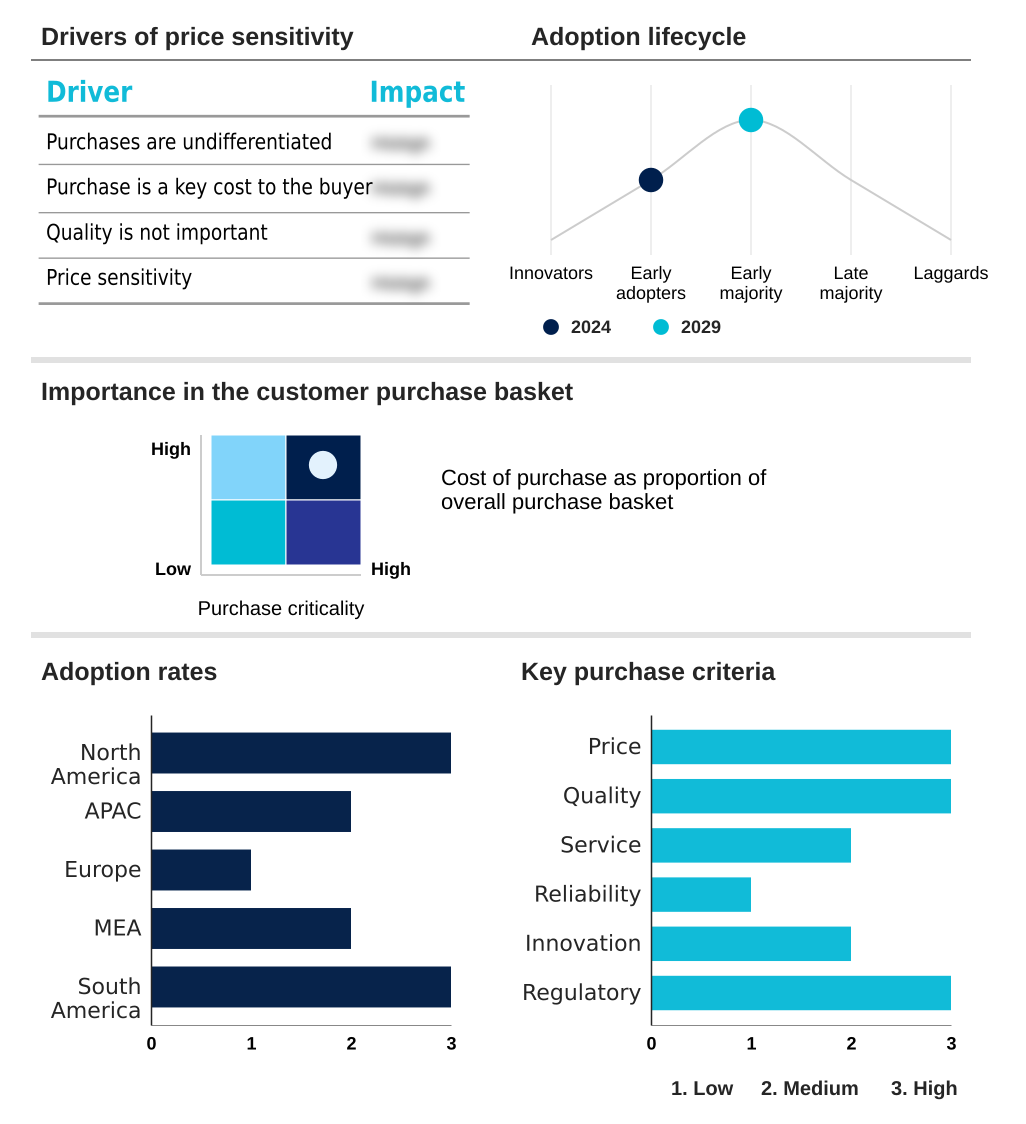
The ai analytics in military defense market forecasting report includes the adoption lifecycle of the market, covering from the innovator’s stage to the laggard’s stage. It focuses on adoption rates in different regions based on penetration. Furthermore, the ai analytics in military defense market report also includes key purchase criteria and drivers of price sensitivity to help companies evaluate and develop their market growth analysis strategies.
Customer Landscape of AI Analytics In Military Defense Industry
Competitive Landscape
Companies are implementing various strategies, such as strategic alliances, ai analytics in military defense market forecast, partnerships, mergers and acquisitions, geographical expansion, and product/service launches, to enhance their presence in the industry.
Airbus SE - Offerings include AI-driven models for simulation, MLOPs, digital twins, and predictive analytics, which enhance cybersecurity, maintenance, and dynamic mission capabilities in defense.
The industry research and growth report includes detailed analyses of the competitive landscape of the market and information about key companies, including:
- Airbus SE
- Anduril Industries Inc.
- BAE Systems Plc
- C3.ai Inc.
- Elbit Systems Ltd.
- General Dynamics Corp.
- HENSOLDT AG
- L3Harris Technologies Inc.
- Leonardo DRS Inc.
- Leonardo S.p.A.
- Lockheed Martin Corp.
- Northrop Grumman Corp.
- Palantir Technologies Inc.
- Rafael Advanced Defense Ltd.
- Rebellion Defense Inc.
- RTX Corp.
- Shield AI
- SparkCognition Inc.
- Thales Group
Qualitative and quantitative analysis of companies has been conducted to help clients understand the wider business environment as well as the strengths and weaknesses of key industry players. Data is qualitatively analyzed to categorize companies as pure play, category-focused, industry-focused, and diversified; it is quantitatively analyzed to categorize companies as dominant, leading, strong, tentative, and weak.
Recent Development and News in Ai analytics in military defense market
- In September 2024, Palantir Technologies Inc. announced a strategic partnership with a major European defense agency to deploy its AI platform for enhancing joint intelligence operations across multiple domains.
- In November 2024, Shield AI launched its next-generation Hivemind pilot, an AI system enabling autonomous maneuvering and collaborative combat for swarms of uncrewed aircraft in contested environments.
- In January 2025, BAE Systems Plc secured a multi-year contract to integrate its AI-driven predictive maintenance solutions across a national naval fleet, aiming to enhance vessel availability and reduce lifecycle costs.
- In April 2025, Thales Group, in collaboration with a consortium of technology firms, initiated a project to develop advanced explainable AI (XAI) frameworks for critical command and control systems to improve operator trust and accountability.
Dive into Technavio’s robust research methodology, blending expert interviews, extensive data synthesis, and validated models for unparalleled AI Analytics In Military Defense Market insights. See full methodology.
| Market Scope | |
|---|---|
| Page number | 313 |
| Base year | 2024 |
| Historic period | 2019-2023 |
| Forecast period | 2025-2029 |
| Growth momentum & CAGR | Accelerate at a CAGR of 12.8% |
| Market growth 2025-2029 | USD 8395.6 million |
| Market structure | Fragmented |
| YoY growth 2024-2025(%) | 12.5% |
| Key countries | US, Canada, Mexico, China, India, Japan, South Korea, Australia, Indonesia, Germany, France, UK, Italy, The Netherlands, Spain, Saudi Arabia, UAE, South Africa, Israel, Turkey, Brazil, Argentina and Colombia |
| Competitive landscape | Leading Companies, Market Positioning of Companies, Competitive Strategies, and Industry Risks |
Research Analyst Overview
- The market is undergoing a profound transformation, driven by advancements in machine learning and deep learning, which underpin next-generation capabilities. The integration of computer vision for target recognition and natural language processing for intelligence analysis is revolutionizing ISR data processing. Core technologies like sensor fusion and data fusion are enhancing situational awareness in multi-domain operations.
- We are seeing a strategic shift toward autonomous systems, including unmanned aerial vehicles (UAVs) and autonomous swarms, managed by sophisticated battlefield management systems. This necessitates robust cyber warfare defense and secure tactical data links. The emphasis on logistics optimization and predictive maintenance, which has reduced critical asset downtime by over 30% in early trials, is improving readiness.
- Concurrently, the push for explainable AI (XAI) and formal AI ethics in defense frameworks is a critical boardroom-level concern, addressing the complexities of decision support systems in mission planning and combat simulation.
- Technologies such as edge AI, decentralized processing, and cognitive EW are moving analytics to the tactical edge, while research into quantum computing and post-quantum cryptography prepares for future threats. This entire ecosystem is designed to enhance threat detection, anomaly detection, and pattern recognition, fundamentally changing how command and control systems operate.
What are the Key Data Covered in this AI Analytics In Military Defense Market Research and Growth Report?
-
What is the expected growth of the AI Analytics In Military Defense Market between 2025 and 2029?
-
USD 8.40 billion, at a CAGR of 12.8%
-
-
What segmentation does the market report cover?
-
The report is segmented by Platform (Army, Navy, Airforce), Application (Surveillance and situational awareness, Cybersecurity, Information processing, Logistics and transportation, Others), Technology (Machine learning, Computer vision, Natural language processing, Context aware computing, Others) and Geography (North America, APAC, Europe, Middle East and Africa, South America)
-
-
Which regions are analyzed in the report?
-
North America, APAC, Europe, Middle East and Africa and South America
-
-
What are the key growth drivers and market challenges?
-
Rising geopolitical tensions, Data scarcity and quality
-
-
Who are the major players in the AI Analytics In Military Defense Market?
-
Airbus SE, Anduril Industries Inc., BAE Systems Plc, C3.ai Inc., Elbit Systems Ltd., General Dynamics Corp., HENSOLDT AG, L3Harris Technologies Inc., Leonardo DRS Inc., Leonardo S.p.A., Lockheed Martin Corp., Northrop Grumman Corp., Palantir Technologies Inc., Rafael Advanced Defense Ltd., Rebellion Defense Inc., RTX Corp., Shield AI, SparkCognition Inc. and Thales Group
-
Market Research Insights
- The market is shaped by the drive for operational superiority, where AI-driven decision support and human-AI teaming are becoming standard. These integrations are delivering measurable outcomes; AI-powered ISR platforms can reduce image analysis time by up to 40%, while predictive logistics systems have been shown to improve force readiness by over 15%.
- This focus on real-time data analysis and military asset management enhances capabilities in network-centric warfare. The adoption of intelligent surveillance and automated threat assessment technologies also contributes to cognitive load reduction for operators, allowing for faster and more accurate responses in high-pressure scenarios. As a result, defense organizations are achieving significant operational efficiency gains, underscoring the technology's transformative impact.
We can help! Our analysts can customize this ai analytics in military defense market research report to meet your requirements.
 RIA -
RIA - 
