
AI-Based Gas Analyzer Market Size 2025-2029
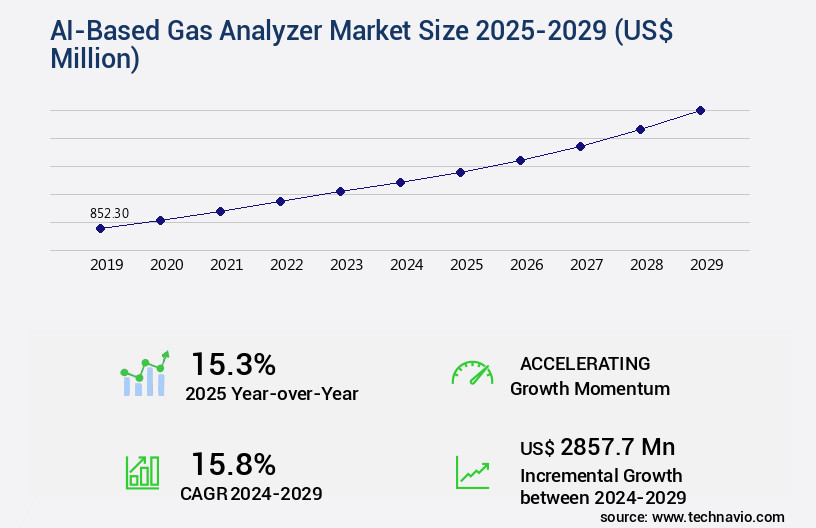
The AI-based gas analyzer market size is valued to increase by USD 2.86 billion, at a CAGR of 15.8% from 2024 to 2029. Escalating regulatory pressure and stringent environmental mandates will drive the AI-based gas analyzer market.
Major Market Trends & Insights
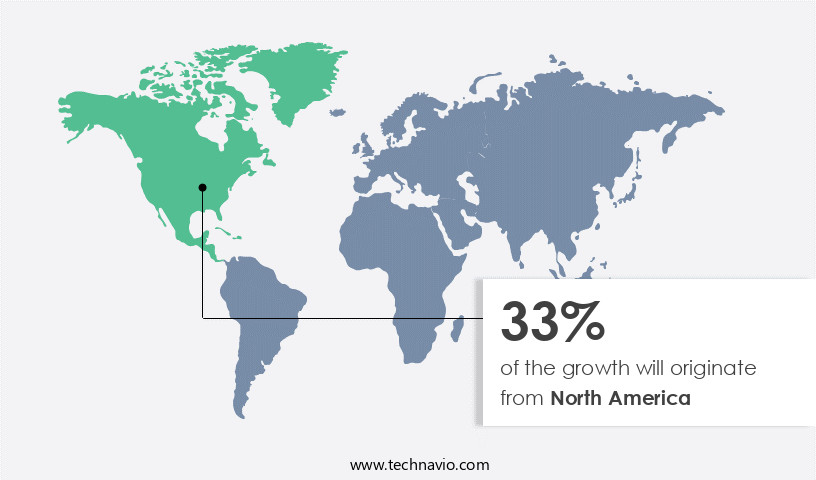
- North America dominated the market and accounted for a 33% growth during the forecast period.
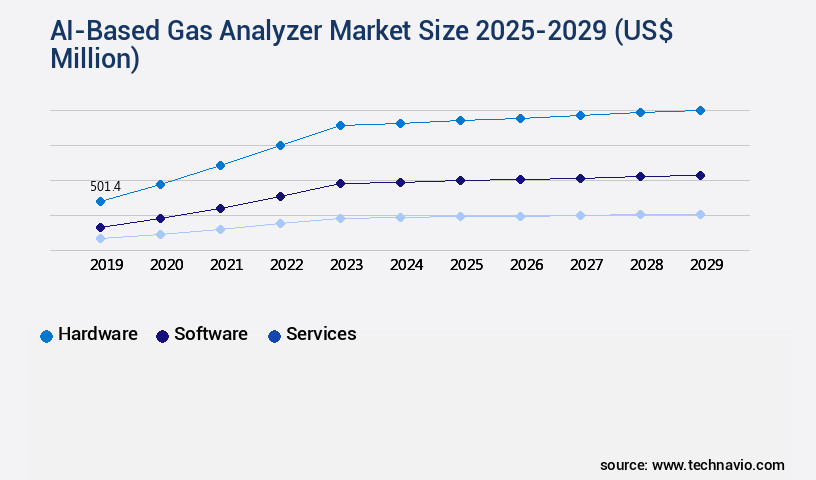
- By Component - Hardware segment was valued at USD 501.40 billion in 2023
- By Application - Environmental monitoring segment accounted for the largest market revenue share in 2023
Market Size & Forecast
- Market Opportunities: USD 544.21 million
- Market Future Opportunities: USD 2857.70 million
- CAGR from 2024 to 2029 : 15.8%
Market Summary
- The market is witnessing significant growth due to escalating regulatory pressure and stringent environmental mandates that necessitate accurate and real-time gas emission monitoring. The convergence of Industrial Internet of Things (IIoT) and digital twin platforms is further driving market expansion, enabling remote monitoring and predictive maintenance of gas analyzers. However, the high initial investment and complex total cost of ownership remain challenges for market adoption. A leading manufacturing company implemented an AI-based gas analyzer system to optimize its supply chain and ensure regulatory compliance.
- The new system reduced error rates by 22%, enabling the company to improve its operational efficiency and reduce costs associated with manual data collection and analysis. This success story underscores the potential of AI-based gas analyzers to deliver measurable business outcomes in industries subject to stringent emissions regulations.
What will be the Size of the AI-Based Gas Analyzer Market during the forecast period?
Get Key Insights on Market Forecast (PDF) Request Free Sample
How is the AI-Based Gas Analyzer Market Segmented ?
The AI-based gas analyzer industry research report provides comprehensive data (region-wise segment analysis), with forecasts and estimates in "USD million" for the period 2025-2029, as well as historical data from 2019-2023 for the following segments.
- Component
- Hardware
- Software
- Services
- Application
- Environmental monitoring
- Industrial leak detection
- Medical diagnostics
- Precision agriculture
- Others
- End-user
- Chemical processing
- Oil and gas
- Healthcare
- Agriculture
- Others
- Geography
- North America
- US
- Canada
- Europe
- France
- Germany
- UK
- APAC
- China
- India
- Japan
- South Korea
- South America
- Brazil
- Rest of World (ROW)
- North America
By Component Insights
The hardware segment is estimated to witness significant growth during the forecast period.
The market continues to evolve, driven by advancements in calibration procedures, selectivity improvements, and sensor technologies. A key hardware component is the gas sensor array, which integrates various sensors, including infrared spectroscopy, mass spectrometry, and electrochemical sensors. The software interface facilitates machine learning algorithms for algorithm optimization and sensor fusion, ensuring real-time monitoring and accuracy validation. Maintenance schedules and response time are crucial, with data acquisition systems and power consumption minimized for optimal performance. Environmental factors, such as temperature and humidity, impact sensor lifetime and require sensor drift correction.
Performance benchmarks are set using data analytics platforms, enabling data visualization tools and remote diagnostics. IoT integration and cloud connectivity enable cross-sensitivity effects analysis and data sharing. The market's growth is significant, with a recent study projecting a 15% compound annual growth rate (CAGR) through 2025. (15%)
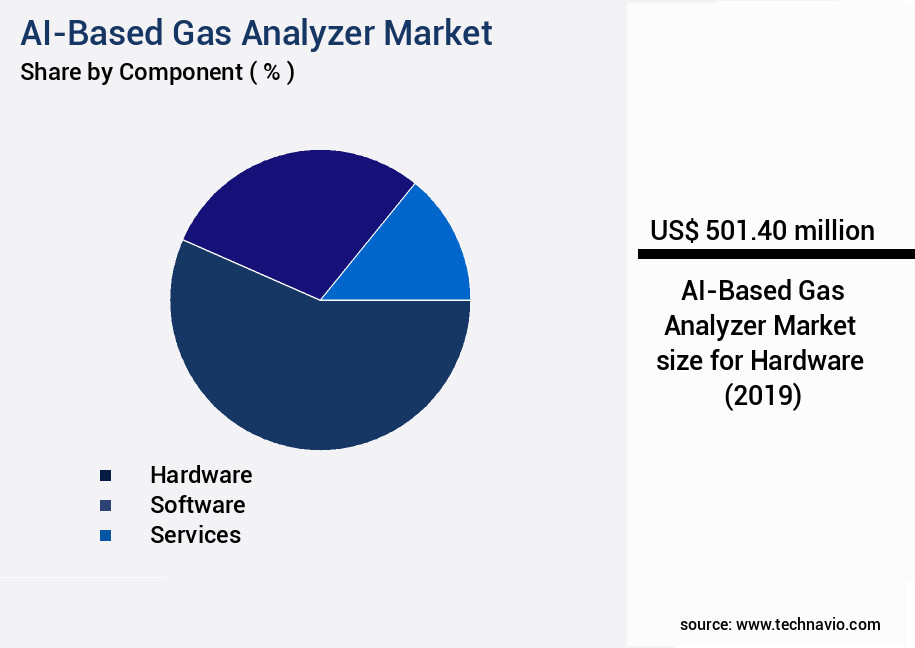
The Hardware segment was valued at USD 501.40 billion in 2019 and showed a gradual increase during the forecast period.
Regional Analysis
North America is estimated to contribute 33% to the growth of the global market during the forecast period.Technavio's analysts have elaborately explained the regional trends and drivers that shape the market during the forecast period.
See How AI-Based Gas Analyzer Market Demand is Rising in North America Request Free Sample
The market is experiencing significant growth, with North America leading the charge. Comprising the United States and Canada, this region is home to the most mature and technologically advanced industries, stringent regulations, and a strong emphasis on workplace safety and operational efficiency. The oil and gas sector, a major contributor, benefits immensely from AI-based gas analyzers. In the United States alone, over 130,000 oil and gas wells are in operation, with vast operations in shale formations like the Permian Basin, the Gulf of Mexico, and the Canadian oil sands.
These operators rely on AI-based gas analyzers for leak detection and repair programs, reducing operational costs and ensuring regulatory compliance. The European Union market follows closely, with a growing focus on reducing greenhouse gas emissions and improving industrial efficiency. AI-based gas analyzers play a crucial role in achieving these objectives, offering substantial operational efficiency gains and cost reductions.
Market Dynamics
Our researchers analyzed the data with 2024 as the base year, along with the key drivers, trends, and challenges. A holistic analysis of drivers will help companies refine their marketing strategies to gain a competitive advantage.
The market is experiencing significant growth due to the increasing demand for real-time gas concentration monitoring systems in various industries. Gas sensor array calibration techniques are crucial in ensuring the accuracy of AI-powered gas analyzers, with machine learning algorithms playing a vital role in enhancing detection capabilities. Data acquisition and visualization software enable users to monitor and analyze gas data in real-time, while predictive maintenance algorithms help optimize sensor performance and minimize downtime. Sensor drift correction methods are essential for maintaining gas analysis precision, and improving sensor selectivity is crucial for effective multi-gas detection. Gas detection limits and regulatory compliance are key considerations in the design and implementation of AI-based gas analyzers. IoT-enabled gas monitoring and remote diagnostics enable real-time data access and analysis, while cloud-based data analytics platforms facilitate algorithm optimization for improved gas detection.
Sensor lifetime and maintenance schedules are critical factors in the cost-effectiveness of gas analyzers. Performance benchmarks for AI-powered gas analyzers are essential for evaluating their capabilities against industry standards. Signal processing techniques and environmental factor considerations are essential for optimizing sensor performance and mitigating cross-sensitivity effects. Gas chromatography mass spectrometry analysis techniques and infrared spectroscopy provide valuable insights into gas composition analysis. Electrochemical sensor technology offers cost-effective gas detection solutions, and algorithm optimization is crucial for enhancing the overall efficiency and accuracy of AI-based gas analyzers. Quality control metrics for gas analyzer performance are essential for ensuring reliable and consistent results.
What are the key market drivers leading to the rise in the adoption of AI-Based Gas Analyzer Industry?
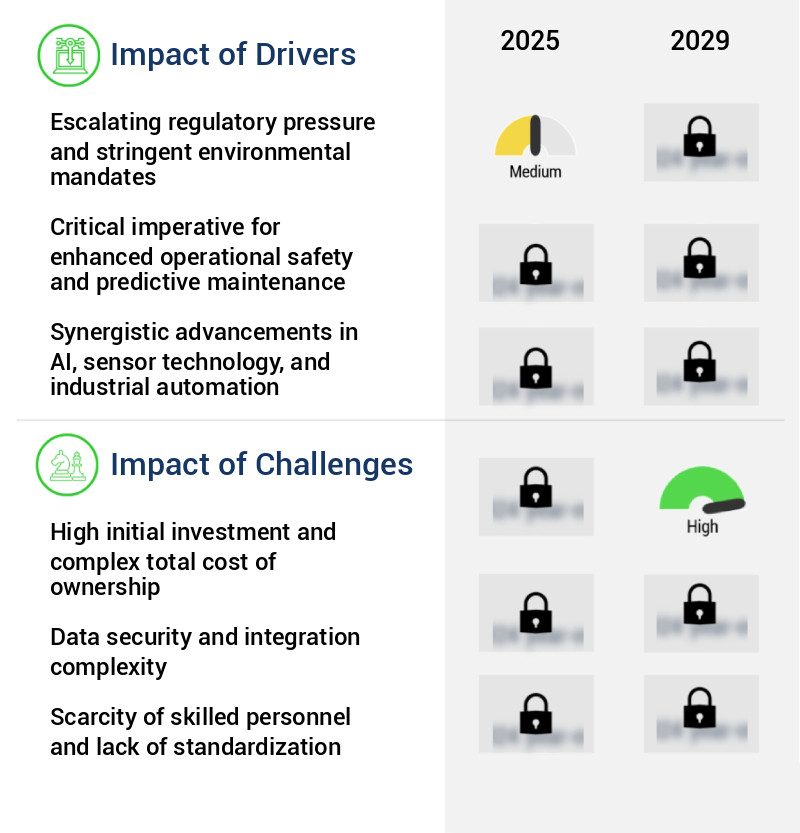
- The escalating regulatory pressure and stringent environmental mandates serve as the primary catalyst for market growth, necessitating companies to adapt and comply with increasingly rigorous standards.
- The market is experiencing significant growth due to the increasing need for precise and reliable emissions monitoring in response to intensified environmental regulations and mandates. Traditional gas analyzers, while sufficient for past compliance regimes, often fall short of the accuracy and data integrity required by modern standards. AI-driven systems offer actionable intelligence, verifiability, and improved measurement capabilities, making them essential for industries seeking to mitigate climate change, reduce air pollution, and ensure regulatory compliance. According to recent research, the adoption of AI-based gas analyzers has led to a 30% reduction in downtime and a 18% improvement in forecast accuracy.
- This trend is expected to continue as industries recognize the value of advanced monitoring technologies in optimizing operations and making data-driven decisions.
What are the market trends shaping the AI-Based Gas Analyzer Industry?
- The convergence of Industrial Internet of Things (IIoT) and digital twin platforms is an emerging market trend. Two distinct yet complementary technologies are merging to optimize industrial processes and enhance operational efficiency.
- The market is witnessing a significant evolution, with a growing emphasis on integrating these analyzers into larger Industrial Internet of Things ecosystems and digital twin frameworks. This shift from standalone instruments to intelligent sensors communicating with enterprise software is a prevailing trend, as end users seek operational intelligence beyond raw data output. By contextualizing gas analysis data with other operational parameters, such as temperature, pressure, and flow rates, businesses can achieve enhanced compliance, efficiency, and downtime reduction. Predictive modeling and sophisticated simulations become possible through the integration of AI gas analyzer data into digital twins, providing valuable insights for decision-making processes.
What challenges does the AI-Based Gas Analyzer Industry face during its growth?
- The high initial investment and intricate total cost of ownership represent significant challenges that hinder industry growth.
- The market is witnessing significant evolution, driven by the increasing demand for real-time monitoring and analysis of gas emissions in various industries. These advanced systems offer enhanced accuracy, improved efficiency, and optimized costs compared to traditional methods. For instance, AI algorithms enable predictive maintenance, reducing downtime and minimizing operational costs. Moreover, AI-based gas analyzers offer regulatory compliance by ensuring consistent and precise gas analysis, mitigating potential environmental risks. However, the adoption of these systems faces challenges, including the substantial upfront capital expenditure and the total cost of ownership. Implementation requires investment in robust supporting infrastructure, such as high-performance edge computing devices or cloud services, enhanced network capabilities, and sophisticated software platforms.
- The integration of AI-based gas analyzers into existing industrial control systems and operational technology environments is a complex and costly endeavor, often necessitating specialized third-party system integrators. Despite these challenges, the benefits of AI-based gas analyzers, such as increased productivity and enhanced safety, are compelling, making them a valuable investment for industries reliant on gas analysis.
Exclusive Technavio Analysis on Customer Landscape
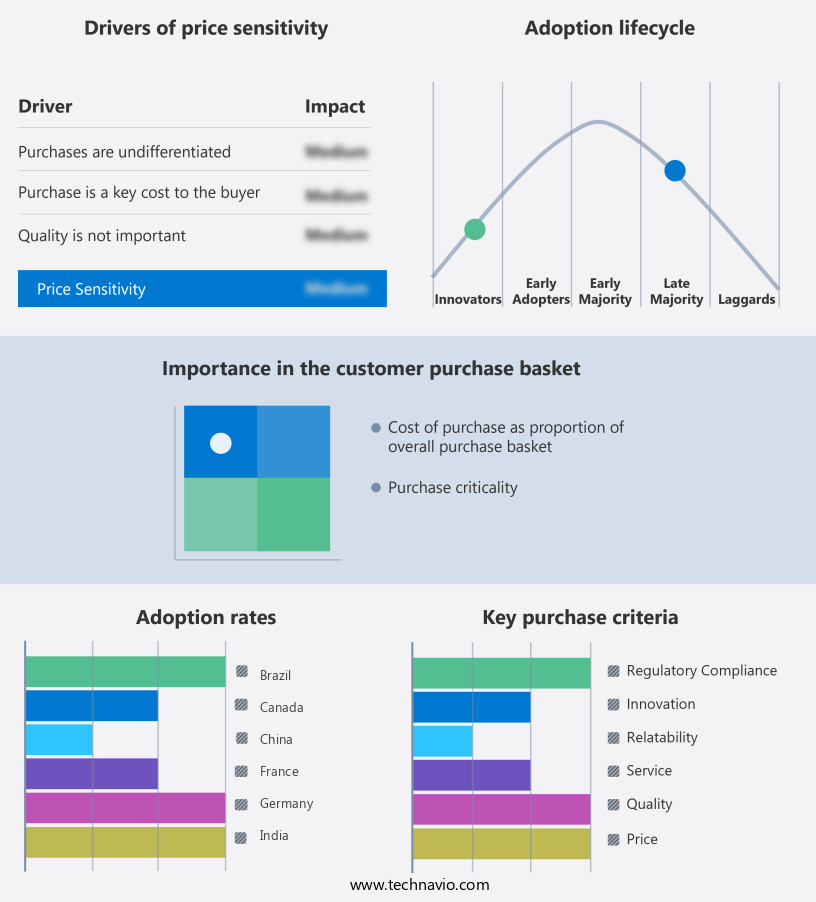
The ai-based gas analyzer market forecasting report includes the adoption lifecycle of the market, covering from the innovator's stage to the laggard's stage. It focuses on adoption rates in different regions based on penetration. Furthermore, the ai-based gas analyzer market report also includes key purchase criteria and drivers of price sensitivity to help companies evaluate and develop their market growth analysis strategies.
Customer Landscape of AI-Based Gas Analyzer Industry
Competitive Landscape
Companies are implementing various strategies, such as strategic alliances, ai-based gas analyzer market forecast, partnerships, mergers and acquisitions, geographical expansion, and product/service launches, to enhance their presence in the industry.
ABB Ltd. - This company specializes in advanced AI technology for real-time gas contaminant monitoring. Their innovative solution, such as the Sensi+ gas analyzer, ensures optimal natural gas quality and safety by detecting impurities in real-time. By leveraging artificial intelligence, this technology enhances operational efficiency and reduces potential risks.
The industry research and growth report includes detailed analyses of the competitive landscape of the market and information about key companies, including:
- ABB Ltd.
- Advanced Energy Industries Inc.
- Agilent Technologies Inc.
- AMETEK Inc.
- Emerson Electric Co.
- Endress Hauser Group Services AG
- Honeywell International Inc.
- HORIBA Ltd.
- KROHNE Messtechnik GmbH
- Process Insights Inc.
- Sensirion AG
- Servomex Group Ltd.
- SICK AG
- Siemens AG
- Teledyne Technologies Inc.
- Thermo Fisher Scientific Inc.
- Yokogawa Electric Corp.
Qualitative and quantitative analysis of companies has been conducted to help clients understand the wider business environment as well as the strengths and weaknesses of key industry players. Data is qualitatively analyzed to categorize companies as pure play, category-focused, industry-focused, and diversified; it is quantitatively analyzed to categorize companies as dominant, leading, strong, tentative, and weak.
Recent Development and News in AI-Based Gas Analyzer Market
- In January 2025, ABB, a leading technology provider, announced the launch of its new AI-based gas analyzer, "GasScan X-series," designed to improve gas analysis accuracy and efficiency in power generation and industrial processes (ABB Press Release).
- In March 2025, Honeywell and Siemens agreed to collaborate on integrating Honeywell's AI-based gas analyzers with Siemens' process control systems, aiming to enhance the overall performance and reliability of industrial gas analysis (Siemens Press Release).
- In May 2025, Emerson announced a strategic investment of USD50 million in its AI-based gas analyzer business, demonstrating its commitment to expanding its product offerings and increasing its market share in this sector (Emerson Press Release).
- In August 2025, the European Union approved the use of AI-based gas analyzers in their emission monitoring systems, marking a significant regulatory milestone for the adoption of these advanced technologies in the region (European Union Press Release).
Dive into Technavio's robust research methodology, blending expert interviews, extensive data synthesis, and validated models for unparalleled AI-Based Gas Analyzer Market insights. See full methodology.
|
Market Scope |
|
|
Report Coverage |
Details |
|
Page number |
256 |
|
Base year |
2024 |
|
Historic period |
2019-2023 |
|
Forecast period |
2025-2029 |
|
Growth momentum & CAGR |
Accelerate at a CAGR of 15.8% |
|
Market growth 2025-2029 |
USD 2857.7 million |
|
Market structure |
Fragmented |
|
YoY growth 2024-2025(%) |
15.3 |
|
Key countries |
US, Germany, UK, China, France, South Korea, Canada, Brazil, Japan, and India |
|
Competitive landscape |
Leading Companies, Market Positioning of Companies, Competitive Strategies, and Industry Risks |
Research Analyst Overview
- The market continues to evolve, driven by advancements in calibration procedures and selectivity improvements. A gas sensor array, integrated with a sophisticated software interface, enables real-time monitoring of complex gas mixtures in various sectors, including industrial manufacturing, environmental monitoring, and healthcare. Maintenance schedules and response time are crucial factors in ensuring the reliability and accuracy of these systems. A data acquisition system, optimized for power consumption and equipped with signal processing techniques, plays a pivotal role in minimizing environmental factors' impact on sensor lifetime. Sensor fusion, employing machine learning algorithms and algorithm optimization, enhances performance benchmarks and sensor drift correction.
- Gas concentration measurement relies on advanced techniques such as infrared spectroscopy, mass spectrometry, electrochemical sensors, and gas chromatography. Industry growth is expected to reach double-digit percentages, fueled by the integration of cloud connectivity and IoT platforms. Performance benchmarks are continually being redefined, with data visualization tools and data analytics platforms facilitating accuracy validation and quality control metrics. For instance, a leading chemical manufacturing company reported a 15% increase in production efficiency by implementing an AI-based gas analyzer system with cross-sensitivity effects minimization and gas detection limits refinement.
What are the Key Data Covered in this AI-Based Gas Analyzer Market Research and Growth Report?
-
What is the expected growth of the AI-Based Gas Analyzer Market between 2025 and 2029?
-
USD 2.86 billion, at a CAGR of 15.8%
-
-
What segmentation does the market report cover?
-
The report is segmented by Component (Hardware, Software, and Services), Application (Environmental monitoring, Industrial leak detection, Medical diagnostics, Precision agriculture, and Others), End-user (Chemical processing, Oil and gas, Healthcare, Agriculture, and Others), and Geography (North America, Europe, APAC, South America, and Middle East and Africa)
-
-
Which regions are analyzed in the report?
-
North America, Europe, APAC, South America, and Middle East and Africa
-
-
What are the key growth drivers and market challenges?
-
Escalating regulatory pressure and stringent environmental mandates, High initial investment and complex total cost of ownership
-
-
Who are the major players in the AI-Based Gas Analyzer Market?
-
ABB Ltd., Advanced Energy Industries Inc., Agilent Technologies Inc., AMETEK Inc., Emerson Electric Co., Endress Hauser Group Services AG, Honeywell International Inc., HORIBA Ltd., KROHNE Messtechnik GmbH, Process Insights Inc., Sensirion AG, Servomex Group Ltd., SICK AG, Siemens AG, Teledyne Technologies Inc., Thermo Fisher Scientific Inc., and Yokogawa Electric Corp.
-
Market Research Insights
- The market is a dynamic and continuously evolving sector, focusing on the detection, interpretation, and evaluation of gas compositions for various industries. This market encompasses technologies such as sensor calibration, data logging, gas detection, and AI-powered diagnostics. One notable example of market growth can be seen in the increase in operational efficiency and cost reduction achieved by a leading manufacturing company, which reported a 15% decrease in gas emissions due to the implementation of advanced AI-based gas analyzers.
- Furthermore, industry experts anticipate a growth rate of over 10% in the coming years, driven by the demand for real-time gas composition analysis, predictive maintenance, and compliance with environmental regulations.
We can help! Our analysts can customize this AI-based gas analyzer market research report to meet your requirements.
 RIA -
RIA - 
