
AI Edge Infrastructure Market Size 2026-2030
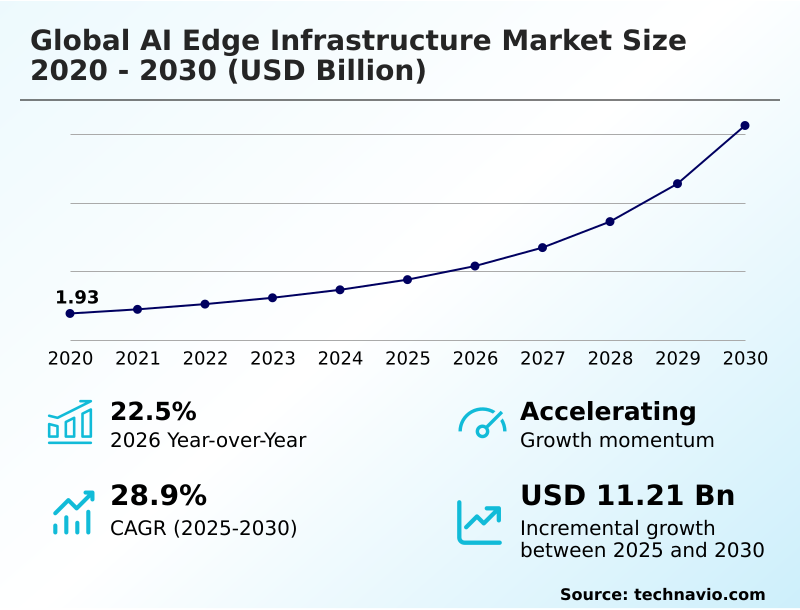
The AI Edge Infrastructure Market size was valued at USD 4.39 billion in 2025, growing at a CAGR of 28.9% during the forecast period 2026-2030.
Major Market Trends & Insights
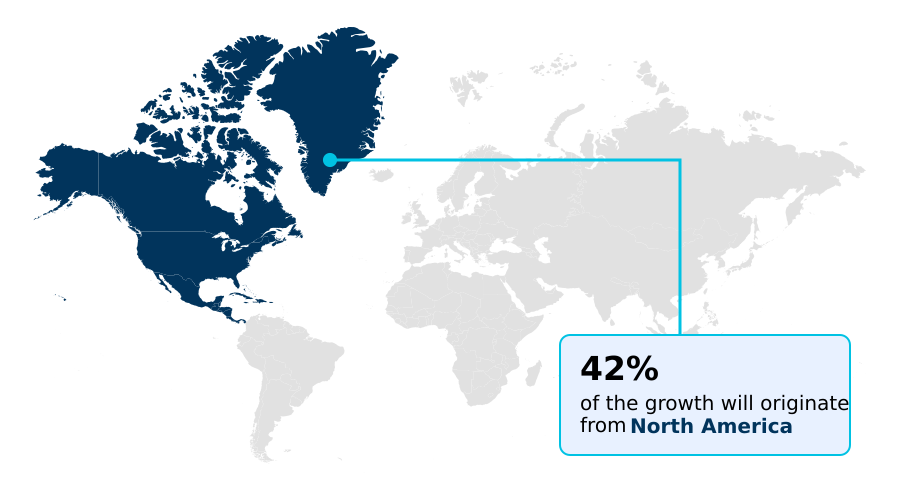
- North America dominated the market and accounted for a 42.5% growth during the forecast period.
- By Component - Hardware segment was valued at USD 1.49 billion in 2024
- By Deployment - Cloud segment accounted for the largest market revenue share in 2024
Market Size & Forecast
- Historic Market Opportunities 2020-2024: USD 13.68 billion
- Market Future Opportunities 2025-2030: USD 11.21 billion
- CAGR from 2025 to 2030 : 28.9%
Market Summary
- The AI edge infrastructure market is defined by the strategic migration of AI workloads from centralized data centers to the network periphery, a shift that has enabled some manufacturers to reduce production line defect detection times by up to 40%.
- This transition is primarily driven by the need for instantaneous, low-latency decision-making in applications like autonomous vehicles and industrial robotics, where a delay of milliseconds can be critical. For example, a logistics firm can leverage edge computing to optimize delivery routes in real time, cutting fuel consumption by 15% by processing traffic data locally.
- However, the market faces a significant challenge in the integration complexity with existing legacy operational technology systems, which can slow down adoption. Despite this, the ability of AI edge infrastructure to reduce data transmission to a central cloud by over 90% presents a compelling case for cost savings and operational efficiency, ensuring continued investment.
What will be the Size of the AI Edge Infrastructure Market during the forecast period?
Get Key Insights on Market Forecast (PDF) Request Free Sample
How is the AI Edge Infrastructure Market Segmented?
The ai edge infrastructure industry research report provides comprehensive data (region-wise segment analysis), with forecasts and analysis for the period 2026-2030, as well as historical data from 2020-2024 for the following segments.
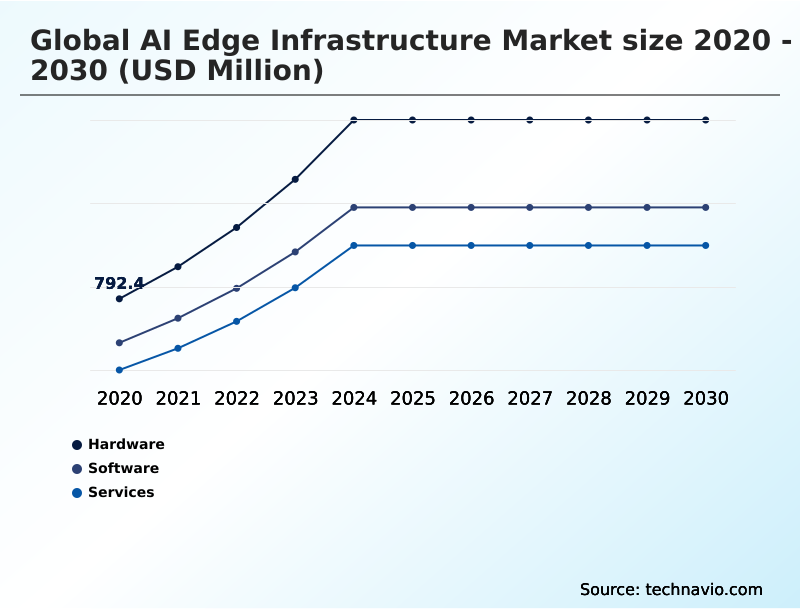
- Component
- Hardware
- Software
- Services
- Deployment
- Cloud
- On-premises
- Hybrid
- End-user
- Manufacturing
- Telecommunications
- Healthcare
- Automotive
- Others
- Geography
- North America
- US
- Canada
- Mexico
- APAC
- China
- Japan
- India
- Europe
- Germany
- UK
- France
- Middle East and Africa
- Saudi Arabia
- UAE
- South Africa
- South America
- Brazil
- Argentina
- Rest of World (ROW)
- North America
How is the AI Edge Infrastructure Market Segmented by Component?
The hardware segment is estimated to witness significant growth during the forecast period.
The hardware segment provides the foundational silicon for the AI edge infrastructure market, with ruggedized components showing up to 30% lower failure rates in harsh industrial environments than standard server hardware.
This category includes specialized components like neural processing units and AI inference accelerators designed for power-efficient, parallel processing at the data source.
These advancements in edge computing technologies allow for the integration of on-device intelligence into compact devices, improving real-time data processing speeds by over 50% compared to general-purpose CPUs. This shift enables autonomous decision-making in applications where latency is critical.
The evolution of hardware focuses on maximizing compute density and thermal management to support sophisticated machine learning models, turning simple sensors into intelligent nodes for low-latency decision-making and predictive maintenance.
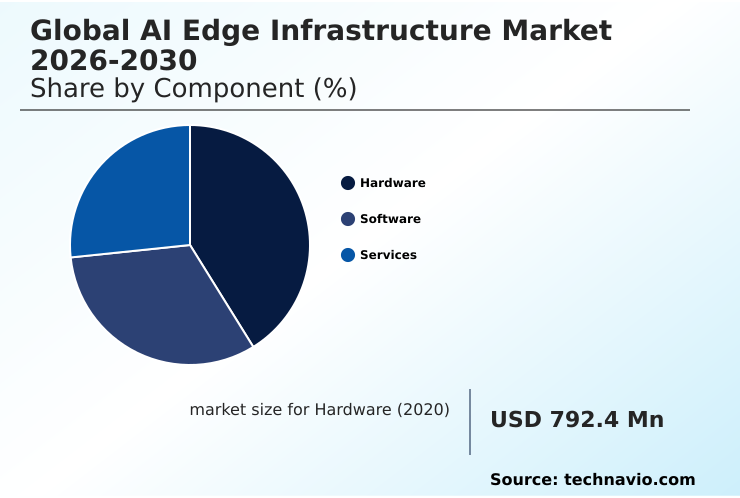
The Hardware segment was valued at USD 1.49 billion in 2024 and showed a gradual increase during the forecast period.
How demand for the AI Edge Infrastructure market is rising in the leading region?
North America is estimated to contribute 42.5% to the growth of the global market during the forecast period.Technavio’s analysts have elaborately explained the regional trends and drivers that shape the market during the forecast period.
See How AI Edge Infrastructure Market demand is rising in North America Request Free Sample
North America is projected to account for 42.5% of the market's incremental growth, establishing its dominance in the AI edge infrastructure landscape, with the US market alone valued significantly higher than other individual countries.
This leadership is fueled by a robust ecosystem of technology conglomerates and semiconductor firms focusing on advanced edge computing technologies.
In contrast, the APAC region, contributing 28.4% of the growth, is driven by large-scale smart city projects and a booming manufacturing sector in countries like China and Japan that prioritize AI inference.
Adoption in North America is often driven by sophisticated applications in healthcare and autonomous systems, whereas APAC's adoption is characterized by high-volume electronics manufacturing and telecommunications upgrades, including widespread 5G technology integration.
This regional divergence requires vendors to tailor their on-device intelligence solutions and go-to-market strategies accordingly.
What are the key Drivers, Trends, and Challenges in the AI Edge Infrastructure Market?
Our researchers analyzed the data with 2025 as the base year, along with the key drivers, trends, and challenges. A holistic analysis of drivers will help companies refine their marketing strategies to gain a competitive advantage.
- Enterprises are increasingly exploring AI edge infrastructure for manufacturing to enhance operational efficiency, with some achieving a 20% reduction in equipment downtime through predictive maintenance. The primary benefits of AI on edge devices include significantly reduced latency and improved data privacy, as sensitive information is processed locally instead of being sent to the cloud.
- When considering the cost of implementing AI edge infrastructure, organizations must account for initial hardware investments in specialized silicon and ongoing operational expenses, which can be 15% higher than traditional IT setups in remote locations. A major hurdle involves addressing security concerns in AI edge computing, as distributed nodes can be more vulnerable to physical tampering than centralized data centers.
- Successfully deploying AI models at the edge requires careful planning around model optimization and workload orchestration to ensure reliable performance on resource-constrained devices. The process involves more than just technology; it's about re-architecting workflows for a decentralized environment to unlock real-time insights and autonomous capabilities.
What are the key market drivers leading to the rise in the adoption of AI Edge Infrastructure Industry?
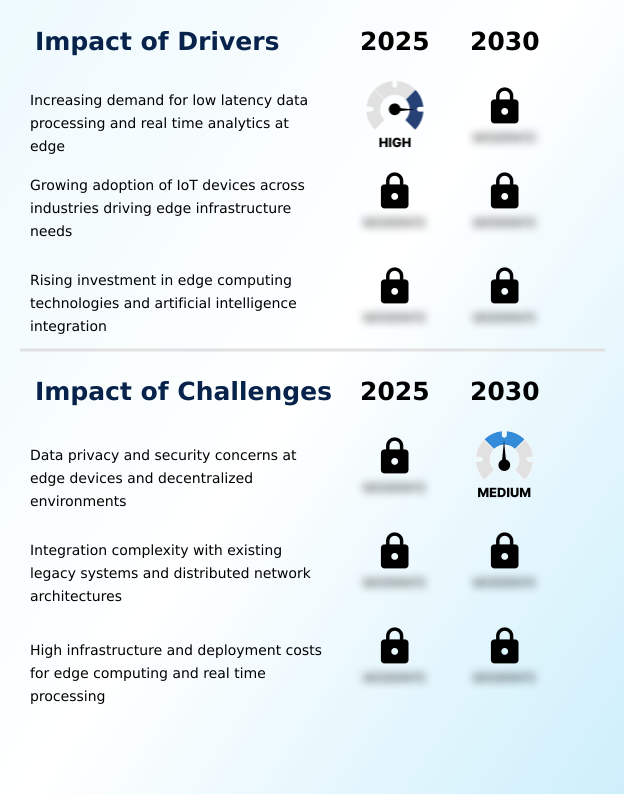
- The increasing demand for low-latency data processing and real-time analytics at the network edge is a primary driver fueling market growth.
- The widespread adoption of IoT-enabled devices across industries is a primary driver for the AI edge infrastructure market, as it generates massive data volumes that are impractical to process centrally.
- Processing sensor data locally can reduce the amount of information transmitted to the core cloud by over 90%, significantly cutting bandwidth costs and energy consumption.
- For instance, in smart agriculture, edge nodes enable automated irrigation systems to respond instantly to soil moisture data in fields with poor connectivity.
- This creates a symbiotic relationship where IoT growth necessitates more powerful edge computing technologies, and advanced edge capabilities enable more ambitious IoT applications.
- This trend toward decentralized environments is essential for managing the sheer scale of modern industrial and urban data streams, making low-latency decision-making a baseline requirement.
What are the market trends shaping the AI Edge Infrastructure Industry?
- The strategic deployment of edge data centers in closer proximity to end-users is an important market trend. This architectural shift is driven by the demand for faster data processing and reduced latency.
- The growing integration of AI with edge computing is enabling autonomous decision-making, transforming machines from passive data collectors to intelligent agents. This trend allows industrial robots, a key type of IoT-enabled devices, to adjust movements in real-time, improving worker safety and increasing assembly line precision by up to 25% compared to non-AI systems.
- In smart grids, edge-based models can detect faults and reroute power autonomously, reducing outage durations by over 60%. This shift is powered by sophisticated and distributed cloud architectures optimized for low power consumption and complex reasoning within a small memory footprint.
- As generative AI moves to the edge, it is creating opportunities for highly personalized and private assistants that provide instantaneous responses, reducing reliance on constant network connectivity for real-time data processing.
What challenges does the AI Edge Infrastructure Industry face during its growth?
- Data privacy and security concerns associated with edge devices and decentralized environments present a significant challenge to industry growth.
- Significant security concerns in AI edge computing present a fundamental challenge, as decentralized environments increase the physical and digital attack surface. Unlike secure data centers, edge nodes in public spaces are more vulnerable to tampering, with risks being up to three times higher.
- Furthermore, the heterogeneous nature of edge devices complicates the uniform application of security patches, and many small-scale devices lack the power for robust cybersecurity software, which can degrade their primary function performance by 20%. This creates a difficult trade-off between performance and protection. The lack of standardized audit trails across millions of nodes also complicates compliance with data residency laws.
- Overcoming these hurdles requires embedding security into the hardware and developing lightweight, effective security protocols for distributed systems.
Exclusive Technavio Analysis on Customer Landscape
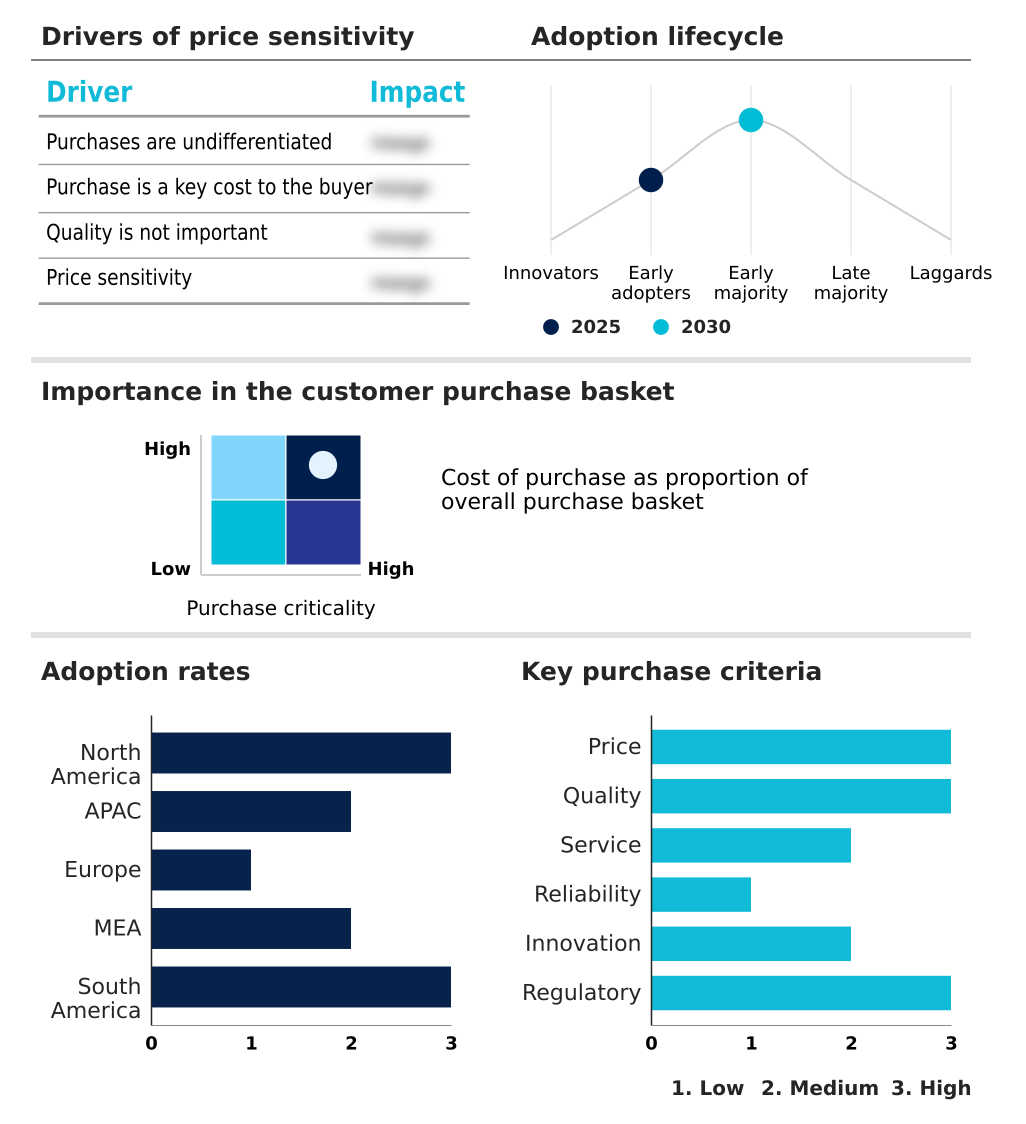
The ai edge infrastructure market forecasting report includes the adoption lifecycle of the market, covering from the innovator’s stage to the laggard’s stage. It focuses on adoption rates in different regions based on penetration. Furthermore, the ai edge infrastructure market report also includes key purchase criteria and drivers of price sensitivity to help companies evaluate and develop their market growth analysis strategies.
Customer Landscape of AI Edge Infrastructure Industry
Competitive Landscape
Companies are implementing various strategies, such as strategic alliances, ai edge infrastructure market forecast, partnerships, mergers and acquisitions, geographical expansion, and product/service launches, to enhance their presence in the industry.
Advantech Co. Ltd. - Key offerings include vertically integrated platforms with specialized AI chips and software frameworks that enable high-performance, low-latency AI inference for demanding edge workloads.
The industry research and growth report includes detailed analyses of the competitive landscape of the market and information about key companies, including:
- Advantech Co. Ltd.
- Advanced Micro Devices Inc.
- Amazon Web Services Inc.
- Cisco Systems Inc.
- ClearBlade Inc.
- Dell Technologies Inc.
- Google LLC
- Hewlett Packard Enterprise Co.
- Huawei Technologies Co. Ltd.
- IBM Corp.
- Intel Corp.
- Lenovo Group Ltd.
- Microsoft Corp.
- NVIDIA Corp.
- Oracle Corp.
- Qualcomm Inc.
- Schneider Electric SE
- Siemens AG
- Super Micro Computer Inc.
- ZEDEDA Inc.
Qualitative and quantitative analysis of companies has been conducted to help clients understand the wider business environment as well as the strengths and weaknesses of key industry players. Data is qualitatively analyzed to categorize companies as pure play, category-focused, industry-focused, and diversified; it is quantitatively analyzed to categorize companies as dominant, leading, strong, tentative, and weak.
Market Intelligence Radar: High-Impact Developments & Growth Signals
- In the Application Software industry, the increasing adoption of cloud-native technologies like containerization is simplifying the deployment and management of applications, which directly impacts the AI edge infrastructure market by enabling more seamless workload orchestration across distributed and hybrid network architectures.
- Stricter data privacy regulations, such as GDPR, are compelling enterprises to process sensitive data locally, fueling demand for AI edge infrastructure solutions that support decentralized environments and secure, on-device intelligence to ensure compliance.
- The push toward hyper-automation in manufacturing and logistics is increasing the need for application software that supports autonomous decision-making, which in turn drives the adoption of AI edge infrastructure for real-time data processing in IoT-enabled devices.
- A shift toward subscription-based software-as-a-service (SaaS) models is encouraging the development of hybrid cloud integration frameworks, allowing enterprises to leverage centralized cloud services for training AI models while deploying them on edge infrastructure for low-latency inference.
Dive into Technavio’s robust research methodology, blending expert interviews, extensive data synthesis, and validated models for unparalleled AI Edge Infrastructure Market insights. See full methodology.
| Market Scope | |
|---|---|
| Page number | 307 |
| Base year | 2025 |
| Historic period | 2020-2024 |
| Forecast period | 2026-2030 |
| Growth momentum & CAGR | Accelerate at a CAGR of 28.9% |
| Market growth 2026-2030 | USD 11211.4 million |
| Market structure | Fragmented |
| YoY growth 2025-2026(%) | 22.5% |
| Key countries | US, Canada, Mexico, China, Japan, India, South Korea, Australia, Indonesia, Germany, UK, France, Italy, Spain, The Netherlands, Saudi Arabia, UAE, South Africa, Israel, Turkey, Brazil, Argentina and Chile |
| Competitive landscape | Leading Companies, Market Positioning of Companies, Competitive Strategies, and Industry Risks |
Research Analyst Overview
- The AI edge infrastructure market ecosystem is a complex value chain starting with semiconductor companies that design specialized AI chips, which account for over 40% of the hardware segment's value. These components are integrated by hardware OEMs into edge servers and gateways.
- Cloud service providers extend their platforms to the edge, enabling hybrid deployments, while software vendors offer orchestration and management tools. System integrators and service providers then deploy these solutions for end-users across sectors like manufacturing and automotive.
- This end-user segment is the largest driver of demand, with industrial applications leveraging edge AI to improve production line efficiency by up to 25%. Regulatory bodies influence the market by setting data privacy and security standards that guide technology development and deployment strategies across this interconnected network of stakeholders.
What are the Key Data Covered in this AI Edge Infrastructure Market Research and Growth Report?
-
What is the expected growth of the AI Edge Infrastructure Market between 2026 and 2030?
-
The AI Edge Infrastructure Market is expected to grow by USD 11.21 billion during 2026-2030, registering a CAGR of 28.9%. Year-over-year growth in 2026 is estimated at 22.5%%. This acceleration is shaped by increasing demand for low latency data processing and real time analytics at edge, which is intensifying demand across multiple end-use verticals covered in the report.
-
-
What segmentation does the market report cover?
-
The report is segmented by Component (Hardware, Software, and Services), Deployment (Cloud, On-premises, and Hybrid), End-user (Manufacturing, Telecommunications, Healthcare, Automotive, and Others) and Geography (North America, APAC, Europe, Middle East and Africa, South America). Among these, the Hardware segment is estimated to witness significant growth during the forecast period, driven by rising adoption across key application areas. Each segment includes detailed qualitative and quantitative analysis, along with historical data from 2020-2024 and forecasts through 2030 with year-over-year growth rates.
-
-
Which regions are analyzed in the report?
-
The report covers North America, APAC, Europe, Middle East and Africa and South America. North America is estimated to contribute 42.5% to market growth during the forecast period. Country-level analysis includes US, Canada, Mexico, China, Japan, India, South Korea, Australia, Indonesia, Germany, UK, France, Italy, Spain, The Netherlands, Saudi Arabia, UAE, South Africa, Israel, Turkey, Brazil, Argentina and Chile, with dedicated market size tables and year-over-year growth for each.
-
-
What are the key growth drivers and market challenges?
-
The primary driver is increasing demand for low latency data processing and real time analytics at edge, which is accelerating investment and industry demand. The main challenge is data privacy and security concerns at edge devices and decentralized environments, creating operational barriers for key market participants. The report quantifies the impact of each driver and challenge across 2026 and 2030 with comparative analysis.
-
-
Who are the major players in the AI Edge Infrastructure Market?
-
Key vendors include Advantech Co. Ltd., Advanced Micro Devices Inc., Amazon Web Services Inc., Cisco Systems Inc., ClearBlade Inc., Dell Technologies Inc., Google LLC, Hewlett Packard Enterprise Co., Huawei Technologies Co. Ltd., IBM Corp., Intel Corp., Lenovo Group Ltd., Microsoft Corp., NVIDIA Corp., Oracle Corp., Qualcomm Inc., Schneider Electric SE, Siemens AG, Super Micro Computer Inc. and ZEDEDA Inc.. The report provides qualitative and quantitative analysis categorizing companies as dominant, leading, strong, tentative, and weak based on their market positioning. Company profiles include business segment analysis, SWOT assessment, key offerings, and recent strategic developments.
-
Market Research Insights
- The competitive landscape of the global AI edge infrastructure market is highly active, with over 20 major vendors, including Advantech Co. Ltd., Advanced Micro Devices Inc., and Amazon Web Services Inc., driving innovation. Key players like NVIDIA Corp. are advancing GPU-accelerated platforms, while Intel Corp. focuses on optimized processors and software toolkits to enable high-performance AI inference.
- In a notable development, vendors are enhancing their offerings to achieve up to 30% lower power consumption without sacrificing performance. Cloud providers such as Microsoft Corp. and Google LLC are extending their services to the edge, creating seamless hybrid cloud environments. These actions directly address enterprise demand for scalable, low-latency solutions.
- However, the industry contends with a concentrated semiconductor supply chain, where lead times for advanced components can exceed 25 weeks, posing a significant challenge to production schedules.
We can help! Our analysts can customize this ai edge infrastructure market research report to meet your requirements.
 RIA -
RIA - 
