AI For Process Optimization Market Analysis, Size, and Forecast 2025-2029: North America (US and Canada), APAC (China, Japan, and India), Europe (Germany, UK, and France), Middle East and Africa (UAE, Saudi Arabia, and South Africa), South America (Brazil and Argentina), and Rest of World (ROW)

AI For Process Optimization Market Analysis, Size, and Forecast 2025-2029:
North America (US and Canada), APAC (China, Japan, and India), Europe (Germany, UK, and France), Middle East and Africa (UAE, Saudi Arabia, and South Africa), South America (Brazil and Argentina), and Rest of World (ROW)

Published: Dec 2025 297 Pages SKU: IRTNTR81007

Market Overview at a Glance

$17.24 B
Market Opportunity
36.3%
CAGR 2024 - 2029
38.6%
North America Growth
$
Clou-based segment 2023

AI For Process Optimization Market Size 2025-2029

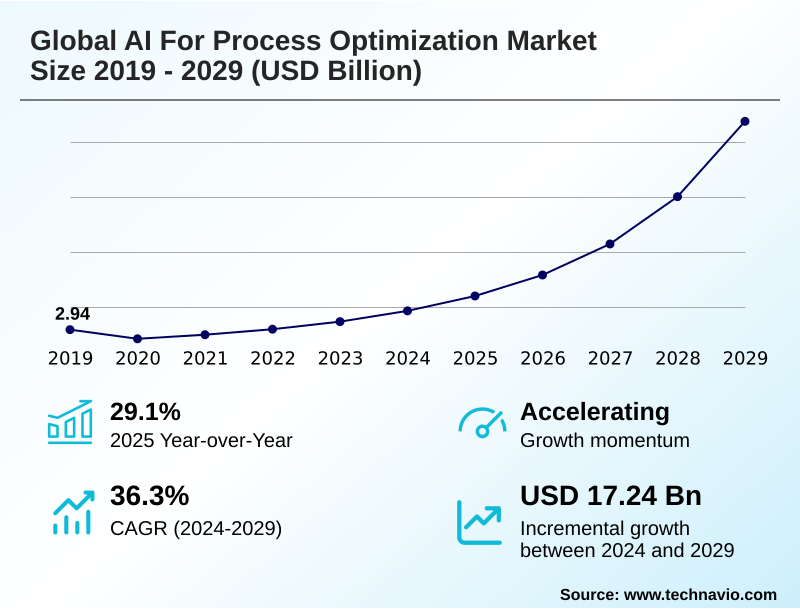
The ai for process optimization market size is valued to increase by USD 17.24 billion, at a CAGR of 36.3% from 2024 to 2029. Imperative for operational efficiency and cost reduction will drive the ai for process optimization market.

Major Market Trends & Insights

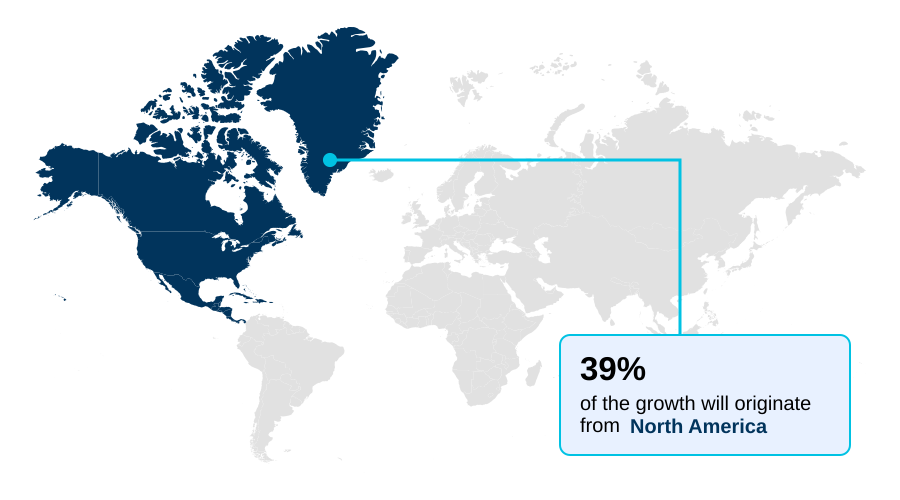
  • North America dominated the market and accounted for a 38.6% growth during the forecast period.
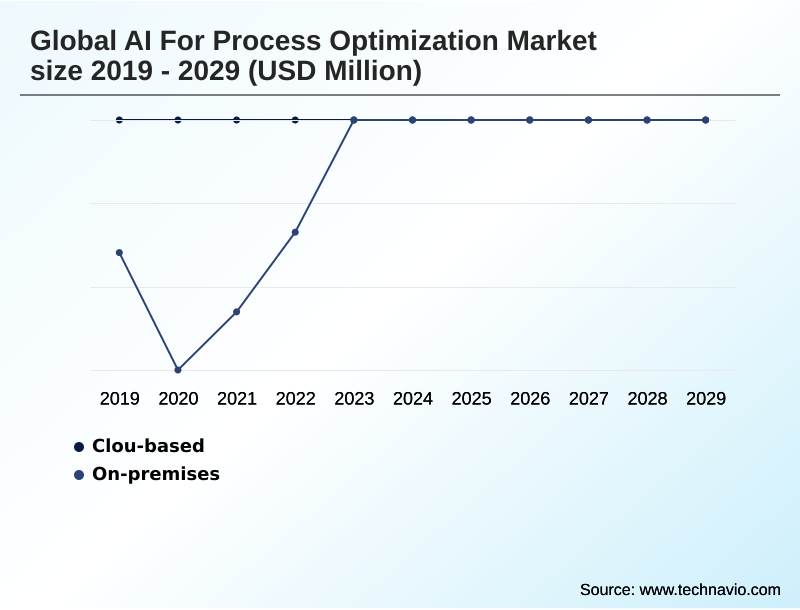
  • By Deployment - Clou-based segment was valued at in 2023
  • By Sector - Large enterprises segment accounted for the largest market revenue share in 2023

Market Size & Forecast

  • Market Opportunities: USD 18.94 billion
  • Market Future Opportunities: USD 17.24 billion
  • CAGR from 2024 to 2029 : 36.3%

Market Summary

  • The AI for process optimization market is rapidly evolving from a niche technology to a cornerstone of enterprise strategy, driven by the intense pressure for enhanced productivity and cost containment. Organizations are deploying these solutions to automate and intelligently manage cross-departmental workflows, moving beyond simple task execution.
  • A key trend is the adoption of hyperautomation architecture, which integrates cognitive automation and prescriptive analytics engines to build self-optimizing systems. For instance, in a complex supply chain, AI can analyze real-time data to anticipate disruptions, perform process bottleneck analysis, and automatically adjust logistics, thereby improving resilience and efficiency.
  • However, significant challenges remain, including the need for robust data lineage and provenance to ensure model accuracy and the demand for explainable AI (XAI) to meet regulatory and ethical standards. Overcoming the scarcity of skilled talent and ensuring data quality are critical for leveraging these powerful tools for data-driven operational intelligence.

What will be the Size of the AI For Process Optimization Market during the forecast period?

Get Key Insights on Market Forecast (PDF) Request Free Sample

How is the AI For Process Optimization Market Segmented?

The ai for process optimization industry research report provides comprehensive data (region-wise segment analysis), with forecasts and estimates in "USD million" for the period 2025-2029, as well as historical data from 2019-2023 for the following segments.

  • Deployment
    • Cloud-based
    • On-premises
  • Sector
    • Large enterprises
    • SME
  • End-user
    • BFSI
    • IT and telecom
    • Retail
    • Manufacturing
    • Healthcare
  • Solution
    • Automation
    • Process modeling
    • Monitoring and optimization
    • Content and document management
    • Integration
  • Geography
    • North America
      • US
      • Canada
    • APAC
      • China
      • Japan
      • India
    • Europe
      • Germany
      • UK
      • France
    • Middle East and Africa
      • UAE
      • Saudi Arabia
      • South Africa
    • South America
      • Brazil
      • Argentina
    • Rest of World (ROW)

By Deployment Insights

The cloud-based segment is estimated to witness significant growth during the forecast period.

The market for AI for process optimization is segmented by deployment, with the cloud-based model being the dominant and most rapidly expanding choice.

This model's scalability is crucial for computationally intensive tasks like process mining and discovery and predictive process management. Cloud-native intelligent automation platforms provide the foundation for intelligent workflow automation and continuous process improvement, enabling organizations to achieve end-to-end process visibility.

By integrating technologies such as natural language processing and computer vision systems, these platforms support complex business process re-engineering.

This shift to an operational expenditure model democratizes access to advanced tools like AI-powered digital twins and robotic process automation, with adopters reporting significant operational efficiency gains, including an average 25% reduction in process cycle times.

Request Free Sample

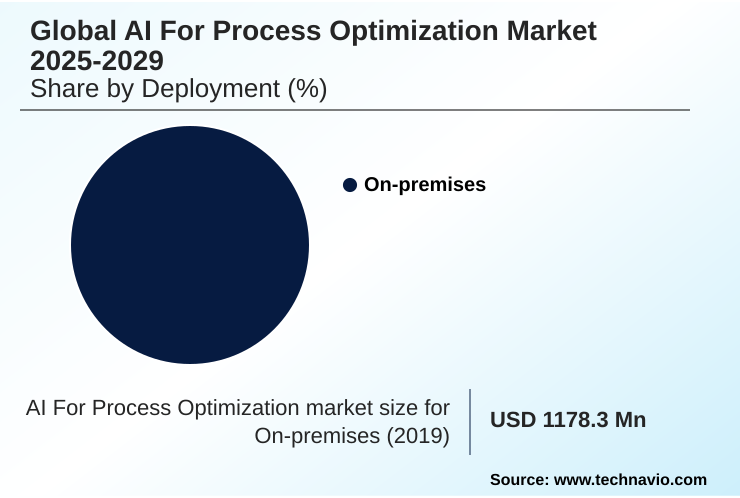
The Cloud-based segment was valued at in 2023 and showed a gradual increase during the forecast period.

Request Free Sample

Regional Analysis

North America is estimated to contribute 38.6% to the growth of the global market during the forecast period.Technavio’s analysts have elaborately explained the regional trends and drivers that shape the market during the forecast period.

See How AI For Process Optimization Market Demand is Rising in North America Request Free Sample

North America leads the market, leveraging advanced workflow orchestration tools and AI-driven decision support to drive innovation. In this region, enterprises have reported a 30% improvement in decision-making speed.

Europe follows, with Germany's industrial sector implementing real-time process monitoring and task automation scripts for manufacturing excellence. The APAC region shows the fastest growth, with investment in machine learning model training infrastructure increasing by over 40% annually.

A key focus across all geographies is operational risk mitigation, which is driving the adoption of tools for algorithmic bias detection and establishing clear data lineage and provenance.

This ensures process adherence monitoring and builds trust in intelligent task automation, with firms conducting automated root cause analysis to enhance system reliability.

Market Dynamics

Our researchers analyzed the data with 2024 as the base year, along with the key drivers, trends, and challenges. A holistic analysis of drivers will help companies refine their marketing strategies to gain a competitive advantage.

  • The strategic implementation of AI for process optimization is becoming increasingly nuanced, moving beyond broad-stroke automation to address highly specific operational challenges. For instance, using generative AI for hyperautomation is allowing business analysts, not just developers, to design and deploy complex workflows, democratizing innovation.
  • In manufacturing, the benefits of digital twins in manufacturing are profound; these virtual replicas enable companies to simulate production changes, leading to efficiency improvements that are often double what traditional process modeling can achieve. This is particularly crucial for enhancing AI for supply chain resilience, where predictive models can now anticipate disruptions and reroute logistics in near real-time.
  • In parallel, the focus on responsible AI in financial services is non-negotiable, with firms now required to prove the fairness of their algorithms. This has spurred demand for AI-powered process mining tools comparison to select solutions with robust explainability features.
  • The imperative for automating compliance with AI extends to industries like energy, where AI-driven predictive maintenance in energy not only prevents downtime but also ensures adherence to safety protocols. However, challenges of AI in healthcare operations persist, particularly around data privacy and integration.
  • As retailers adopt AI for process optimization in retail to refine inventory and pricing, and logistics firms leverage AI for optimizing last-mile delivery, the common thread is the need to overcome talent gaps for AI implementation.
  • Implementing AIOps for network management has become standard for tech firms, while other sectors are exploring AI for personalized customer service and automating HR processes with AI. Success hinges on building transparent systems, as highlighted by the need for explainability in AI-driven lending and the intricate work of securing data for AI model training.
  • The impact of AI on manufacturing quality is undeniable, just as the drive to optimize revenue cycle with AI and reduce operational costs with RPA shows clear ROI. Ultimately, tools for AI for optimizing patient flow demonstrate how targeted applications can yield significant societal and business benefits.

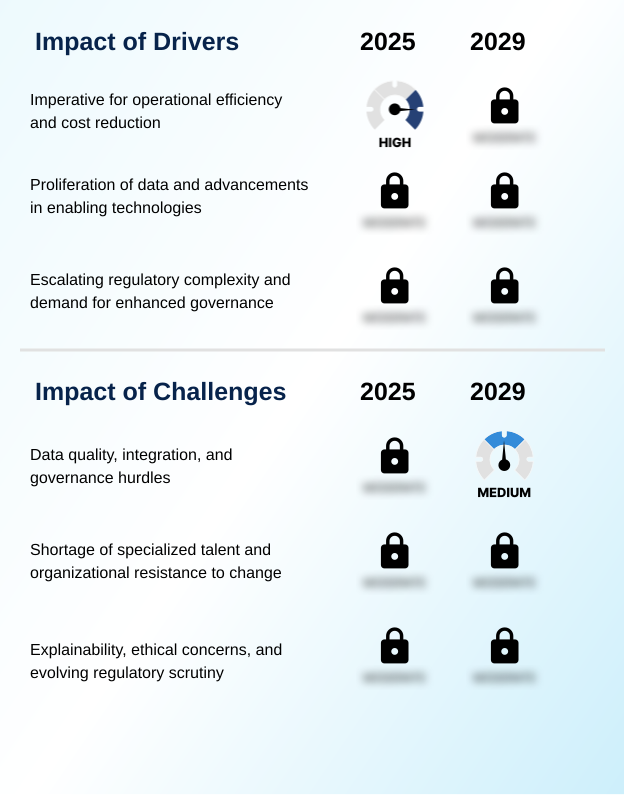
What are the key market drivers leading to the rise in the adoption of AI For Process Optimization Industry?

  • The imperative for enhancing operational efficiency and achieving significant cost reduction across enterprises stands as a primary driver for market growth.

  • The primary driver is the corporate mandate for operational efficiency. Intelligent business process management suites are central to achieving this, enabling predictive maintenance scheduling that reduces equipment downtime by up to 50%.
  • In healthcare, patient flow optimization tools have cut wait times by 20%. The proliferation of data is accelerating the adoption of asset performance management and smart factory solutions.
  • Technological advancements, particularly generative AI for code and automated code testing, democratize development, while sophisticated network traffic routing algorithms reduce latency.
  • The need to manage energy consumption management and the entire AI model lifecycle management efficiently also propels investment, as does the demand for automating processes like automated invoice processing, claims processing automation, and loan underwriting automation.

What are the market trends shaping the AI For Process Optimization Industry?

  • The proliferation of generative AI and the push toward hyperautomation are emerging as the most transformative trends. These are fundamentally reshaping process optimization by enabling more intelligent and comprehensive automation strategies.

  • A key trend is the integration of generative AI within a hyperautomation framework, creating a more capable AI-augmented workforce. This includes the use of process simulation models for production line optimization, which has improved output by 18% in early adoptions. In manufacturing, automated quality inspection with computer vision detects defects with 99.9% accuracy.
  • For logistics network optimization, sophisticated supply chain optimization algorithms enable dynamic resource allocation in real-time. In finance and healthcare, automated compliance checks for regulatory compliance automation and revenue cycle management automation are becoming standard. These fraud detection systems are improving customer journey optimization by reducing friction and enhancing security, leading to optimized resource utilization.

What challenges does the AI For Process Optimization Industry face during its growth?

  • Significant challenges related to data quality, complex system integration, and stringent governance requirements present considerable hurdles to widespread market adoption.

  • Despite strong market drivers, significant challenges impede widespread adoption. The lack of data readiness is a primary hurdle, as effective cognitive automation and prescriptive analytics engines depend on high-quality data, yet only about 20% of enterprise data is structured and readily usable. Integrating solutions into a cohesive hyperautomation architecture is complex, often hindered by legacy systems.
  • A major concern is the 'black box' nature of some models, creating a demand for explainable AI (XAI) to ensure transparent context-aware decisioning, especially in regulated sectors. Organizational resistance and a persistent shortage of specialized talent capable of managing autonomous process optimization also constrain growth.
  • Successfully navigating these issues requires not only technological solutions for unstructured data extraction but also robust change management to foster trust in data-driven operational intelligence and human-in-the-loop systems.

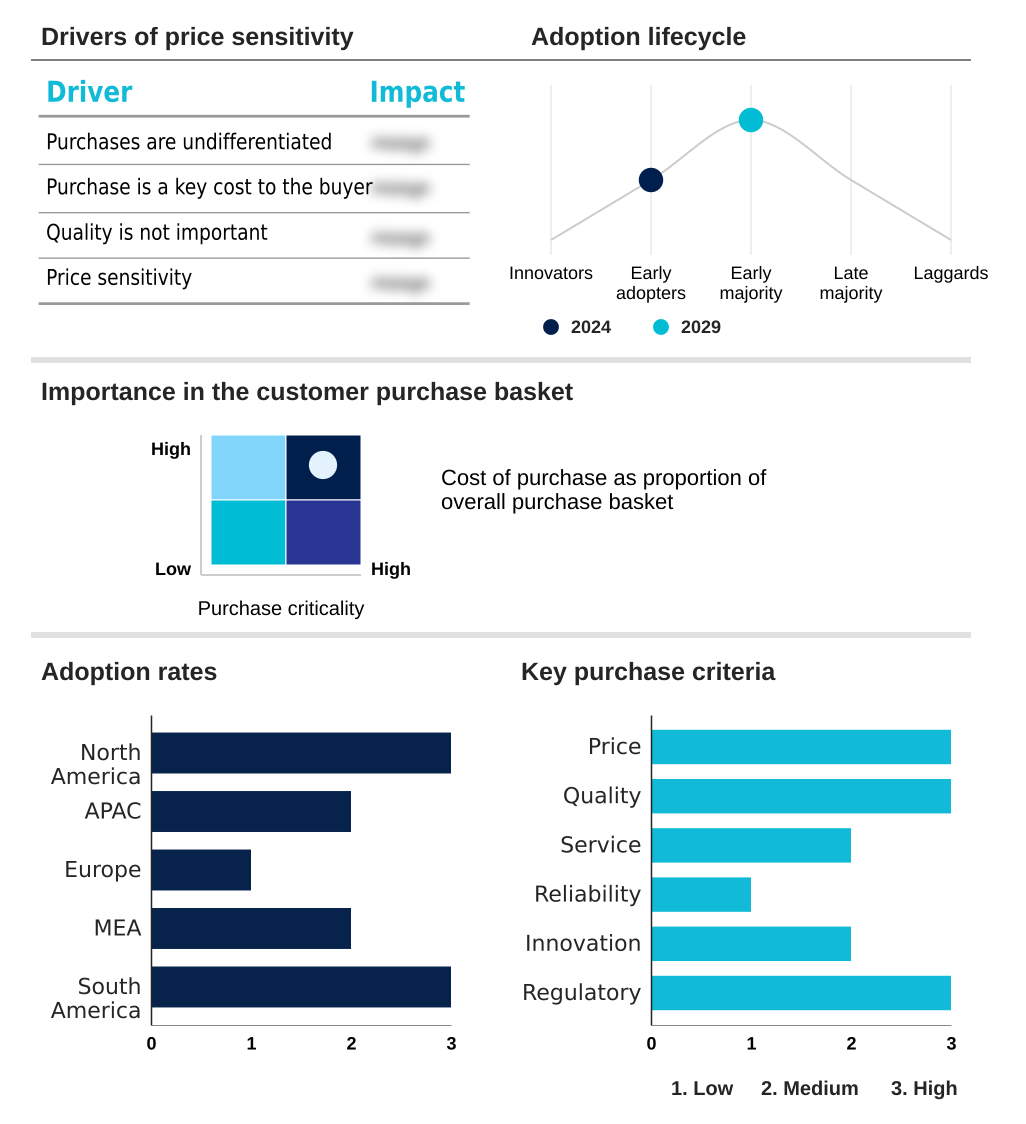
Exclusive Technavio Analysis on Customer Landscape

The ai for process optimization market forecasting report includes the adoption lifecycle of the market, covering from the innovator’s stage to the laggard’s stage. It focuses on adoption rates in different regions based on penetration. Furthermore, the ai for process optimization market report also includes key purchase criteria and drivers of price sensitivity to help companies evaluate and develop their market growth analysis strategies.

Customer Landscape of AI For Process Optimization Industry

Competitive Landscape

Companies are implementing various strategies, such as strategic alliances, ai for process optimization market forecast, partnerships, mergers and acquisitions, geographical expansion, and product/service launches, to enhance their presence in the industry.

ABB Ltd. - Offerings include AI-powered platforms designed for industrial analytics, asset performance management, and intelligent automation to optimize complex business and operational workflows across diverse enterprise environments.

The industry research and growth report includes detailed analyses of the competitive landscape of the market and information about key companies, including:

  • ABB Ltd.
  • Accenture PLC
  • Amazon Web Services Inc.
  • Aspen Technology Inc.
  • Cognizant Technology Solution
  • Emerson Electric Co.
  • Honeywell International Inc.
  • Infosys Ltd.
  • IBM Corp.
  • KPMG International Ltd.
  • Microsoft Corp.
  • Oracle Corp.
  • Robert Bosch GmbH
  • Rockwell Automation Inc.
  • SAP SE
  • Schneider Electric SE
  • Siemens AG
  • TIBCO Software Inc.
  • Yokogawa Electric Corp.

Qualitative and quantitative analysis of companies has been conducted to help clients understand the wider business environment as well as the strengths and weaknesses of key industry players. Data is qualitatively analyzed to categorize companies as pure play, category-focused, industry-focused, and diversified; it is quantitatively analyzed to categorize companies as dominant, leading, strong, tentative, and weak.

Recent Development and News in Ai for process optimization market

  • In October 2024, Oracle Corp. announced a strategic partnership with a leading automotive OEM to integrate its AI-driven supply chain management solutions, aiming to enhance real-time inventory visibility and predictive logistics.
  • In January 2025, Siemens AG launched an enhanced version of its Siemens Xcelerator platform, incorporating advanced generative AI capabilities to create self-optimizing digital twins for complex manufacturing environments.
  • In March 2025, Accenture PLC completed the acquisition of a specialized AI firm focused on responsible AI and algorithmic auditing, strengthening its consulting services for ethical process optimization in the financial services sector.
  • In May 2025, Microsoft Corp. unveiled a new initiative to provide specialized training and AI-powered tools for SMEs, aiming to accelerate the adoption of process optimization solutions within this high-growth market segment.

Dive into Technavio’s robust research methodology, blending expert interviews, extensive data synthesis, and validated models for unparalleled AI For Process Optimization Market insights. See full methodology.

Market Scope
Page number 297
Base year 2024
Historic period 2019-2023
Forecast period 2025-2029
Growth momentum & CAGR Accelerate at a CAGR of 36.3%
Market growth 2025-2029 USD 17237.9 million
Market structure Fragmented
YoY growth 2024-2025(%) 29.1%
Key countries US, Canada, China, Japan, India, South Korea, Germany, UK, France, UAE, Saudi Arabia, South Africa, Brazil and Argentina
Competitive landscape Leading Companies, Market Positioning of Companies, Competitive Strategies, and Industry Risks

Request Free Sample

Research Analyst Overview

  • The AI for process optimization market has reached a pivotal stage, transitioning from isolated pilot projects to a fundamental component of corporate strategy. Boardroom decisions are now heavily influenced by the potential of intelligent business process management to drive enterprise-wide transformation.
  • Companies are architecting sophisticated ecosystems combining robotic process automation with cognitive automation, underpinned by deep insights from process mining and discovery. Key technologies like natural language processing for unstructured data and computer vision systems for physical asset monitoring are becoming standard. The deployment of AI-powered digital twins is a significant trend, enabling advanced predictive process management and simulation.
  • Organizations utilizing these digital replicas for production line optimization have reported a 30% reduction in changeover times. This evolution toward autonomous process optimization is driving demand for explainable AI (XAI) to ensure transparent governance, making algorithmic bias detection a critical capability for maintaining trust and compliance in a highly automated environment.

What are the Key Data Covered in this AI For Process Optimization Market Research and Growth Report?

  • What is the expected growth of the AI For Process Optimization Market between 2025 and 2029?

    • USD 17.24 billion, at a CAGR of 36.3%

  • What segmentation does the market report cover?

    • The report is segmented by Deployment (Clou-based, and On-premises), Sector (Large enterprises, and SME), End-user (BFSI, IT and telecom, Retail, Manufacturing, and Healthcare), Solution (Automation, Process modeling, monitoring and optimization, content and document management, and integration) and Geography (North America, APAC, Europe, Middle East and Africa, South America)

  • Which regions are analyzed in the report?

    • North America, APAC, Europe, Middle East and Africa and South America

  • What are the key growth drivers and market challenges?

    • Imperative for operational efficiency and cost reduction, Data quality, integration, and governance hurdles

  • Who are the major players in the AI For Process Optimization Market?

    • ABB Ltd., Accenture PLC, Amazon Web Services Inc., Aspen Technology Inc., Cognizant Technology Solution, Emerson Electric Co., Honeywell International Inc., Infosys Ltd., IBM Corp., KPMG International Ltd., Microsoft Corp., Oracle Corp., Robert Bosch GmbH, Rockwell Automation Inc., SAP SE, Schneider Electric SE, Siemens AG, TIBCO Software Inc. and Yokogawa Electric Corp.

Market Research Insights

  • Market dynamics are shaped by an intense focus on achieving measurable business outcomes. The shift toward data-driven operational intelligence is compelling organizations to adopt solutions that provide end-to-end process visibility. This has led to a 40% increase in the adoption of platforms enabling intelligent workflow automation over the last two years.
  • Implementations focused on supply chain resilience have demonstrated a 25% reduction in stockout incidents by using predictive models. Furthermore, the emphasis on regulatory compliance automation is critical, with firms in regulated industries reporting that automated systems align with compliance frameworks 99.5% of the time, compared to 85% for manual processes.
  • This push for efficiency is balanced by the need for human-in-the-loop systems to manage exceptions and provide strategic oversight, ensuring that intelligent task automation augments rather than replaces human expertise, driving continuous process improvement.

We can help! Our analysts can customize this ai for process optimization market research report to meet your requirements.

Get in touch

1. Executive Summary

1.1 Market overview

Executive Summary - Chart on Market Overview
Executive Summary - Data Table on Market Overview
Executive Summary - Chart on Global Market Characteristics
Executive Summary - Chart on Market by Geography
Executive Summary - Chart on Market Segmentation by Deployment
Executive Summary - Chart on Market Segmentation by Sector
Executive Summary - Chart on Market Segmentation by End-user
Executive Summary - Chart on Market Segmentation by Solution
Executive Summary - Chart on Incremental Growth
Executive Summary - Data Table on Incremental Growth
Executive Summary - Chart on Company Market Positioning

2. Technavio Analysis

2.1 Analysis of price sensitivity, lifecycle, customer purchase basket, adoption rates, and purchase criteria

2.2 Criticality of inputs and Factors of differentiation

Chart on Overview on criticality of inputs and factors of differentiation

2.3 Factors of disruption

Chart on Overview on factors of disruption

2.4 Impact of drivers and challenges

Chart on Impact of drivers and challenges in 2024 and 2029

3. Market Landscape

3.1 Market ecosystem

Chart on Parent Market
Data Table on - Parent Market

3.2 Market characteristics

Chart on Market characteristics analysis

3.3 Value chain analysis

Chart on Value chain analysis

4. Market Sizing

4.1 Market definition

Data Table on Offerings of companies included in the market definition

4.2 Market segment analysis

Market segments

4.3 Market size 2024

4.4 Market outlook: Forecast for 2024-2029

Chart on Global - Market size and forecast 2024-2029 ($ million)
Data Table on Global - Market size and forecast 2024-2029 ($ million)
Chart on Global Market: Year-over-year growth 2024-2029 (%)
Data Table on Global Market: Year-over-year growth 2024-2029 (%)

5. Historic Market Size

5.1 Global AI For Process Optimization Market 2019 - 2023

Historic Market Size - Data Table on Global AI For Process Optimization Market 2019 - 2023 ($ million)

5.2 Deployment segment analysis 2019 - 2023

Historic Market Size - Deployment Segment 2019 - 2023 ($ million)

5.3 Sector segment analysis 2019 - 2023

Historic Market Size - Sector Segment 2019 - 2023 ($ million)

5.4 End-user segment analysis 2019 - 2023

Historic Market Size - End-user Segment 2019 - 2023 ($ million)

5.5 Solution segment analysis 2019 - 2023

Historic Market Size - Solution Segment 2019 - 2023 ($ million)

5.6 Geography segment analysis 2019 - 2023

Historic Market Size - Geography Segment 2019 - 2023 ($ million)

5.7 Country segment analysis 2019 - 2023

Historic Market Size - Country Segment 2019 - 2023 ($ million)

6. Five Forces Analysis

6.1 Five forces summary

Five forces analysis - Comparison between 2024 and 2029

6.2 Bargaining power of buyers

Bargaining power of buyers - Impact of key factors 2024 and 2029

6.3 Bargaining power of suppliers

Bargaining power of suppliers - Impact of key factors in 2024 and 2029

6.4 Threat of new entrants

Threat of new entrants - Impact of key factors in 2024 and 2029

6.5 Threat of substitutes

Threat of substitutes - Impact of key factors in 2024 and 2029

6.6 Threat of rivalry

Threat of rivalry - Impact of key factors in 2024 and 2029

6.7 Market condition

Chart on Market condition - Five forces 2024 and 2029

7. Market Segmentation by Deployment

7.1 Market segments

Chart on Deployment - Market share 2024-2029 (%)
Data Table on Deployment - Market share 2024-2029 (%)

7.2 Comparison by Deployment

Chart on Comparison by Deployment
Data Table on Comparison by Deployment

7.3 Cloud-based - Market size and forecast 2024-2029

Chart on Cloud-based - Market size and forecast 2024-2029 ($ million)
Data Table on Cloud-based - Market size and forecast 2024-2029 ($ million)
Chart on Cloud-based - Year-over-year growth 2024-2029 (%)
Data Table on Cloud-based - Year-over-year growth 2024-2029 (%)

7.4 On-premises - Market size and forecast 2024-2029

Chart on On-premises - Market size and forecast 2024-2029 ($ million)
Data Table on On-premises - Market size and forecast 2024-2029 ($ million)
Chart on On-premises - Year-over-year growth 2024-2029 (%)
Data Table on On-premises - Year-over-year growth 2024-2029 (%)

7.5 Market opportunity by Deployment

Market opportunity by Deployment ($ million)
Data Table on Market opportunity by Deployment ($ million)

8. Market Segmentation by Sector

8.1 Market segments

Chart on Sector - Market share 2024-2029 (%)
Data Table on Sector - Market share 2024-2029 (%)

8.2 Comparison by Sector

Chart on Comparison by Sector
Data Table on Comparison by Sector

8.3 Large enterprises - Market size and forecast 2024-2029

Chart on Large enterprises - Market size and forecast 2024-2029 ($ million)
Data Table on Large enterprises - Market size and forecast 2024-2029 ($ million)
Chart on Large enterprises - Year-over-year growth 2024-2029 (%)
Data Table on Large enterprises - Year-over-year growth 2024-2029 (%)

8.4 SME - Market size and forecast 2024-2029

Chart on SME - Market size and forecast 2024-2029 ($ million)
Data Table on SME - Market size and forecast 2024-2029 ($ million)
Chart on SME - Year-over-year growth 2024-2029 (%)
Data Table on SME - Year-over-year growth 2024-2029 (%)

8.5 Market opportunity by Sector

Market opportunity by Sector ($ million)
Data Table on Market opportunity by Sector ($ million)

9. Market Segmentation by End-user

9.1 Market segments

Chart on End-user - Market share 2024-2029 (%)
Data Table on End-user - Market share 2024-2029 (%)

9.2 Comparison by End-user

Chart on Comparison by End-user
Data Table on Comparison by End-user

9.3 BFSI - Market size and forecast 2024-2029

Chart on BFSI - Market size and forecast 2024-2029 ($ million)
Data Table on BFSI - Market size and forecast 2024-2029 ($ million)
Chart on BFSI - Year-over-year growth 2024-2029 (%)
Data Table on BFSI - Year-over-year growth 2024-2029 (%)

9.4 IT and telecom - Market size and forecast 2024-2029

Chart on IT and telecom - Market size and forecast 2024-2029 ($ million)
Data Table on IT and telecom - Market size and forecast 2024-2029 ($ million)
Chart on IT and telecom - Year-over-year growth 2024-2029 (%)
Data Table on IT and telecom - Year-over-year growth 2024-2029 (%)

9.5 Retail - Market size and forecast 2024-2029

Chart on Retail - Market size and forecast 2024-2029 ($ million)
Data Table on Retail - Market size and forecast 2024-2029 ($ million)
Chart on Retail - Year-over-year growth 2024-2029 (%)
Data Table on Retail - Year-over-year growth 2024-2029 (%)

9.6 Manufacturing - Market size and forecast 2024-2029

Chart on Manufacturing - Market size and forecast 2024-2029 ($ million)
Data Table on Manufacturing - Market size and forecast 2024-2029 ($ million)
Chart on Manufacturing - Year-over-year growth 2024-2029 (%)
Data Table on Manufacturing - Year-over-year growth 2024-2029 (%)

9.7 Healthcare - Market size and forecast 2024-2029

Chart on Healthcare - Market size and forecast 2024-2029 ($ million)
Data Table on Healthcare - Market size and forecast 2024-2029 ($ million)
Chart on Healthcare - Year-over-year growth 2024-2029 (%)
Data Table on Healthcare - Year-over-year growth 2024-2029 (%)

9.8 Market opportunity by End-user

Market opportunity by End-user ($ million)
Data Table on Market opportunity by End-user ($ million)

10. Market Segmentation by Solution

10.1 Market segments

Chart on Solution - Market share 2024-2029 (%)
Data Table on Solution - Market share 2024-2029 (%)

10.2 Comparison by Solution

Chart on Comparison by Solution
Data Table on Comparison by Solution

10.3 Automation - Market size and forecast 2024-2029

Chart on Automation - Market size and forecast 2024-2029 ($ million)
Data Table on Automation - Market size and forecast 2024-2029 ($ million)
Chart on Automation - Year-over-year growth 2024-2029 (%)
Data Table on Automation - Year-over-year growth 2024-2029 (%)

10.4 Process modeling - Market size and forecast 2024-2029

Chart on Process modeling - Market size and forecast 2024-2029 ($ million)
Data Table on Process modeling - Market size and forecast 2024-2029 ($ million)
Chart on Process modeling - Year-over-year growth 2024-2029 (%)
Data Table on Process modeling - Year-over-year growth 2024-2029 (%)

10.5 Monitoring and optimization - Market size and forecast 2024-2029

Chart on Monitoring and optimization - Market size and forecast 2024-2029 ($ million)
Data Table on Monitoring and optimization - Market size and forecast 2024-2029 ($ million)
Chart on Monitoring and optimization - Year-over-year growth 2024-2029 (%)
Data Table on Monitoring and optimization - Year-over-year growth 2024-2029 (%)

10.6 Content and document management - Market size and forecast 2024-2029

Chart on Content and document management - Market size and forecast 2024-2029 ($ million)
Data Table on Content and document management - Market size and forecast 2024-2029 ($ million)
Chart on Content and document management - Year-over-year growth 2024-2029 (%)
Data Table on Content and document management - Year-over-year growth 2024-2029 (%)

10.7 Integration - Market size and forecast 2024-2029

Chart on Integration - Market size and forecast 2024-2029 ($ million)
Data Table on Integration - Market size and forecast 2024-2029 ($ million)
Chart on Integration - Year-over-year growth 2024-2029 (%)
Data Table on Integration - Year-over-year growth 2024-2029 (%)

10.8 Market opportunity by Solution

Market opportunity by Solution ($ million)
Data Table on Market opportunity by Solution ($ million)

11. Customer Landscape

11.1 Customer landscape overview

Analysis of price sensitivity, lifecycle, customer purchase basket, adoption rates, and purchase criteria

12. Geographic Landscape

12.1 Geographic segmentation

Chart on Market share by geography 2024-2029 (%)
Data Table on Market share by geography 2024-2029 (%)

12.2 Geographic comparison

Chart on Geographic comparison
Data Table on Geographic comparison

12.3 North America - Market size and forecast 2024-2029

Chart on North America - Market size and forecast 2024-2029 ($ million)
Data Table on North America - Market size and forecast 2024-2029 ($ million)
Chart on North America - Year-over-year growth 2024-2029 (%)
Data Table on North America - Year-over-year growth 2024-2029 (%)
Chart on Regional Comparison - North America
Data Table on Regional Comparison - North America

12.3.1 US - Market size and forecast 2024-2029

Chart on US - Market size and forecast 2024-2029 ($ million)
Data Table on US - Market size and forecast 2024-2029 ($ million)
Chart on US - Year-over-year growth 2024-2029 (%)
Data Table on US - Year-over-year growth 2024-2029 (%)

12.3.2 Canada - Market size and forecast 2024-2029

Chart on Canada - Market size and forecast 2024-2029 ($ million)
Data Table on Canada - Market size and forecast 2024-2029 ($ million)
Chart on Canada - Year-over-year growth 2024-2029 (%)
Data Table on Canada - Year-over-year growth 2024-2029 (%)

12.4 APAC - Market size and forecast 2024-2029

Chart on APAC - Market size and forecast 2024-2029 ($ million)
Data Table on APAC - Market size and forecast 2024-2029 ($ million)
Chart on APAC - Year-over-year growth 2024-2029 (%)
Data Table on APAC - Year-over-year growth 2024-2029 (%)
Chart on Regional Comparison - APAC
Data Table on Regional Comparison - APAC

12.4.1 China - Market size and forecast 2024-2029

Chart on China - Market size and forecast 2024-2029 ($ million)
Data Table on China - Market size and forecast 2024-2029 ($ million)
Chart on China - Year-over-year growth 2024-2029 (%)
Data Table on China - Year-over-year growth 2024-2029 (%)

12.4.2 Japan - Market size and forecast 2024-2029

Chart on Japan - Market size and forecast 2024-2029 ($ million)
Data Table on Japan - Market size and forecast 2024-2029 ($ million)
Chart on Japan - Year-over-year growth 2024-2029 (%)
Data Table on Japan - Year-over-year growth 2024-2029 (%)

12.4.3 India - Market size and forecast 2024-2029

Chart on India - Market size and forecast 2024-2029 ($ million)
Data Table on India - Market size and forecast 2024-2029 ($ million)
Chart on India - Year-over-year growth 2024-2029 (%)
Data Table on India - Year-over-year growth 2024-2029 (%)

12.4.4 South Korea - Market size and forecast 2024-2029

Chart on South Korea - Market size and forecast 2024-2029 ($ million)
Data Table on South Korea - Market size and forecast 2024-2029 ($ million)
Chart on South Korea - Year-over-year growth 2024-2029 (%)
Data Table on South Korea - Year-over-year growth 2024-2029 (%)

12.5 Europe - Market size and forecast 2024-2029

Chart on Europe - Market size and forecast 2024-2029 ($ million)
Data Table on Europe - Market size and forecast 2024-2029 ($ million)
Chart on Europe - Year-over-year growth 2024-2029 (%)
Data Table on Europe - Year-over-year growth 2024-2029 (%)
Chart on Regional Comparison - Europe
Data Table on Regional Comparison - Europe

12.5.1 Germany - Market size and forecast 2024-2029

Chart on Germany - Market size and forecast 2024-2029 ($ million)
Data Table on Germany - Market size and forecast 2024-2029 ($ million)
Chart on Germany - Year-over-year growth 2024-2029 (%)
Data Table on Germany - Year-over-year growth 2024-2029 (%)

12.5.2 UK - Market size and forecast 2024-2029

Chart on UK - Market size and forecast 2024-2029 ($ million)
Data Table on UK - Market size and forecast 2024-2029 ($ million)
Chart on UK - Year-over-year growth 2024-2029 (%)
Data Table on UK - Year-over-year growth 2024-2029 (%)

12.5.3 France - Market size and forecast 2024-2029

Chart on France - Market size and forecast 2024-2029 ($ million)
Data Table on France - Market size and forecast 2024-2029 ($ million)
Chart on France - Year-over-year growth 2024-2029 (%)
Data Table on France - Year-over-year growth 2024-2029 (%)

12.6 Middle East and Africa - Market size and forecast 2024-2029

Chart on Middle East and Africa - Market size and forecast 2024-2029 ($ million)
Data Table on Middle East and Africa - Market size and forecast 2024-2029 ($ million)
Chart on Middle East and Africa - Year-over-year growth 2024-2029 (%)
Data Table on Middle East and Africa - Year-over-year growth 2024-2029 (%)
Chart on Regional Comparison - Middle East and Africa
Data Table on Regional Comparison - Middle East and Africa

12.6.1 UAE - Market size and forecast 2024-2029

Chart on UAE - Market size and forecast 2024-2029 ($ million)
Data Table on UAE - Market size and forecast 2024-2029 ($ million)
Chart on UAE - Year-over-year growth 2024-2029 (%)
Data Table on UAE - Year-over-year growth 2024-2029 (%)

12.6.2 Saudi Arabia - Market size and forecast 2024-2029

Chart on Saudi Arabia - Market size and forecast 2024-2029 ($ million)
Data Table on Saudi Arabia - Market size and forecast 2024-2029 ($ million)
Chart on Saudi Arabia - Year-over-year growth 2024-2029 (%)
Data Table on Saudi Arabia - Year-over-year growth 2024-2029 (%)

12.6.3 South Africa - Market size and forecast 2024-2029

Chart on South Africa - Market size and forecast 2024-2029 ($ million)
Data Table on South Africa - Market size and forecast 2024-2029 ($ million)
Chart on South Africa - Year-over-year growth 2024-2029 (%)
Data Table on South Africa - Year-over-year growth 2024-2029 (%)

12.7 South America - Market size and forecast 2024-2029

Chart on South America - Market size and forecast 2024-2029 ($ million)
Data Table on South America - Market size and forecast 2024-2029 ($ million)
Chart on South America - Year-over-year growth 2024-2029 (%)
Data Table on South America - Year-over-year growth 2024-2029 (%)
Chart on Regional Comparison - South America
Data Table on Regional Comparison - South America

12.7.1 Brazil - Market size and forecast 2024-2029

Chart on Brazil - Market size and forecast 2024-2029 ($ million)
Data Table on Brazil - Market size and forecast 2024-2029 ($ million)
Chart on Brazil - Year-over-year growth 2024-2029 (%)
Data Table on Brazil - Year-over-year growth 2024-2029 (%)

12.7.2 Argentina - Market size and forecast 2024-2029

Chart on Argentina - Market size and forecast 2024-2029 ($ million)
Data Table on Argentina - Market size and forecast 2024-2029 ($ million)
Chart on Argentina - Year-over-year growth 2024-2029 (%)
Data Table on Argentina - Year-over-year growth 2024-2029 (%)

12.8 Market opportunity by geography

Market opportunity by geography ($ million)
Data Tables on Market opportunity by geography ($ million)

13. Drivers, Challenges, and Opportunity

13.1 Market drivers

Imperative for operational efficiency and cost reduction
Proliferation of data and advancements in enabling technologies
Escalating regulatory complexity and demand for enhanced governance

13.2 Market challenges

Data quality, integration, and governance hurdles
Shortage of specialized talent and organizational resistance to change
Explainability, ethical concerns, and evolving regulatory scrutiny

13.3 Impact of drivers and challenges

Impact of drivers and challenges in 2024 and 2029

13.4 Market opportunities

Proliferation of generative AI and hyperautomation
Rise of AI-powered digital twins and predictive process management
Focus on responsible AI and ethical process optimization

14. Competitive Landscape

14.1 Overview

14.2

Overview on criticality of inputs and factors of differentiation

14.3 Landscape disruption

Overview on factors of disruption

14.4 Industry risks

Impact of key risks on business

15. Competitive Analysis

15.1 Companies profiled

Companies covered

15.2 Company ranking index

15.3 Market positioning of companies

Matrix on companies position and classification

15.4 ABB Ltd.

ABB Ltd. - Overview
ABB Ltd. - Business segments
ABB Ltd. - Key news
ABB Ltd. - Key offerings
ABB Ltd. - Segment focus
SWOT

15.5 Accenture PLC

Accenture PLC - Overview
Accenture PLC - Business segments
Accenture PLC - Key news
Accenture PLC - Key offerings
Accenture PLC - Segment focus
SWOT

15.6 Aspen Technology Inc.

Aspen Technology Inc. - Overview
Aspen Technology Inc. - Business segments
Aspen Technology Inc. - Key offerings
Aspen Technology Inc. - Segment focus
SWOT

15.7 Emerson Electric Co.

Emerson Electric Co. - Overview
Emerson Electric Co. - Business segments
Emerson Electric Co. - Key news
Emerson Electric Co. - Key offerings
Emerson Electric Co. - Segment focus
SWOT

15.8 Honeywell International Inc.

Honeywell International Inc. - Overview
Honeywell International Inc. - Business segments
Honeywell International Inc. - Key news
Honeywell International Inc. - Key offerings
Honeywell International Inc. - Segment focus
SWOT

15.9 IBM Corp.

IBM Corp. - Overview
IBM Corp. - Business segments
IBM Corp. - Key news
IBM Corp. - Key offerings
IBM Corp. - Segment focus
SWOT

15.10 KPMG International Ltd.

KPMG International Ltd. - Overview
KPMG International Ltd. - Product / Service
KPMG International Ltd. - Key offerings
SWOT

15.11 Microsoft Corp.

Microsoft Corp. - Overview
Microsoft Corp. - Business segments
Microsoft Corp. - Key news
Microsoft Corp. - Key offerings
Microsoft Corp. - Segment focus
SWOT

15.12 Oracle Corp.

Oracle Corp. - Overview
Oracle Corp. - Business segments
Oracle Corp. - Key news
Oracle Corp. - Key offerings
Oracle Corp. - Segment focus
SWOT

15.13 Rockwell Automation Inc.

Rockwell Automation Inc. - Overview
Rockwell Automation Inc. - Business segments
Rockwell Automation Inc. - Key news
Rockwell Automation Inc. - Key offerings
Rockwell Automation Inc. - Segment focus
SWOT

15.14 SAP SE

SAP SE - Overview
SAP SE - Business segments
SAP SE - Key news
SAP SE - Key offerings
SAP SE - Segment focus
SWOT

15.15 Schneider Electric SE

Schneider Electric SE - Overview
Schneider Electric SE - Business segments
Schneider Electric SE - Key news
Schneider Electric SE - Key offerings
Schneider Electric SE - Segment focus
SWOT

15.16 Siemens AG

Siemens AG - Overview
Siemens AG - Business segments
Siemens AG - Key news
Siemens AG - Key offerings
Siemens AG - Segment focus
SWOT

15.17 TIBCO Software Inc.

TIBCO Software Inc. - Overview
TIBCO Software Inc. - Product / Service
TIBCO Software Inc. - Key offerings
SWOT

15.18 Yokogawa Electric Corp.

Yokogawa Electric Corp. - Overview
Yokogawa Electric Corp. - Business segments
Yokogawa Electric Corp. - Key news
Yokogawa Electric Corp. - Key offerings
Yokogawa Electric Corp. - Segment focus
SWOT

16. Appendix

16.1 Scope of the report

Market definition
Objectives
Notes and caveats

16.2 Inclusions and exclusions checklist

Inclusions checklist
Exclusions checklist

16.3 Currency conversion rates for US$

16.4 Research methodology

16.5 Data procurement

Information sources

16.6 Data validation

16.7 Validation techniques employed for market sizing

16.8 Data synthesis

16.9 360 degree market analysis

16.10 List of abbreviations

Research Methodology

Technavio presents a detailed picture of the market by way of study, synthesis, and summation of data from multiple sources. The analysts have presented the various facets of the market with a particular focus on identifying the key industry influencers. The data thus presented is comprehensive, reliable, and the result of extensive research, both primary and secondary.

INFORMATION SOURCES

Primary sources

  • Manufacturers and suppliers
  • Channel partners
  • Industry experts
  • Strategic decision makers

Secondary sources

  • Industry journals and periodicals
  • Government data
  • Financial reports of key industry players
  • Historical data
  • Press releases

DATA ANALYSIS

Data Synthesis

  • Collation of data
  • Estimation of key figures
  • Analysis of derived insights

Data Validation

  • Triangulation with data models
  • Reference against proprietary databases
  • Corroboration with industry experts

REPORT WRITING

Qualitative

  • Market drivers
  • Market challenges
  • Market trends
  • Five forces analysis

Quantitative

  • Market size and forecast
  • Market segmentation
  • Geographical insights
  • Competitive landscape

Interested in this report?

Get your sample now to see our research methodology and insights!

Download Now

Frequently Asked Questions

AI For Process Optimization market growth will increase by USD 17237.9 million during 2025-2029.

The AI For Process Optimization market is expected to grow at a CAGR of 36.3% during 2025-2029.

AI For Process Optimization market is segmented by Deployment (Cloud-based, On-premises) Sector (Large enterprises, SME) End-user (BFSI, IT and telecom, Retail, Manufacturing, Healthcare) Solution (Automation, Process modeling, Monitoring and optimization, Content and document management, Integration)

ABB Ltd., Accenture PLC, Amazon Web Services Inc., Aspen Technology Inc., Cognizant Technology Solution, Emerson Electric Co., Honeywell International Inc., Infosys Ltd., IBM Corp., KPMG International Ltd., Microsoft Corp., Oracle Corp., Robert Bosch GmbH, Rockwell Automation Inc., SAP SE, Schneider Electric SE, Siemens AG, TIBCO Software Inc., Yokogawa Electric Corp. are a few of the key vendors in the AI For Process Optimization market.

North America will register the highest growth rate of 38.6% among the other regions. Therefore, the AI For Process Optimization market in North America is expected to garner significant business opportunities for the vendors during the forecast period.

US, Canada, China, Japan, India, South Korea, Germany, UK, France, UAE, Saudi Arabia, South Africa, Brazil, Argentina

  • Imperative for operational efficiency and cost reduction is the driving factor this market.

The AI For Process Optimization market vendors should focus on grabbing business opportunities from the Deployment segment as it accounted for the largest market share in the base year.