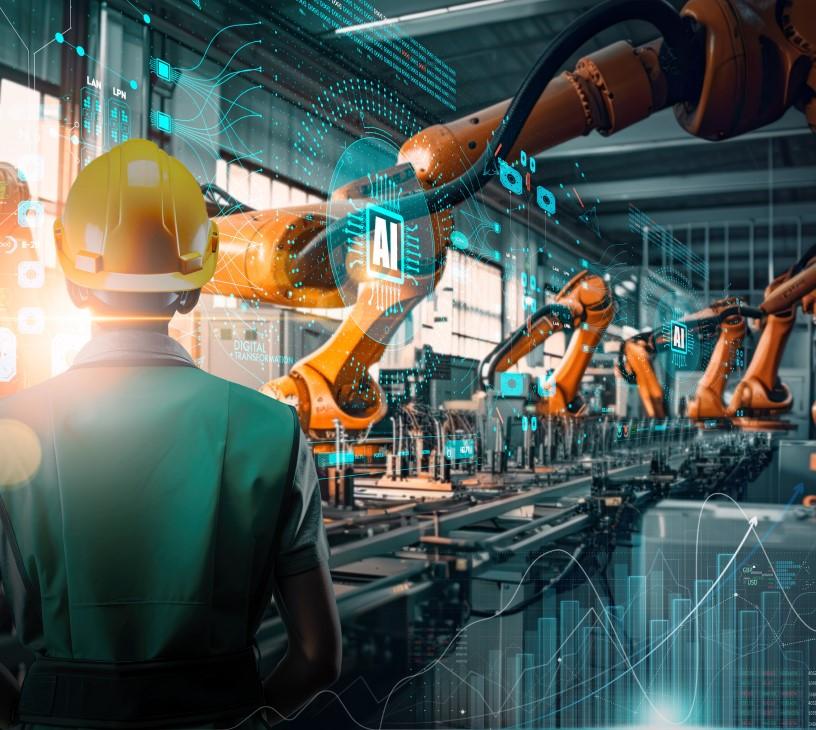
Generative AI In Manufacturing Market Size 2025-2029
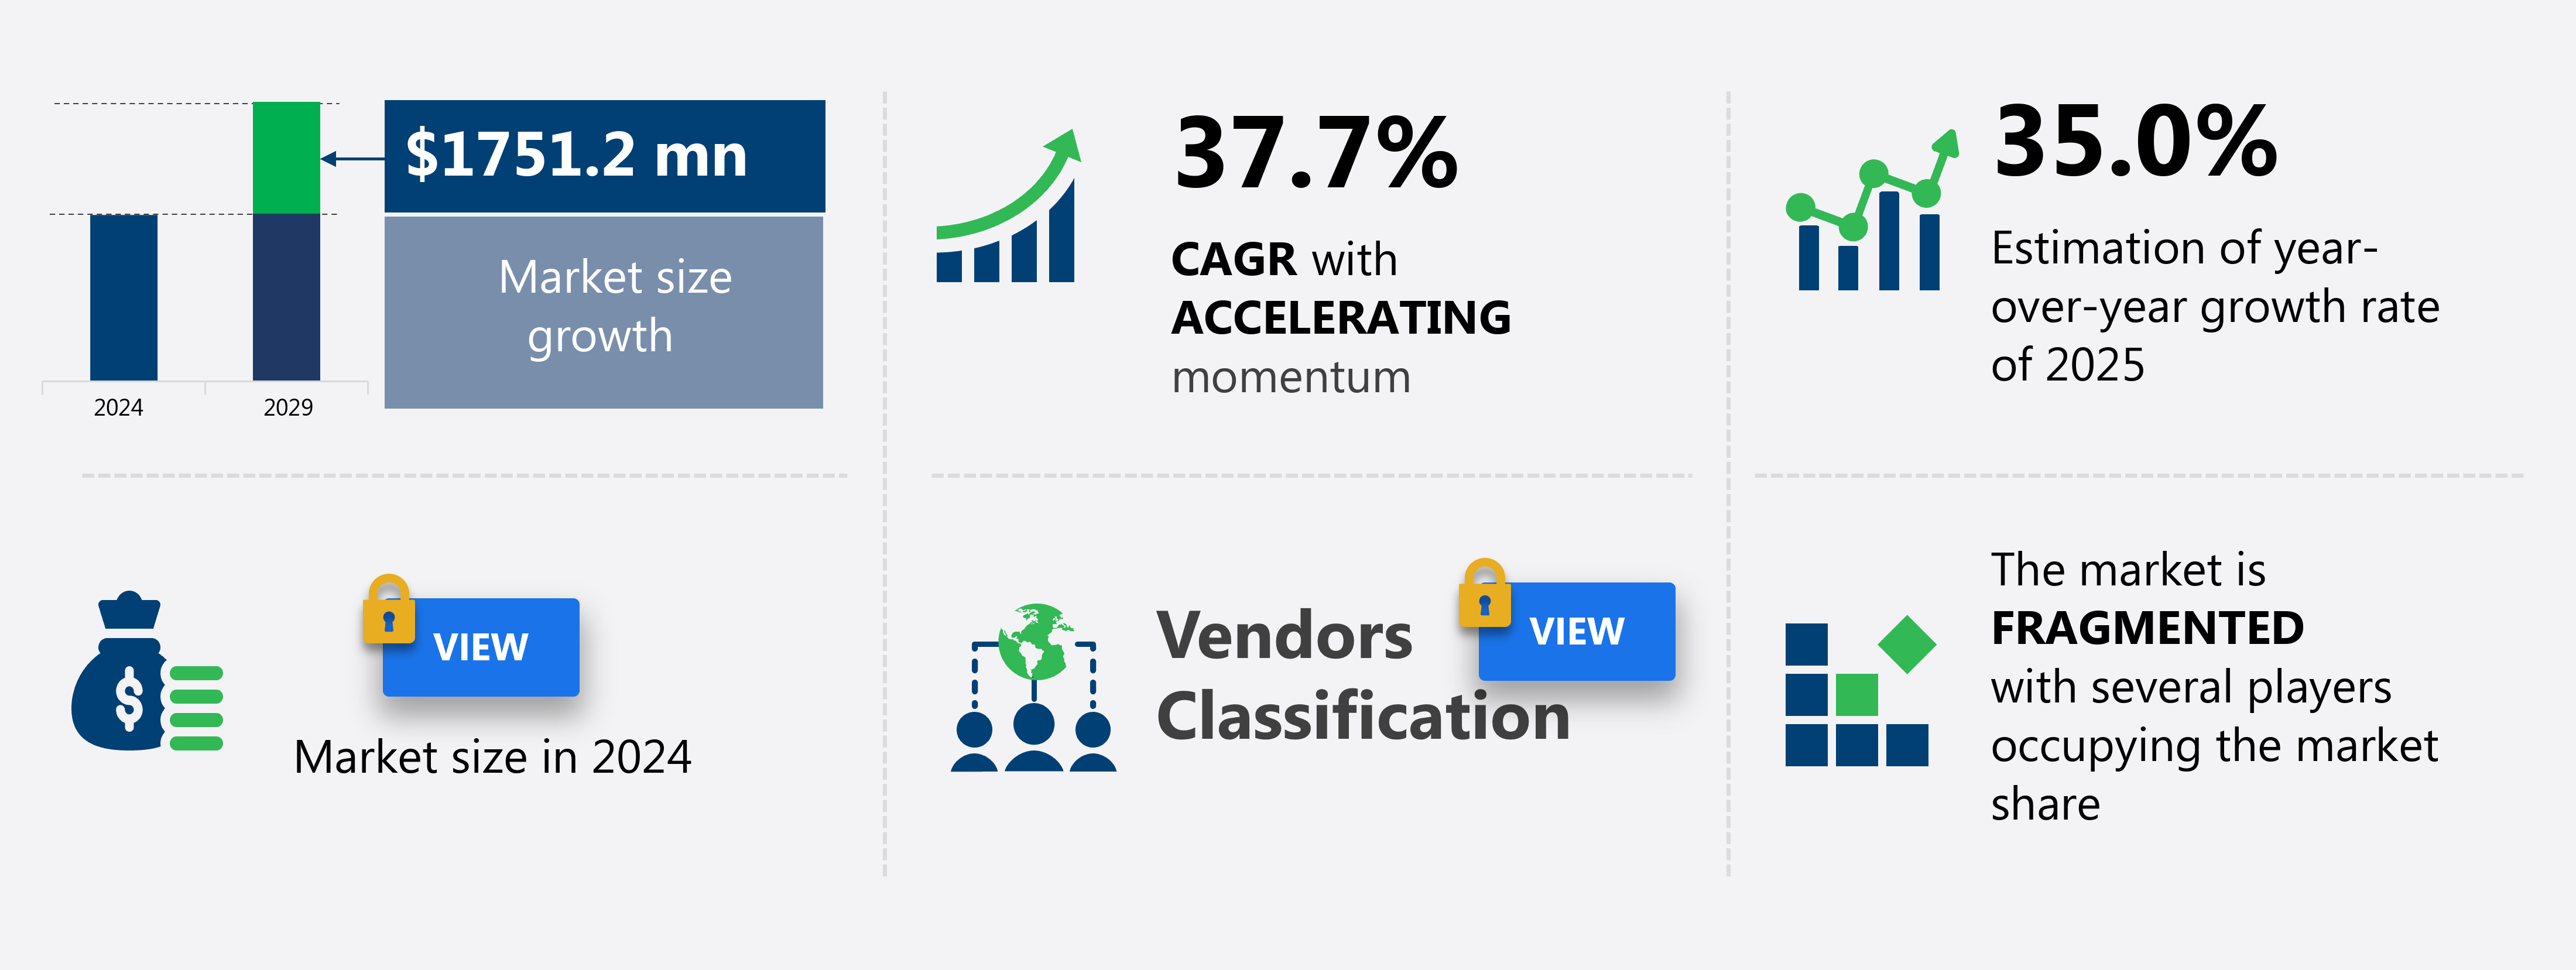
The generative AI in manufacturing market size is forecast to increase by USD 1.75 billion, at a CAGR of 37.7% between 2024 and 2029.
- The market is experiencing significant growth, driven by the imperative for accelerated product innovation and hyper-customization. Companies are increasingly adopting Generative AI to streamline their manufacturing processes, enabling them to produce customized products at scale and at a faster pace. The emergence of industrial copilots and augmented human intelligence is revolutionizing the manufacturing sector, allowing workers to focus on higher-value tasks while AI handles repetitive and routine tasks. However, the implementation of Generative AI in manufacturing also presents challenges. Autonomous mobile robots and automated logistics systems further enhance production efficiency.
- Additionally, the use of Generative AI in manufacturing raises questions about ownership and control of intellectual property. Companies must invest in robust cybersecurity measures and establish clear policies around data access and usage to mitigate these risks and ensure the ethical and secure use of Generative AI in manufacturing. Data security risks and the protection of intellectual property are major concerns. As AI systems become more sophisticated, there is a risk that sensitive data could be compromised.
What will be the Size of the Generative AI In Manufacturing Market during the forecast period?
Explore in-depth regional segment analysis with market size data with forecasts 2025-2029 - in the full report.
Request Free Sample
- The market for generative AI in manufacturing continues to evolve, with applications spanning various sectors. Green manufacturing initiatives are increasingly adopting predictive model deployment for process improvement methods, enabling significant energy savings. AI-based defect detection and intelligent process automation are revolutionizing automated quality assurance, leading to a 15% increase in production throughput for some manufacturers. Simulation for optimization and advanced manufacturing processes are driving efficiency gains, while smart factory connectivity facilitates real-time production insights and manufacturing data analytics.
- The industry anticipates a 12% annual growth rate as these technologies continue to unfold, shaping the future of manufacturing. A notable example includes a leading automotive manufacturer, which achieved a 20% increase in sales by integrating generative design applications into their product development process. PLM and MES system integration, robotics integration solutions, and AI-driven supply chain management are transforming manufacturing operations.
How is this Generative AI In Manufacturing Market segmented?
The generative AI in manufacturing market research report provides comprehensive data (region-wise segment analysis), with forecasts and estimates in "USD million" for the period 2025-2029,for the following segments.
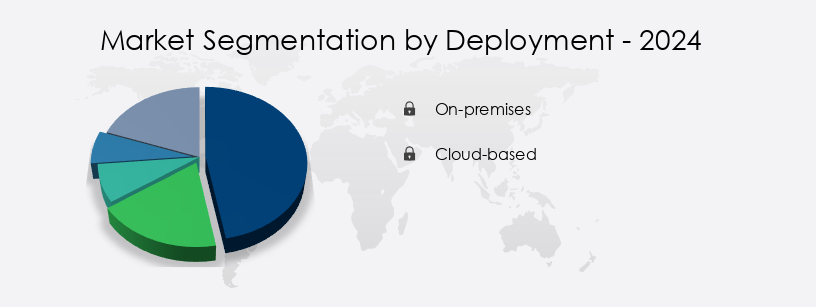
- Deployment
- On-premises
- Cloud-based
- Application
- Predictive maintenance
- Supply chain optimization
- Product design and development
- Customer services
- Others
- End-user
- Automotive
- Aerospace
- Electric and electronic
- FMCG
- Others
- Geography
- North America
- US
- Canada
- Europe
- France
- Germany
- UK
- APAC
- China
- India
- Japan
- South Korea
- South America
- Brazil
- Rest of World (ROW)
- North America
By Deployment Insights
The On-premises segment is estimated to witness significant growth during the forecast period. The on-premises segment is a significant and persistent part of the market. This model keeps all generative AI software, models, and high-performance computing infrastructure within the manufacturer's physical facilities or private data centers. The primary reason for this approach is the necessity to securely protect sensitive intellectual property. Industries like aerospace, defense, and automotive hold engineering schematics, proprietary material compositions, and advanced production process data as their core competitive advantages. By deploying on-premises, manufacturers create a secure, air-gapped environment that eliminates the risks of transmitting valuable data over public networks to third-party servers. This provides maximum protection against cyber threats and data breaches.
Smart control is achieved through reinforcement learning control, AI-powered process control systems, and machine learning algorithms for quality control. Data-driven decisions rely on IoT data for insights, industrial IoT platforms data integration, and data analytics dashboards for production insights. Optimization is enhanced through process optimization strategies, simulation and modeling, and simulation and modeling for process improvement. Connectivity and scalability are enabled by cloud manufacturing platforms, cloud-based manufacturing, and robust edge computing in factories supported by edge computing infrastructure. Integration with PLM system integration and material handling automation further boosts production throughput increase.
For instance, a leading automotive manufacturer reported a 45% increase in production line efficiency after implementing an on-premises AI-driven predictive maintenance system. The market is expected to grow by over 30% in the next five years, as industries increasingly adopt advanced technologies like predictive analytics models, computer vision systems, digital twin technology, and automated quality control to optimize production processes and enhance overall manufacturing performance.
Get Key Insights on Market Forecast (PDF)- Request Free Sample
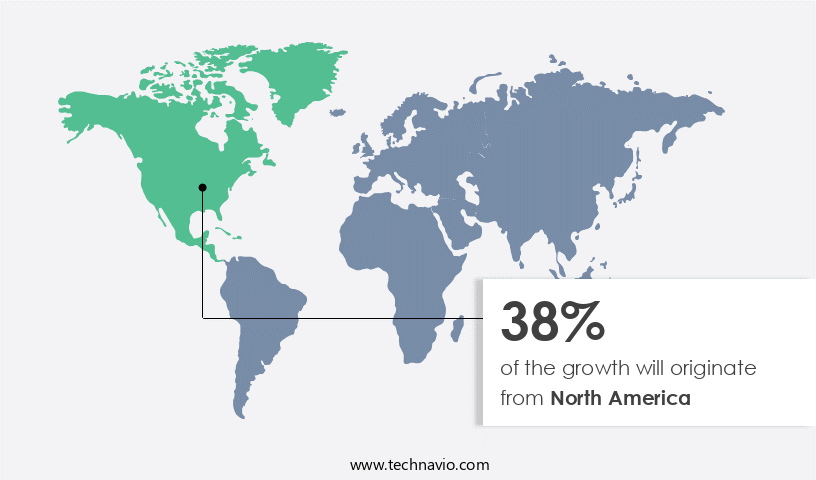
Regional Analysis
North America is estimated to contribute 38% to the growth of the global market during the forecast period. Technavio's analysts have elaborately explained the regional trends and drivers that shape the market during the forecast period.
See How generative AI in manufacturing market Demand is Rising in North America Request Free Sample
In the market, North America, spearheaded by the United States, holds the largest share. This dominance is driven by a robust technology sector, the presence of leading AI model developers and hardware providers, an industry culture favoring early adoption, and significant research and development investment. Notable players, such as NVIDIA, Microsoft, Google, and Amazon Web Services, based in this region, supply the fundamental computational infrastructure and advanced models essential for industrial applications worldwide. For instance, Microsoft's Azure Manufacturing Services has reported a 50% increase in sales due to the implementation of generative design software and AI-powered process control in manufacturing processes.
The Generative AI in Manufacturing Market is revolutionizing industrial operations by integrating smart technologies to enhance productivity, efficiency, and product innovation. The use of AI in manufacturing process supports intelligent automation and smarter decision-making. Applications like machine learning in factories and deep learning for vision are critical for real-time analytics and inspection, especially when combined with computer vision for inspection. Technologies such as 3D printing for tooling, additive manufacturing techniques, and GANs for product design are reshaping design and prototyping. The role of generative adversarial networks is expanding in creating high-performance product models. For real-time monitoring, a digital twin for production and a digital twin for real-time production monitoring provide virtual representations of manufacturing systems.
Furthermore, the market is projected to grow by 35% annually, as industries increasingly adopt predictive analytics models, computer vision systems, digital twin technology, and other advanced technologies to optimize production line efficiency, enhance real-time process monitoring, and improve overall manufacturing processes. These trends underscore the transformative potential of generative AI in manufacturing, with applications ranging from supply chain optimization and automated quality control to sustainable manufacturing practices and autonomous robots deployment.
Market Dynamics
Our researchers analyzed the data with 2024 as the base year, along with the key drivers, trends, and challenges. A holistic analysis of drivers will help companies refine their marketing strategies to gain a competitive advantage. The market is experiencing significant growth as businesses seek to leverage advanced technologies to enhance production efficiency and quality. AI-powered predictive maintenance scheduling is revolutionizing manufacturing processes by analyzing historical data and identifying potential equipment failures before they occur, reducing downtime and maintenance costs. Generative design for complex parts production utilizes machine learning algorithms to create optimized designs, reducing production time and material waste. Robotics process automation in assembly lines, integrated with computer vision systems for defect detection, ensures consistent quality and productivity. 3D printing optimization for rapid prototyping utilizes AI to optimize production parameters, reducing lead times and production costs.
Digital twin technology enables real-time production monitoring and simulation, allowing for process improvement and predictive analytics models for maintenance. AI-driven supply chain optimization strategies utilize industrial IoT platforms for data integration and smart factory integration and automation. Automated quality control using computer vision systems and data analytics dashboards provide production insights, while predictive analytics models for maintenance ensure equipment is running at optimal performance. Deep learning applications in manufacturing, such as natural language processing for production reports, enable faster and more accurate data analysis. Reinforcement learning for process optimization uses real-time process monitoring and control to continuously improve production processes.
Autonomous mobile robots in warehousing streamline logistics and inventory management, further enhancing manufacturing efficiency. Overall, the market offers significant potential for businesses seeking to improve production processes, reduce costs, and enhance product quality.
What are the key market drivers leading to the rise in the adoption of Generative AI In Manufacturing Industry?
- Rising competition and the growing demand for personalized, sustainable products is the primary catalyst for the adoption of Generative AI in Manufacturing, making it a significant market driver. This approach not only sets companies apart from competitors but also caters to the unique needs and preferences of consumers. This environment has rendered traditional, linear product development cycles, which often span months or years, increasingly untenable. A primary and powerful driver for the adoption of generative AI is its unparalleled ability to radically accelerate innovation and enable hyper-customization at scale. The technology, particularly through the application of generative design, fundamentally reinvents the engineering process. Therefore, making this a mandatory focus for businesses is key to staying competitive and thriving in the market.
- According to recent studies, the market is expected to grow by over 25% in the next five years. For instance, a leading automotive manufacturer reported a 15% reduction in design time and a 10% increase in sales after implementing generative design. This technology's potential is immense, offering manufacturers a competitive edge in today's dynamic market. This technology, particularly through generative design, revolutionizes the engineering process. Instead of engineers manually designing and refining a single solution in a computer-aided design environment, they now define the problem's strategic parameters: function, material properties, load constraints, manufacturing methods, and cost targets.
What are the market trends shaping the Generative AI In Manufacturing Industry?
- The emergence of industrial copilots and augmented human intelligence represents the latest market trend in technology. This innovation combines the strengths of artificial intelligence and human intelligence to enhance productivity and efficiency in industries. The market is experiencing significant growth, with industry experts projecting a 12% expansion in the next year. A pivotal trend shaping this sector is the transition from traditional automation to human-AI collaboration. Instead of viewing AI as a replacement for human labor, manufacturers are integrating advanced industrial copilots into their operations.
- Notably, a leading manufacturing company reported a 15% increase in sales due to the implementation of these copilots. These intelligent tools are seamlessly integrated into existing software platforms, such as product lifecycle management systems, manufacturing execution systems, and computer-aided design software, ensuring a smooth transition for manufacturers. These context-aware AI assistants augment the capabilities of the workforce, handling complex data processing, generating insights, and automating cognitive tasks.
What challenges does the Generative AI In Manufacturing Industry face during its growth?
- Protecting against data security risks and safeguarding intellectual property remains a critical concern, posing significant challenges to the sustainable growth of the market. These challenges demand the attention and expertise of professionals to ensure the integrity of critical information and maintain a competitive edge. Generative AI holds immense promise for manufacturing, offering enhanced productivity and innovation. However, its adoption faces a significant hurdle: data security concerns. Manufacturers guard their proprietary data fiercely, encompassing CAD files, engineering schematics, material compositions, process parameters, and factory layouts.
- For instance, a study revealed that 43% of manufacturing companies experienced at least one data breach in the past year. With the manufacturing industry expected to grow by 3.6% in 2023, the stakes are high for organizations to address these concerns effectively and securely adopt generative AI technologies. The use of generative AI, especially models on public cloud platforms, necessitates transmitting this valuable data to external servers for processing. This poses a substantial risk for many organizations, with potential data breaches, industrial espionage, and inadvertent data leaks through shared tenancy cloud environments being primary deterrents.
Exclusive Customer Landscape
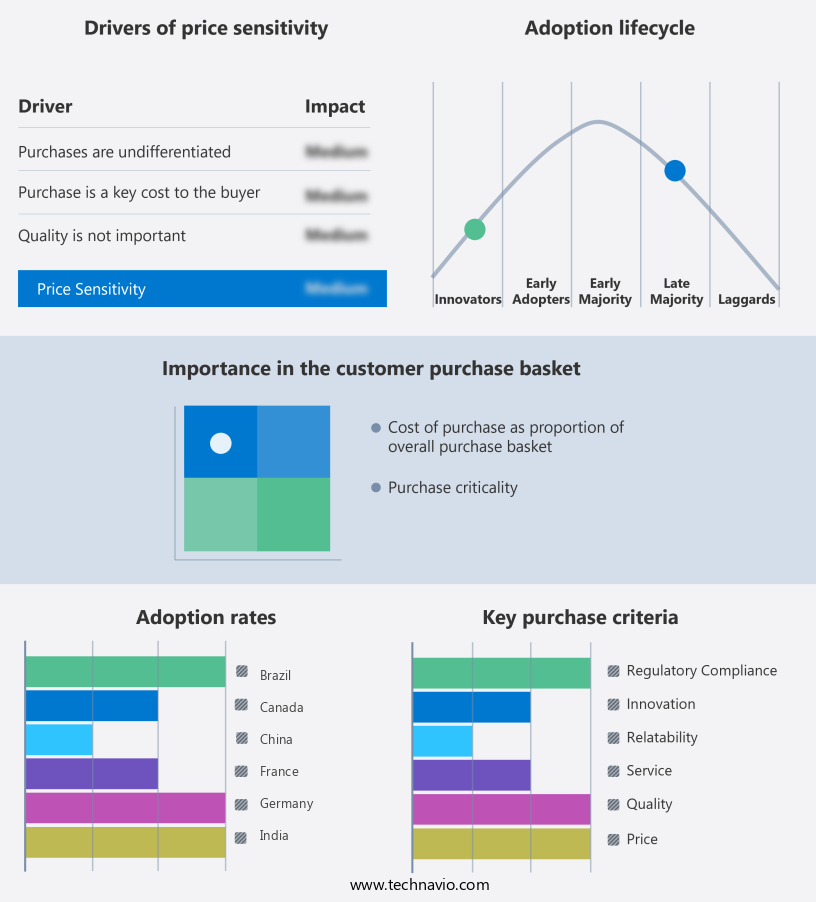
The generative AI in manufacturing market forecasting report includes the adoption lifecycle of the market, covering from the innovator's stage to the laggard's stage. It focuses on adoption rates in different regions based on penetration. Furthermore, the generative AI in manufacturing market report also includes key purchase criteria and drivers of price sensitivity to help companies evaluate and develop their market growth analysis strategies.
Customer Landscape
Key Companies & Market Insights
Companies are implementing various strategies, such as strategic alliances, generative AI in manufacturing market forecast, partnerships, mergers and acquisitions, geographical expansion, and product/service launches, to enhance their presence in the industry.
AB SKF - The company's Industry X division leverages advanced generative AI in manufacturing, featuring multi-agent orchestration, operations twins, and virtual mentors.
The industry research and growth report includes detailed analyses of the competitive landscape of the market and information about key companies, including:
- AB SKF
- Accenture PLC
- Alphabet Inc.
- Augury Inc.
- Autodesk Inc.
- AVEVA Group Plc
- C3.ai Inc.
- Capgemini Service SAS
- Cisco Systems Inc.
- cogniac
- Cognizant Technology Solutions Corp.
- Deloitte Touche Tohmatsu Ltd.
- General Electric Co.
- International Business Machines Corp.
- Microsoft Corp.
- NVIDIA Corp.
- Oracle Corp.
- Rescale Inc.
- SAP SE
- Siemens AG
Qualitative and quantitative analysis of companies has been conducted to help clients understand the wider business environment as well as the strengths and weaknesses of key industry players. Data is qualitatively analyzed to categorize companies as pure play, category-focused, industry-focused, and diversified; it is quantitatively analyzed to categorize companies as dominant, leading, strong, tentative, and weak.
Recent Development and News in Generative AI In Manufacturing Market
- In January 2024, Siemens Digital Industries Software and Autodesk announced a strategic partnership to integrate Generative Design capabilities into Siemens' NX software, allowing manufacturers to automate design processes and optimize product performance (Siemens Press Release, 2024).
- In March 2024, GE Aviation and DeepMind, a Google-owned AI research lab, collaborated to apply generative AI to jet engine design, aiming to improve engine efficiency and reduce development time (GE Aviation Press Release, 2024).
- In May 2024, PTC secured a USD 100 million investment from Koch Industries to accelerate the development and deployment of its generative AI solutions for manufacturing industries (PTC Press Release, 2024).
- In April 2025, Sikorsky, a Lockheed Martin company, received regulatory approval from the Federal Aviation Administration (FAA) to test autonomous helicopter designs generated using generative AI, marking a significant step towards the integration of AI in aerospace manufacturing (Lockheed Martin Press Release, 2025).
Research Analyst Overview
- The market for generative AI in manufacturing continues to evolve, with applications spanning various sectors. Green manufacturing initiatives are increasingly adopting predictive model deployment for process improvement methods, enabling significant energy savings. AI-based defect detection and intelligent process automation are revolutionizing automated quality assurance, leading to a 15% increase in production throughput for some manufacturers. Simulation for optimization and advanced manufacturing processes are driving efficiency gains, while smart factory connectivity facilitates real-time production insights and manufacturing data analytics.
- The industry anticipates a 12% annual growth rate as these technologies continue to unfold, shaping the future of manufacturing. A notable example includes a leading automotive manufacturer, which achieved a 20% increase in sales by integrating generative design applications into their product development process. PLM and MES system integration, robotics integration solutions, and AI-driven supply chain management are transforming manufacturing operations. Autonomous mobile robots and automated logistics systems further enhance production efficiency.
Dive into Technavio's robust research methodology, blending expert interviews, extensive data synthesis, and validated models for unparalleled Generative AI In Manufacturing Market insights. See full methodology.
|
Market Scope |
|
|
Report Coverage |
Details |
|
Page number |
243 |
|
Base year |
2024 |
|
Forecast period |
2025-2029 |
|
Growth momentum & CAGR |
Accelerate at a CAGR of 37.7% |
|
Market growth 2025-2029 |
USD 1.75 billion |
|
Market structure |
Fragmented |
|
YoY growth 2024-2025(%) |
35.0 |
|
Key countries |
China, Japan, India, South Korea, Germany, UK, France, US, Canada, and Brazil |
|
Competitive landscape |
Leading Companies, Market Positioning of Companies, Competitive Strategies, and Industry Risks |
What are the Key Data Covered in this Generative AI In Manufacturing Market Research and Growth Report?
- CAGR of the Generative AI In Manufacturing industry during the forecast period
- Detailed information on factors that will drive the growth and forecasting between 2025 and 2029
- Precise estimation of the size of the market and its contribution of the industry in focus to the parent market
- Accurate predictions about upcoming growth and trends and changes in consumer behaviour
- Growth of the market across North America, Europe, APAC, South America, and Middle East and Africa
- Thorough analysis of the market's competitive landscape and detailed information about companies
- Comprehensive analysis of factors that will challenge the generative AI in manufacturing market growth of industry companies
We can help! Our analysts can customize this generative AI in manufacturing market research report to meet your requirements.
 RIA -
RIA - 
