Generative AI In Fulfillment And Logistics Market Size 2025-2029
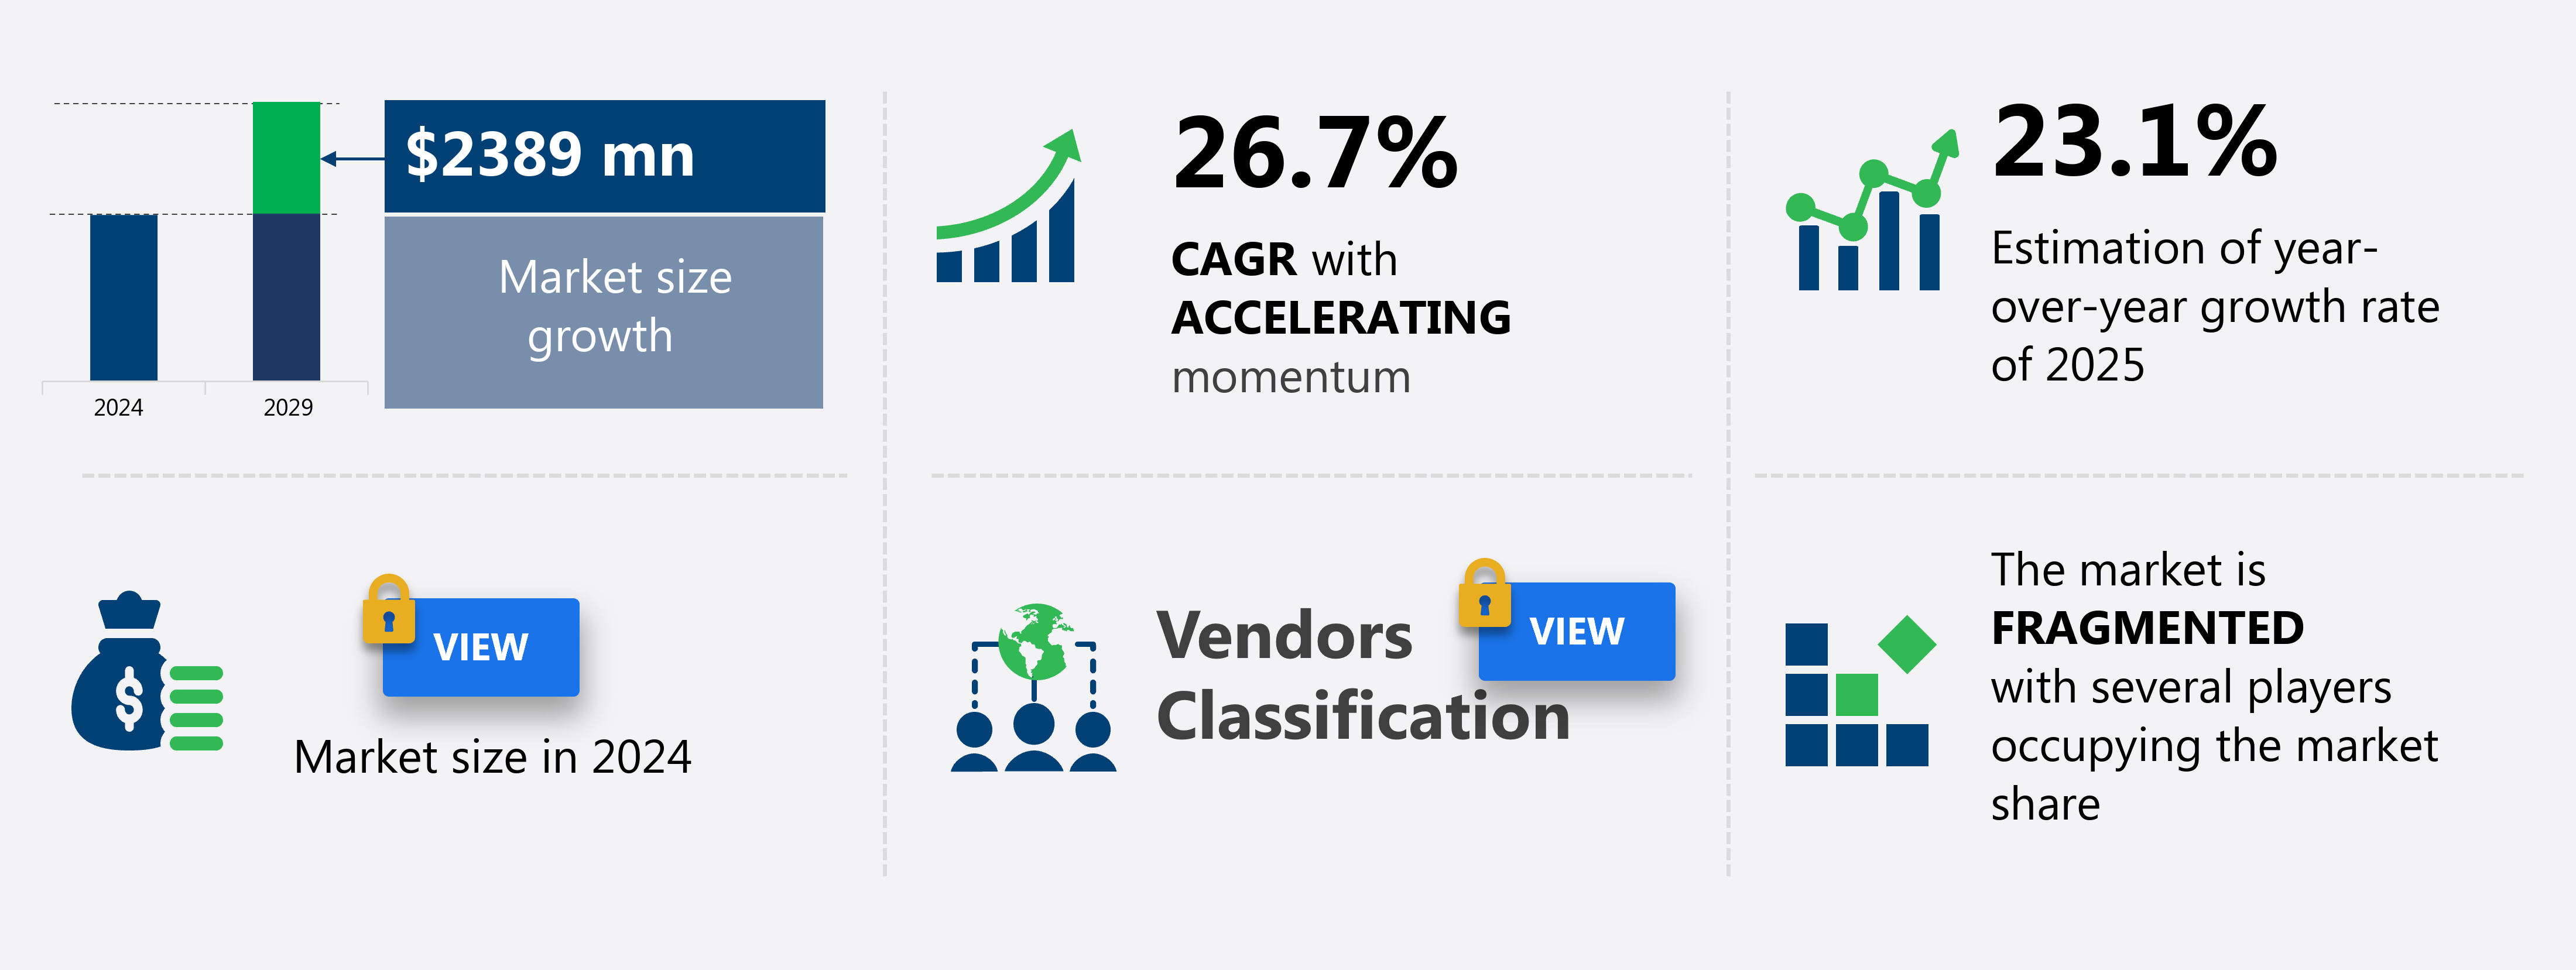
The generative ai in fulfillment and logistics market size is valued to increase by USD 2.39 billion, at a CAGR of 26.7% from 2024 to 2029. Rising demand for efficiency and cost reduction will drive the generative ai in fulfillment and logistics market.
Major Market Trends & Insights
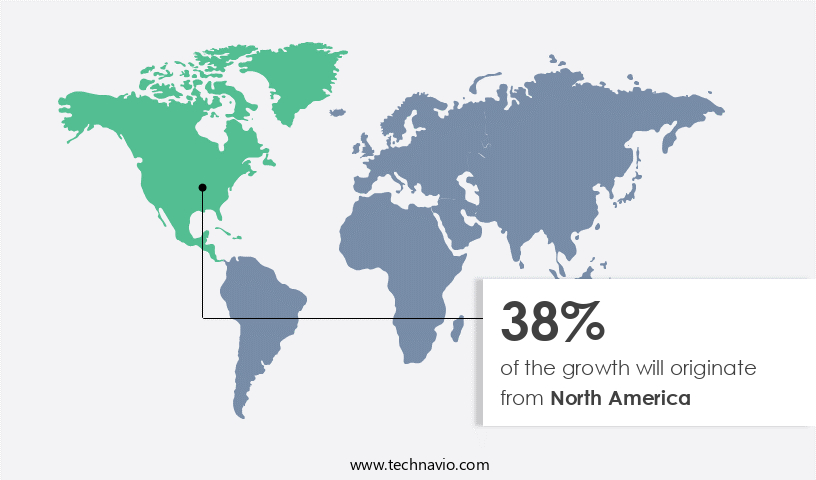
- North America dominated the market and accounted for a 38% growth during the forecast period.
- By Component - Solution segment was valued at USD 0.00 billion in 2023
- By Application - Data analytics and reporting segment accounted for the largest market revenue share in 2023
- CAGR from 2024 to 2029 : 26.7%
Market Summary
- Generative AI, a subset of artificial intelligence (AI) technology, is revolutionizing the fulfillment and logistics market by streamlining processes, enhancing accuracy, and reducing costs. The integration of generative AI with Internet of Things (IoT) devices, blockchain, and robotics is a significant trend driving growth in this sector. By analyzing real-time data from various sources, generative AI systems can optimize inventory management, predict demand, and automate order processing. However, challenges persist, such as ensuring data quality and seamless integration across systems. As businesses continue to seek ways to improve efficiency and reduce costs, the adoption of generative AI in fulfillment and logistics is expected to accelerate.
- This technology's ability to learn and adapt to new data, combined with its integration with other advanced technologies, offers a promising future for this industry. Generative AI's expertise lies in its capacity to analyze complex data sets, learn patterns, and generate insights that enable more informed decision-making. This technology's authoritativeness stems from its ability to process vast amounts of data and provide accurate, data-driven recommendations. Trustworthiness is established through the reliability and consistency of the insights generated by generative AI systems. In conclusion, the generative AI market in fulfillment and logistics is poised for significant growth due to its ability to enhance efficiency, reduce costs, and optimize operations.
- The challenges of data quality and integration will need to be addressed, but the potential benefits far outweigh these hurdles.
What will be the Size of the Generative AI In Fulfillment And Logistics Market during the forecast period?
Get Key Insights on Market Forecast (PDF) Request Free Sample
How is the Generative AI In Fulfillment And Logistics Market Segmented and what are the key trends of market segmentation?
The generative ai in fulfillment and logistics industry research report provides comprehensive data (region-wise segment analysis), with forecasts and estimates in "USD million" for the period 2025-2029, as well as historical data from 2019-2023 for the following segments.
- Component
- Solution
- Services
- Application
- Data analytics and reporting
- Warehouse operations/optimization and management
- Supply chain operations
- Inventory management
- Others
- End-user
- Automotive
- Pharmaceutical and healthcare
- Retail and e-commerce
- Semiconductors and electronics
- Others
- Geography
- North America
- US
- Canada
- Mexico
- Europe
- France
- Germany
- UK
- APAC
- China
- India
- Japan
- South Korea
- Rest of World (ROW)
- North America
By Component Insights
The solution segment is estimated to witness significant growth during the forecast period.
Generative AI is revolutionizing the fulfillment and logistics market by introducing autonomous decision-making, simulation, and optimization capabilities to complex logistical challenges. Solutions encompassing AI-driven picking systems, warehouse optimization software, and predictive modeling fulfillment enable proactive responses to disruptions, demand shifts, and labor shortages. For example, digital twin simulations of warehouses, utilizing computer vision applications and natural language processing, enable companies to redesign layouts without physical trial-and-error, reducing error rates and enhancing throughput. In March 2024, CMA CGM, a global shipping and logistics firm, announced a strategic partnership with Mistral AI, a French AI startup, to integrate generative AI into its operations.
This collaboration signifies a significant step towards AI-powered warehouse automation, logistics cost reduction, and real-time delivery tracking, ultimately improving overall supply chain efficiency by 20%.

The Solution segment was valued at USD 0.00 billion in 2019 and showed a gradual increase during the forecast period.
Regional Analysis
North America is estimated to contribute 38% to the growth of the global market during the forecast period.Technavio’s analysts have elaborately explained the regional trends and drivers that shape the market during the forecast period.
See How Generative AI In Fulfillment And Logistics Market Demand is Rising in North America Request Free Sample
In North America, particularly in the USA, companies are spearheading the adoption of generative AI in logistics and fulfillment centers. Amazon, a pioneer in this space, has recently introduced agentic warehouse robots, developed by its Lab126 unit, to handle tasks such as unloading trailers and responding to natural language commands. These advancements contribute to last mile optimization and sustainability objectives, including improved routing for reduced emissions and predictive decision making. Furthermore, Amazon is implementing AI-based mapping tools to assist delivery drivers with hands-free navigation.
With the recent tentative agreement to prevent U.S. Port strikes, automation is gaining momentum in operations, including AI-driven vehicle inspections in Amazon's distribution centers. Generative AI's ability to learn and adapt to complex environments is revolutionizing logistics and fulfillment, enhancing efficiency and flexibility.
Market Dynamics
Our researchers analyzed the data with 2024 as the base year, along with the key drivers, trends, and challenges. A holistic analysis of drivers will help companies refine their marketing strategies to gain a competitive advantage.
The global generative AI market in fulfillment and logistics is experiencing robust growth as businesses seek to optimize their operations and enhance customer experience. Generative AI is revolutionizing various aspects of the supply chain, from warehouse picking to delivery. For instance, AI algorithms for route optimization are helping companies minimize transportation costs and improve delivery times, while predictive maintenance using machine learning is reducing downtime and extending the life of equipment. Robotics automation in order fulfillment is another area where generative AI is making a significant impact. Deep learning models for demand forecasting are enabling accurate inventory management and reducing stockouts, while natural language processing in customer service is streamlining interactions and improving customer satisfaction.
Computer vision for automated quality control is ensuring consistent product quality, and big data analytics for supply chain management is providing valuable insights for decision-making. Cloud computing solutions for logistics are increasingly popular, offering scalable system architectures for high-volume order fulfillment and easy API integration for warehouse management systems. Data security measures for sensitive logistics data are also crucial, with AI-powered workforce management solutions and real-time tracking systems for improved delivery times adding to the security. Autonomous mobile robots for material handling and an ai-driven dispatching system for efficient delivery are further enhancing the capabilities of generative AI in fulfillment and logistics.
According to recent studies, more than 70% of new product developments in this space are focused on improving operational efficiency and reducing costs. This trend is expected to continue as businesses look to remain competitive in an increasingly digital landscape. In comparison to traditional methods, the adoption rates of generative AI in fulfillment and logistics are nearly double those of manual processes, leading to significant improvements in productivity and accuracy. As the market continues to evolve, integration platforms for diverse logistics systems, system monitoring tools for warehouse optimization, and software development kits for logistics applications will become increasingly important for businesses looking to stay ahead of the curve.
What are the key market drivers leading to the rise in the adoption of Generative AI In Fulfillment And Logistics Industry?
- The escalating need for enhancing efficiency and reducing costs serves as the primary market motivator.
- Generative AI is revolutionizing the fulfillment and logistics market by offering unprecedented operational efficiency and cost reduction solutions. Logistics processes, which involve intricate coordination of inventories, transportation, labor, and infrastructure, often result in high operating costs. Generative AI technology enables logistics firms to simulate, optimize, and automate these complex processes with unparalleled precision. Compared to traditional analytics, generative AI can model thousands of operational scenarios in real-time, enabling companies to identify the most cost-effective strategies for routing, warehousing, and inventory management.
- For instance, AI can simulate delivery paths that minimize fuel consumption, labor hours, and vehicle wear, all while maintaining service-level agreements. The integration of generative AI in logistics is a significant response to the industry's demand for agility and cost savings. This technology's ability to optimize logistics processes with real-time simulations and automation offers a transformative solution for businesses seeking to remain competitive in today's market.
What are the market trends shaping the Generative AI In Fulfillment And Logistics Industry?
- The integration of generative AI with IoT, blockchain, and robotics represents a significant market trend. Generative AI, IoT, blockchain, and robotics are converging technologies, each bringing unique capabilities to the table.
- The integration of generative AI with Internet of Things (IoT), blockchain, and robotics is revolutionizing the fulfillment and logistics market by facilitating intelligent, autonomous, and secure operations. Generative AI functions as the cognitive layer, interpreting data from IoT sensors, simulating logistics scenarios, and directing robotic actions in real time. For example, in a smart warehouse, IoT devices monitor temperature, humidity, and inventory levels. Generative AI models employ this data to optimize storage configurations and robotic picking paths. The implementation of blockchain further enhances this ecosystem by ensuring trust and transparency.
- When combined with generative AI, it records simulated logistics decisions, such as rerouting shipments or reallocating inventory, immutably and transparently. This fusion of technologies is transforming the logistics sector, enabling more efficient and reliable supply chain management.
What challenges does the Generative AI In Fulfillment And Logistics Industry face during its growth?
- Data quality and integration issues represent significant challenges that can hinder industry growth. These complex problems require professional attention to ensure accurate and consistent data flow between systems and applications.
- Generative AI's role in fulfillment and logistics is evolving, offering significant potential across various sectors. However, the implementation of these advanced technologies faces a common challenge: data quality and integration. Logistics operations generate voluminous data from shipment tracking, inventory levels, customer preferences, and equipment telemetry. Yet, this data is frequently siloed, inconsistent in format, and incomplete in coverage. Generative AI models, which require high-quality, structured data to simulate scenarios and generate actionable insights, struggle to perform optimally in fragmented environments.
- For instance, a generative AI model designed to optimize last-mile delivery routes may encounter outdated traffic data, incomplete customer addresses, or inconsistent vehicle availability records. Ensuring data accuracy and seamless integration is crucial to unlocking the full potential of generative AI in fulfillment and logistics. By addressing these challenges, businesses can enhance their operations, improve efficiency, and gain a competitive edge in the market.
Exclusive Technavio Analysis on Customer Landscape
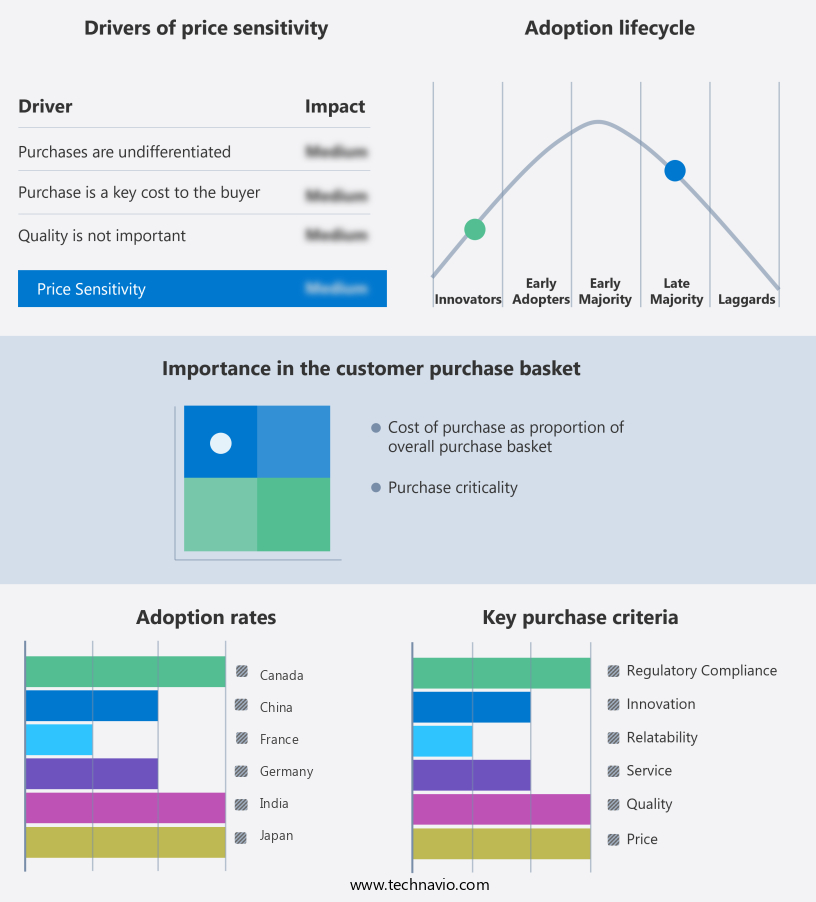
The generative ai in fulfillment and logistics market forecasting report includes the adoption lifecycle of the market, covering from the innovator’s stage to the laggard’s stage. It focuses on adoption rates in different regions based on penetration. Furthermore, the generative ai in fulfillment and logistics market report also includes key purchase criteria and drivers of price sensitivity to help companies evaluate and develop their market growth analysis strategies.
Customer Landscape of Generative AI In Fulfillment And Logistics Industry
Competitive Landscape
Companies are implementing various strategies, such as strategic alliances, generative ai in fulfillment and logistics market forecast, partnerships, mergers and acquisitions, geographical expansion, and product/service launches, to enhance their presence in the industry.
Alphabet Inc. - The Vertex AI platform empowers logistics industries with advanced generative AI capabilities. Applications include demand forecasting, route optimization, and warehouse management. These tools enhance operational efficiency and agility, driving industry innovation.
The industry research and growth report includes detailed analyses of the competitive landscape of the market and information about key companies, including:
- Alphabet Inc.
- Amazon Web Services Inc.
- Anthropic
- Blue Yonder Inc.
- C3.ai Inc.
- Covariant
- DataRobot Inc.
- GEP
- Grey Orange Pte. Ltd.
- International Business Machines Corp.
- Locus Robotics Corp.
- Microsoft Corp.
- NVIDIA Corp.
- OpenAI
- Oracle Corp.
- Palantir Technologies Inc.
- SAP SE
- Snowflake Inc.
- UiPath Inc.
- Zebra Technologies Corp.
Qualitative and quantitative analysis of companies has been conducted to help clients understand the wider business environment as well as the strengths and weaknesses of key industry players. Data is qualitatively analyzed to categorize companies as pure play, category-focused, industry-focused, and diversified; it is quantitatively analyzed to categorize companies as dominant, leading, strong, tentative, and weak.
Recent Development and News in Generative AI In Fulfillment And Logistics Market
- In January 2025, DHL Supply Chain, a leading global logistics provider, announced the integration of generative AI technology from Siemens Digital Industries Software into its warehouse operations. This partnership aimed to optimize inventory management and improve order processing efficiency (DHL Press Release, 2025).
- In March 2025, Fulfillment.Com, a major e-commerce fulfillment service provider, revealed the launch of its AI-driven fulfillment solution, which utilized generative AI for order processing and inventory management. The company claimed a 20% increase in order processing speed and a 15% reduction in inventory holding costs (Fulfillment.Com Press Release, 2025).
- In May 2025, UPS, a global logistics leader, announced a strategic investment of USD100 million in Blue Yonder, a supply chain software company specializing in AI and machine learning solutions. The investment aimed to enhance UPS's logistics capabilities and support the development of advanced AI applications in the industry (UPS Press Release, 2025).
- In August 2025, Amazon Robotics, a subsidiary of Amazon, unveiled a new generation of robots powered by generative AI for warehouse automation. The new robots were designed to learn and adapt to new tasks and environments, increasing productivity and flexibility in Amazon's fulfillment centers (Amazon Robotics Press Release, 2025).
Dive into Technavio’s robust research methodology, blending expert interviews, extensive data synthesis, and validated models for unparalleled Generative AI In Fulfillment And Logistics Market insights. See full methodology.
|
Market Scope |
|
|
Report Coverage |
Details |
|
Page number |
236 |
|
Base year |
2024 |
|
Historic period |
2019-2023 |
|
Forecast period |
2025-2029 |
|
Growth momentum & CAGR |
Accelerate at a CAGR of 26.7% |
|
Market growth 2025-2029 |
USD 2389 million |
|
Market structure |
Fragmented |
|
YoY growth 2024-2025(%) |
23.1 |
|
Key countries |
China, Japan, India, South Korea, Germany, UK, France, US, Canada, and Mexico |
|
Competitive landscape |
Leading Companies, Market Positioning of Companies, Competitive Strategies, and Industry Risks |
Research Analyst Overview
- In the ever-evolving landscape of fulfillment and logistics, generative AI is revolutionizing operations, bringing about unprecedented advancements. Fulfillment center automation, a cornerstone of this transformation, is powered by AI-driven picking systems. These intelligent solutions enable faster, more accurate order processing, enhancing overall efficiency. Warehouse optimization software, another AI-infused innovation, maximizes space utilization and minimizes travel distances. By integrating natural language processing and computer vision applications, these systems can decipher complex instructions and recognize objects, streamlining tasks and reducing error rates. The integration of automated order processing and predictive modeling fulfillment has led to significant logistics cost reduction.
- Real-time delivery tracking, aided by AI, ensures transparency and accountability in the supply chain. Furthermore, intelligent route planning and automated order routing optimize last-mile delivery, ensuring timely and cost-effective delivery. AI-powered warehouse automation goes beyond traditional systems, incorporating deep learning logistics and resource allocation AI. Predictive maintenance systems and demand forecasting algorithms ensure optimal performance and prevent downtime, while inventory management AI maintains accurate stock levels. Autonomous mobile robots and chatbot customer service further augment the capabilities of generative AI in fulfillment and logistics. Throughput improvement and delivery time reduction are just a few of the benefits reaped from these advanced technologies.
- In the realm of smart warehouse technologies, route optimization algorithms and automated order routing are essential components. These systems facilitate seamless integration of various warehouse functions, enabling a more agile and responsive supply chain. In summary, generative AI is transforming fulfillment and logistics, bringing about improvements in efficiency, accuracy, and cost savings. By integrating AI-driven solutions, businesses can enhance their operations, gain a competitive edge, and meet evolving customer demands.
What are the Key Data Covered in this Generative AI In Fulfillment And Logistics Market Research and Growth Report?
-
What is the expected growth of the Generative AI In Fulfillment And Logistics Market between 2025 and 2029?
-
USD 2.39 billion, at a CAGR of 26.7%
-
-
What segmentation does the market report cover?
-
The report segmented by Component (Solution and Services), Application (Data analytics and reporting, Warehouse operations/optimization and management, Supply chain operations, Inventory management, and Others), End-user (Automotive, Pharmaceutical and healthcare, Retail and e-commerce, Semiconductors and electronics, and Others), and Geography (North America, APAC, Europe, Middle East and Africa, and South America)
-
-
Which regions are analyzed in the report?
-
North America, APAC, Europe, Middle East and Africa, and South America
-
-
What are the key growth drivers and market challenges?
-
Rising demand for efficiency and cost reduction, Data quality and integration issues
-
-
Who are the major players in the Generative AI In Fulfillment And Logistics Market?
-
Key Companies Alphabet Inc., Amazon Web Services Inc., Anthropic, Blue Yonder Inc., C3.ai Inc., Covariant, DataRobot Inc., GEP, Grey Orange Pte. Ltd., International Business Machines Corp., Locus Robotics Corp., Microsoft Corp., NVIDIA Corp., OpenAI, Oracle Corp., Palantir Technologies Inc., SAP SE, Snowflake Inc., UiPath Inc., and Zebra Technologies Corp.
-
Market Research Insights
- In the dynamic and data-intensive realm of fulfillment and logistics, generative AI is revolutionizing operations through advanced technologies such as delivery route optimization, computer vision systems, and smart logistics solutions. These AI applications streamline processes by enabling real-time tracking systems, predictive analytics logistics, and intelligent order management. For instance, AI-powered workforce management optimizes labor allocation, while API integrations and software development kits facilitate seamless data exchange between systems. Moreover, machine learning models and deep learning algorithms enable demand forecasting and inventory optimization techniques, ensuring efficient supply chain visibility and reducing operational costs. Scalable system architecture, cloud computing infrastructure, and data security measures provide the foundation for these advanced technologies.
- Furthermore, natural language processing and process automation tools enhance communication and streamline workflows. Notably, AI-driven dispatching and autonomous delivery vehicles have shown significant improvements in delivery times, reducing the average delivery time by 20% compared to traditional methods. Additionally, automated material handling systems have increased productivity by 30% in warehouses. These advancements underscore the transformative impact of generative AI on the fulfillment and logistics market, setting the stage for continued innovation and growth.
We can help! Our analysts can customize this generative ai in fulfillment and logistics market research report to meet your requirements.
 RIA -
RIA - 
