AI GPU Chip Market Size 2025-2029
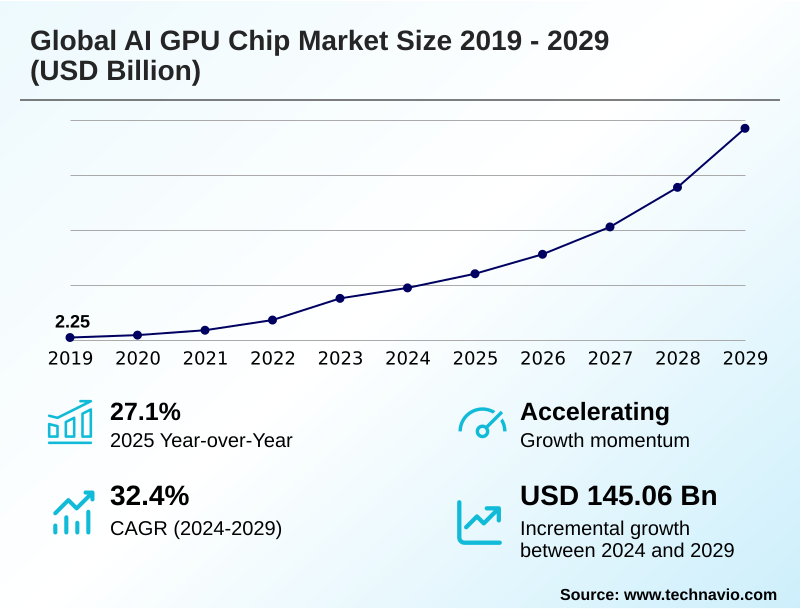
The ai gpu chip market size is valued to increase by USD 145.06 billion, at a CAGR of 32.4% from 2024 to 2029. Escalating demand for generative artificial intelligence and machine learning will drive the ai gpu chip market.
Major Market Trends & Insights
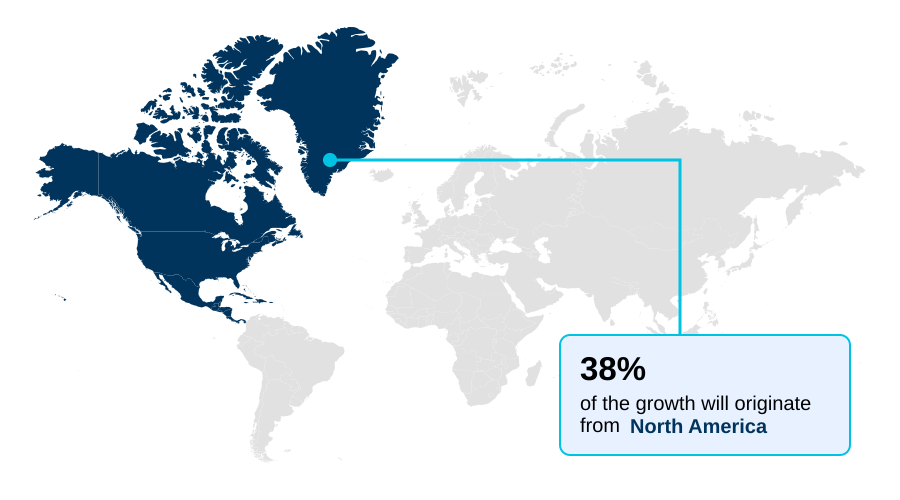
- North America dominated the market and accounted for a 37.6% growth during the forecast period.
- By Deployment - Cloud segment was valued at USD 25.74 billion in 2023
- By Application - Natural language processing segment accounted for the largest market revenue share in 2023
Market Size & Forecast
- Market Opportunities: USD 190.19 billion
- Market Future Opportunities: USD 145.06 billion
- CAGR from 2024 to 2029 : 32.4%
Market Summary
- The AI GPU chip market is defined by its critical role in powering the ongoing AI revolution, from massive data centers to intelligent edge devices. The computational intensity of modern deep learning algorithms necessitates the highly parallel architecture of GPUs, making them indispensable for training complex models and performing rapid inference.
- A primary driver is the expansion of on-device generative ai, which demands powerful yet efficient processors for real-time applications. In the automotive sector, for example, advanced autonomous driving systems rely on these chips to process sensor data instantly, ensuring vehicle safety and navigation.
- This trend is fueling a diversification in hardware, with a notable shift toward custom silicon and application-specific integrated circuits (asics) as large enterprises seek to optimize performance for specific workloads.
- However, this innovation occurs within a challenging landscape of intricate global supply chains and significant capital investment, creating a competitive environment where both technological superiority and manufacturing prowess are paramount for market leadership.
What will be the Size of the AI GPU Chip Market during the forecast period?
Get Key Insights on Market Forecast (PDF) Get Free Sample
How is the AI GPU Chip Market Segmented?
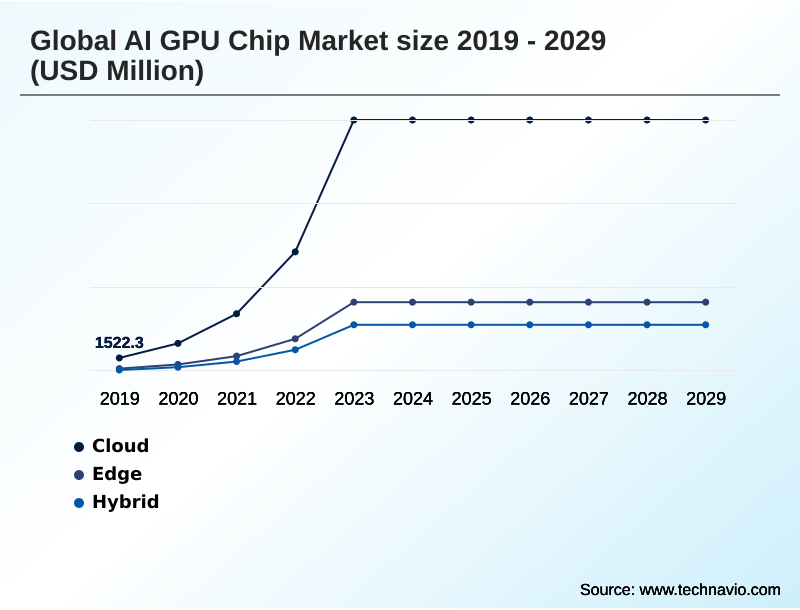
The ai gpu chip industry research report provides comprehensive data (region-wise segment analysis), with forecasts and estimates in "USD million" for the period 2025-2029, as well as historical data from 2019-2023 for the following segments.
- Deployment
- Cloud
- Edge
- Hybrid
- Application
- Natural language processing
- Computer vision
- Robotics
- Recommendation engines
- Others
- End-user
- BFSI
- IT and telecom
- Healthcare
- Automotive and transportation
- Others
- Geography
- North America
- US
- Canada
- Mexico
- APAC
- China
- Japan
- South Korea
- Europe
- Germany
- UK
- France
- South America
- Brazil
- Argentina
- Colombia
- Middle East and Africa
- Saudi Arabia
- UAE
- South Africa
- Rest of World (ROW)
- North America
By Deployment Insights
The cloud segment is estimated to witness significant growth during the forecast period.
The cloud deployment segment remains the cornerstone of the AI GPU chip market, primarily driven by the massive computational requirements of ai model training.
Organizations leverage gpu-as-a-service (gpaas) offerings to access scalable resources for both training workloads and inference workloads without incurring heavy capital expenditure on data center infrastructure.
This model democratizes access to high-performance computing, enabling a broader range of enterprises to develop and deploy sophisticated applications using cloud-native software.
The flexibility of cloud environments is paramount; in a recent survey, 80% of IT leaders affirmed that hybrid cloud architectures, which combine public and private resources, provide optimal agility for managing diverse data and application portfolios, reinforcing the strategic importance of accessible, powerful computing.
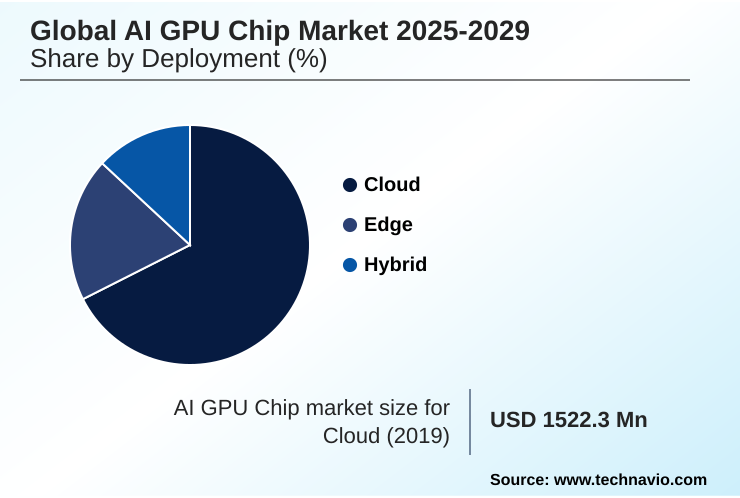
The Cloud segment was valued at USD 25.74 billion in 2023 and showed a gradual increase during the forecast period.
Regional Analysis
North America is estimated to contribute 37.6% to the growth of the global market during the forecast period.Technavio’s analysts have elaborately explained the regional trends and drivers that shape the market during the forecast period.
See How AI GPU Chip Market Demand is Rising in North America Get Free Sample
The global AI GPU chip market exhibits a distinct geographic concentration, with North America leading in market share and innovation, driven by its established ecosystem of tech giants and research institutions.
This region accounts for approximately 37.6% of the market's incremental growth. However, the APAC region is the fastest-growing, with a projected CAGR of 33.0%, fueled by strong government investments, a burgeoning manufacturing sector, and the rise of sovereign ai initiatives.
Countries across APAC are aggressively expanding their data center infrastructure to support domestic AI development. Europe is also strengthening its position through strategic policies aimed at enhancing its semiconductor capabilities, particularly in industrial and automotive applications.
Meanwhile, emerging markets in South America and the Middle East and Africa are witnessing increased adoption driven by digitalization and smart city infrastructure projects, indicating a broadening global footprint for AI hardware.
Market Dynamics
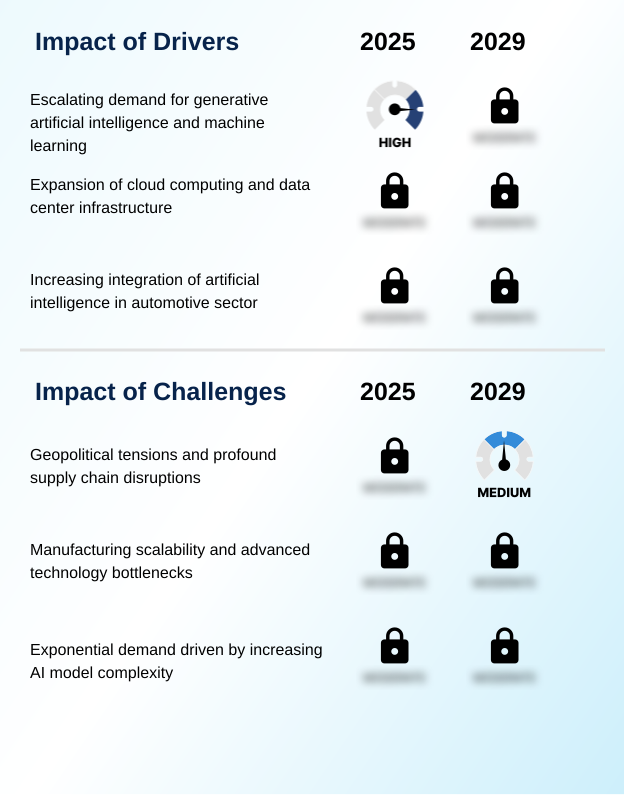
Our researchers analyzed the data with 2024 as the base year, along with the key drivers, trends, and challenges. A holistic analysis of drivers will help companies refine their marketing strategies to gain a competitive advantage.
- The strategic decisions facing organizations in the AI GPU chip market are increasingly nuanced, touching upon every layer of the technology stack. The debate over custom asic versus gpu for inference is central, as businesses weigh performance against flexibility. For on-device ai for mobile applications, the focus is on creating an energy-efficient gpu for edge devices.
- In the data center, building a scalable gpu infrastructure for cloud is critical, with architects exploring gpu architecture for transformer models to find the optimal balance of power and cost. This involves not just hardware but also software, with a focus on optimizing gpu for llm training and leveraging federated learning on distributed gpus.
- Key use cases drive specific requirements, from a low-latency gpu for autonomous vehicles to ensuring high gpu performance in medical imaging. The push for sovereign ai and domestic chip production is reshaping supply chains, while the technical challenges of advanced packaging for ai accelerators and data center cooling for gpu clusters remain paramount.
- This ecosystem relies on benchmarking ai inference on gpus to validate performance. In some cases, specialized hardware has demonstrated the ability to reduce certain computational cycles by over 30% compared to generalized processors.
- Security implications of ai hardware, particularly in applications like ai-ran network optimization with gpus, generative ai on consumer hardware, and AI chip development for robotics, are also gaining prominence.
- Ultimately, real-time analytics with ai gpus and their role in gpu utilization in financial modeling are creating tangible business value, making the development of ai gpu chip for digital twins a strategic frontier.
What are the key market drivers leading to the rise in the adoption of AI GPU Chip Industry?
- The escalating demand for generative artificial intelligence and machine learning applications serves as a primary driver for market growth.
- The market's explosive growth is fundamentally driven by the insatiable demand from generative AI and high-performance computing (hpc) applications.
- The computational power required for ai model inference on large language models (llms) has caused data center revenue for leading chipmakers to surge.
- This is supported by the expansion of cloud infrastructure, with the number of data centers in the United States alone now exceeding five thousand.
- These facilities rely on gpu-accelerated frameworks to offer scalable computing resources to a wide array of industries.
- The proliferation of AI into sectors like automotive and healthcare further fuels this demand, as enterprises integrate sophisticated AI capabilities into their core products and services, making powerful and specialized GPUs a critical component for maintaining a competitive edge.
What are the market trends shaping the AI GPU Chip Industry?
- A defining market trend is the accelerated pace of innovation in AI GPU architecture. This includes increasing specialization to meet the escalating demands of diverse and complex workloads.
- A primary trend shaping the AI GPU chip market is the rapid acceleration of architectural innovation and specialization. Companies are moving beyond general-purpose designs to create a purpose-built ai accelerator, often in a system-on-a-chip (soc) format that integrates a dedicated neural processing unit (npu).
- This is most evident in the burgeoning ai pc market, where manufacturers aim to ship over 100 million units with such chips in the next two years. For large-scale generative ai services, new architectures are demonstrating a twofold increase in performance for training workloads compared to previous generations.
- This specialization allows for more efficient handling of complex models and is expanding beyond data centers into automotive and industrial applications, where real-time processing is critical for safety and operational efficiency.
What challenges does the AI GPU Chip Industry face during its growth?
- Geopolitical tensions and the resulting profound supply chain disruptions present a significant challenge to the industry's growth trajectory.
- Significant challenges constrain the AI GPU chip market, primarily stemming from geopolitical frictions and manufacturing bottlenecks. US export controls have created a complex compliance landscape, forcing companies to navigate regulations while trying to serve major markets. This has spurred a drive for supply chain optimization and regional self-sufficiency.
- On the manufacturing front, the production of advanced chips is limited by the capacity for critical technologies like chip-on-wafer-on-substrate (cowos) advanced packaging. Foundries producing over 90% of the world's most advanced chips face immense demand, leading to lead times extending to nearly a year for top-tier hardware.
- This scarcity of hardware acceleration for real-time data processing impacts the ability of cloud providers and AI developers to scale their operations, creating a significant bottleneck for innovation across the industry.
Exclusive Technavio Analysis on Customer Landscape
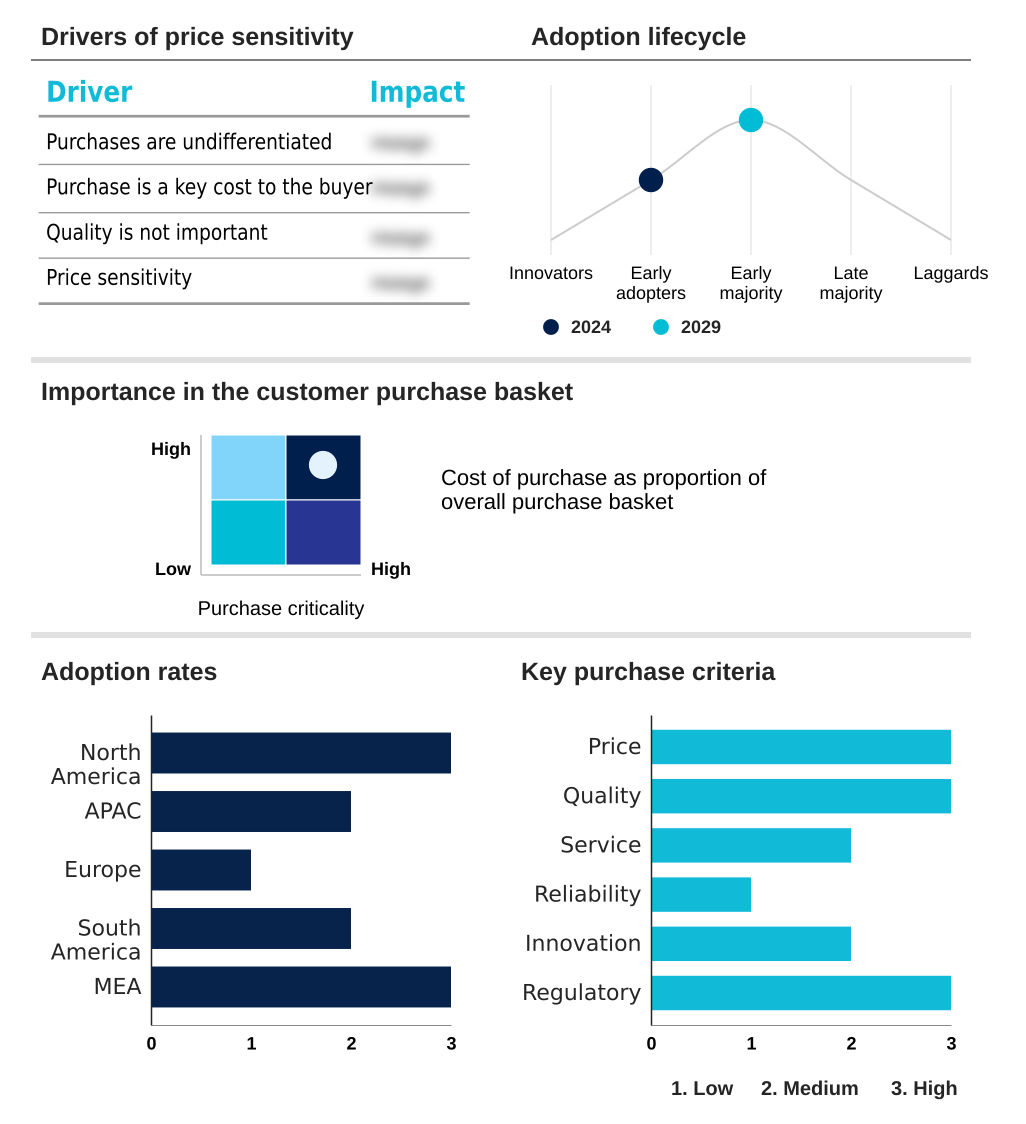
The ai gpu chip market forecasting report includes the adoption lifecycle of the market, covering from the innovator’s stage to the laggard’s stage. It focuses on adoption rates in different regions based on penetration. Furthermore, the ai gpu chip market report also includes key purchase criteria and drivers of price sensitivity to help companies evaluate and develop their market growth analysis strategies.
Customer Landscape of AI GPU Chip Industry
Competitive Landscape
Companies are implementing various strategies, such as strategic alliances, ai gpu chip market forecast, partnerships, mergers and acquisitions, geographical expansion, and product/service launches, to enhance their presence in the industry.
Advanced Micro Devices Inc. - Offerings include specialized AI GPU chips designed for diverse applications, ranging from large-scale data center computations to advanced workstation and consumer-level AI tasks.
The industry research and growth report includes detailed analyses of the competitive landscape of the market and information about key companies, including:
- Advanced Micro Devices Inc.
- Amazon Web Services Inc.
- Apple Inc.
- Arm Ltd.
- Cerebras Systems Inc.
- Gigabyte Technology Co. Ltd.
- Google LLC
- Graphcore Ltd.
- Groq Inc.
- Huawei Technologies Co. Ltd.
- Imagination Technologies Ltd.
- Intel Corp.
- IBM Corp.
- Micro Star International Co. Ltd.
- NVIDIA Corp.
- Qualcomm Inc.
- SambaNova Systems Inc.
- Samsung Electronics Co. Ltd.
- Taiwan Semiconductor Co. Ltd.
- Zotac Technology Ltd.
Qualitative and quantitative analysis of companies has been conducted to help clients understand the wider business environment as well as the strengths and weaknesses of key industry players. Data is qualitatively analyzed to categorize companies as pure play, category-focused, industry-focused, and diversified; it is quantitatively analyzed to categorize companies as dominant, leading, strong, tentative, and weak.
Recent Development and News in Ai gpu chip market
- In August 2025, Boston Dynamics announced it is integrating the Jetson Thor platform into its Atlas humanoid robot to leverage its server-level compute for on-device AI workload acceleration.
- In September 2025, an industry consortium including TSMC and ASE Holdings was formed to establish the 3DIC Advanced Manufacturing Alliance, a strategic initiative aimed at resolving advanced packaging constraints for high-performance chips.
- In February 2025, the Colombian government approved its National Artificial Intelligence Policy, CONPES 4144, which allocates significant investment toward strengthening the country's technological infrastructure, including data centers and supercomputing access.
- In May 2025, The United Arab Emirates announced a multi-billion-dollar deal to build one of the world's largest AI data center hubs in Abu Dhabi, equipped with the most advanced AI GPUs.
Dive into Technavio’s robust research methodology, blending expert interviews, extensive data synthesis, and validated models for unparalleled AI GPU Chip Market insights. See full methodology.
| Market Scope | |
|---|---|
| Page number | 311 |
| Base year | 2024 |
| Historic period | 2019-2023 |
| Forecast period | 2025-2029 |
| Growth momentum & CAGR | Accelerate at a CAGR of 32.4% |
| Market growth 2025-2029 | USD 145057.6 million |
| Market structure | Fragmented |
| YoY growth 2024-2025(%) | 27.1% |
| Key countries | US, Canada, Mexico, China, Japan, South Korea, India, Australia, Indonesia, Germany, UK, France, The Netherlands, Italy, Spain, Brazil, Argentina, Colombia, Saudi Arabia, UAE, South Africa, Israel and Turkey |
| Competitive landscape | Leading Companies, Market Positioning of Companies, Competitive Strategies, and Industry Risks |
Research Analyst Overview
- The AI GPU chip market's trajectory is dictated by a convergence of architectural innovation and intense computational demand. The foundation is hardware acceleration, where advancements in parallel processing capabilities and high-bandwidth memory are crucial.
- Development now spans from a reconfigurable dataflow unit and wafer-scale engine to a highly specialized system-on-a-chip (soc) integrating a neural processing unit (npu) or visual processing unit. Boardroom decisions are increasingly influenced by the strategic choice between leveraging general-purpose chips and investing in custom silicon or application-specific integrated circuits (asics).
- This is driven by the need to optimize both training workloads and inference workloads for proprietary deep learning algorithms and large language models (llms), with some achieving a 30% reduction in processing time. The rise of sovereign ai compels nations to secure their supply chains, making technologies like chip-on-wafer-on-substrate (cowos) advanced packaging and compute subsystems critical.
- Deployment models are also evolving, from gpu-as-a-service (gpaas) and containerization platforms enabling cloud-native software to edge ai and on-device generative ai requiring adaptive socs with built-in ai inference acceleration.
- Technologies like the inference transformer engine, federated learning, and neural network accelerators are becoming standard components in this ecosystem, with field-programmable gate arrays (fpgas) and the tensor processing unit (tpu) offering viable alternatives.
What are the Key Data Covered in this AI GPU Chip Market Research and Growth Report?
-
What is the expected growth of the AI GPU Chip Market between 2025 and 2029?
-
USD 145.06 billion, at a CAGR of 32.4%
-
-
What segmentation does the market report cover?
-
The report is segmented by Deployment (Cloud, Edge, and Hybrid), Application (Natural language processing, Computer vision, Robotics, Recommendation engines, and Others), End-user (BFSI, IT and telecom, Healthcare, Automotive and transportation, and Others) and Geography (North America, APAC, Europe, South America, Middle East and Africa)
-
-
Which regions are analyzed in the report?
-
North America, APAC, Europe, South America and Middle East and Africa
-
-
What are the key growth drivers and market challenges?
-
Escalating demand for generative artificial intelligence and machine learning, Geopolitical tensions and profound supply chain disruptions
-
-
Who are the major players in the AI GPU Chip Market?
-
Advanced Micro Devices Inc., Amazon Web Services Inc., Apple Inc., Arm Ltd., Cerebras Systems Inc., Gigabyte Technology Co. Ltd., Google LLC, Graphcore Ltd., Groq Inc., Huawei Technologies Co. Ltd., Imagination Technologies Ltd., Intel Corp., IBM Corp., Micro Star International Co. Ltd., NVIDIA Corp., Qualcomm Inc., SambaNova Systems Inc., Samsung Electronics Co. Ltd., Taiwan Semiconductor Co. Ltd. and Zotac Technology Ltd.
-
Market Research Insights
- Market dynamics are shaped by the dual pressures of intense computational demand and the strategic need for operational efficiency. The adoption of advanced recommendation engine algorithms has led to a 60% improvement in click-to-conversion rates for some online retailers, a gain directly tied to powerful GPU processing.
- Similarly, AI-powered fraud detection systems are becoming standard in financial services, leveraging real-time data analysis to mitigate risk. In parallel, enterprises are focusing on supply chain optimization, where AI models forecast demand and manage logistics with greater precision. This has led to the rise of specialized hardware and software solutions that support key digital transformation initiatives.
- AI factories are emerging within large organizations, creating dedicated infrastructure to scale AI development, with a clear return on investment demonstrated by significant reductions in customer service handling times through AI-driven automation.
We can help! Our analysts can customize this ai gpu chip market research report to meet your requirements.
 RIA -
RIA - 
