
Ai Hardware For Edge Devices Market Size and Growth Forecast 2026-2030
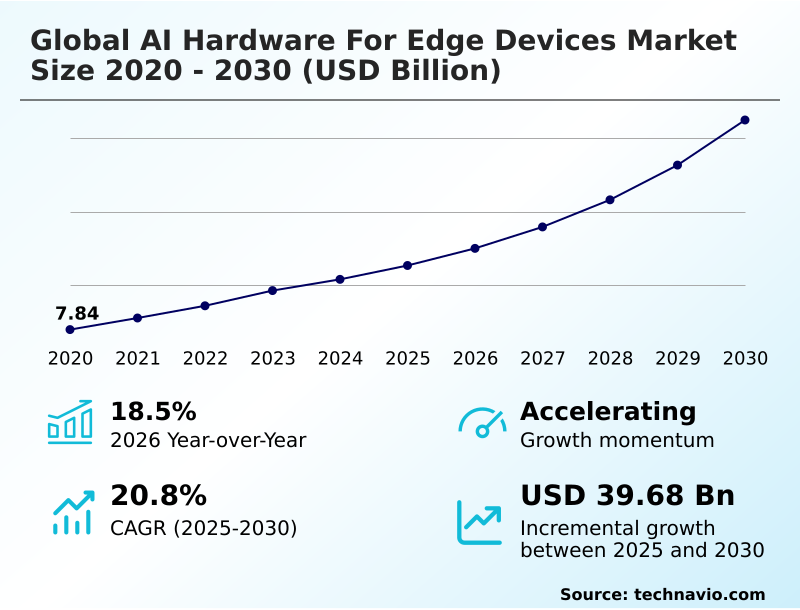
The Ai Hardware For Edge Devices Market size was valued at USD 25.32 billion in 2025 growing at a CAGR of 20.8% during the forecast period 2026-2030.
APAC accounts for 36.9% of incremental growth during the forecast period. The Smartphones segment by Device was valued at USD 7.47 billion in 2024, while the NPU segment holds the largest revenue share by Processor Type.
The market is projected to grow by USD 57.16 billion from 2020 to 2030, with USD 39.68 billion of the growth expected during the forecast period of 2025 to 2030.
Get Key Insights on Market Forecast (PDF) Request Free Sample
Ai Hardware For Edge Devices Market Overview
The AI hardware for edge devices market is defined by the strategic decentralization of computational power, driven by operational demands for low-latency computation and real-time data processing. Industrial automation is a primary catalyst, with smart factories deploying thousands of endpoints for predictive maintenance and quality control, where cloud dependency introduces unacceptable delays. In a typical automated optical inspection system, for instance, an embedded AI vision processor executing computer vision algorithms on-device can identify microscopic defects in components moving at high speed, reducing scrap rates by several percentage points. This shift is mirrored in the consumer sector, where on-device inference for biometric authentication and computational photography is now a standard feature. The market's momentum, underscored by a year-over-year growth of 18.5%, is heavily influenced by the APAC region, which contributes over a third of the incremental growth. However, this expansion is constrained by the complexities of thermal management in compact devices and the significant challenge of hardware-software co-design required to optimize performance for AI-native processors and specialized AI-enabled microcontrollers.
Drivers, Trends, and Challenges in the Ai Hardware For Edge Devices Market
Procurement decision-makers are navigating an increasingly complex market, weighing the trade-offs between different architectures to meet specific operational requirements. The debate over GPU vs NPU for edge video analytics, for example, requires a careful analysis of performance-per-watt for sustained, real-time workloads.
In the automotive sector, sourcing automotive grade AI hardware for ADAS is governed by stringent ISO 26262 functional safety standards, which adds another layer of qualification criteria. For industrial applications, FPGA-based AI acceleration for industrial automation offers flexibility for evolving machine learning models, but the cost of deploying edge AI inference solutions at scale remains a significant consideration.
The thermal design for high-performance edge AI processors is a critical bottleneck, especially for devices where active cooling is not feasible. The EU AI Act introduces further compliance hurdles, demanding transparency in how on-device AI models operate, influencing software toolchains for heterogeneous edge AI hardware.
A medical device manufacturer selecting a low power AI chip for battery-operated devices for remote patient monitoring must now balance energy efficiency, which can be over 30% greater in specialized ASICs compared to general-purpose chips, with the computational throughput needed for on-chip AI for predictive maintenance in manufacturing and the ability to run AI hardware requirements for large language models on edge.
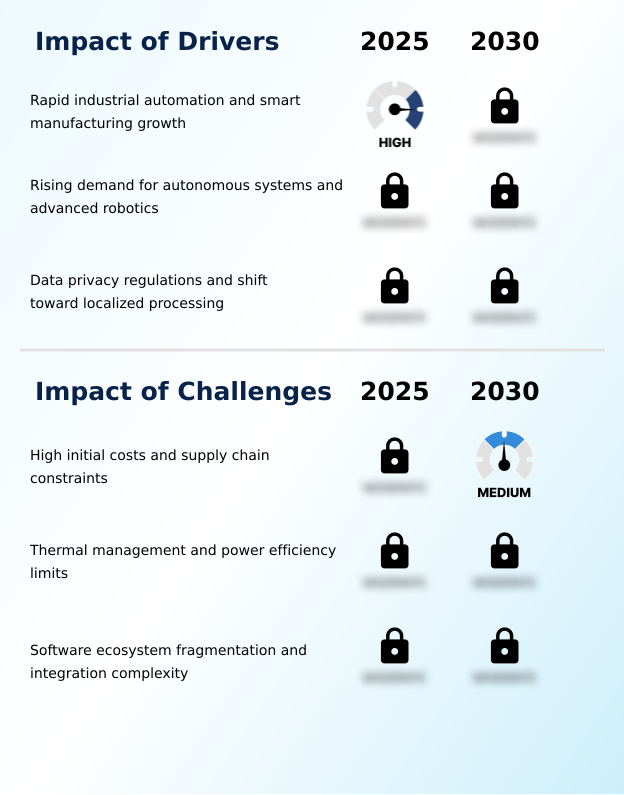
Primary Growth Driver: Market expansion is principally driven by rapid industrial automation and the modernization of smart manufacturing facilities globally.
The market's expansion is fundamentally driven by the dual pressures of industrial modernization and stringent data privacy regulations.
In manufacturing, the adoption of industrial automation and cyber-physical systems necessitates real-time data processing for tasks like predictive maintenance, where AI inference at the edge can anticipate equipment failure before it occurs. This eliminates the latency inherent in cloud-based analysis.
Similarly, the proliferation of autonomous systems, including advanced driver-assistance systems (ADAS), depends on low-latency computation for safety-critical decisions.
Concurrently, regulatory frameworks like the General Data Protection Regulation (GDPR) are forcing a shift toward on-device processing to ensure data sovereignty, making technologies like biometric authentication on local hardware a standard security feature.
Emerging Market Trend: A primary market trend is the architectural shift toward agentic AI on edge devices, empowering hardware with autonomous, context-aware decision-making capabilities independent of cloud connectivity.
A significant market trend is the architectural divergence toward specialized processors, moving beyond general-purpose hardware. The development of neuromorphic computing, which mimics the human brain's structure, is enabling unparalleled energy efficiency in devices performing continuous monitoring. These systems utilize spiking neural networks that consume power only when processing relevant data, making them ideal for battery-powered sensor fusion applications.
Concurrently, the push to run large language models on edge devices is driving demand for heterogeneous computing architectures that combine NPUs, GPUs, and CPUs on a single system-on-chip.
This allows for sophisticated on-device inference, enabling new classes of agentic AI that can perform complex, context-aware tasks without cloud connectivity, a trend particularly prevalent in the North America region which accounts for nearly 30% of market growth.
Key Industry Challenge: High initial non-recurring engineering costs and persistent semiconductor supply chain constraints present significant challenges to broad market adoption.
A critical structural challenge is managing the trade-off between performance and power consumption, governed by the principles of thermal management. As AI models become more complex, the computational demand on machine learning accelerators increases, generating more heat within compact, often passively cooled, edge devices. This requires sophisticated power efficiency optimization at the silicon level, a major focus of hardware-software co-design.
Furthermore, the industry is hampered by a fragmented ecosystem of software development kits (SDKs), where each AI accelerator for IoT often requires a proprietary toolchain. This lack of standardization makes it difficult to port computer vision algorithms and other models across platforms, increasing development costs and complexity for organizations aiming to comply with emerging standards like the EU AI Act.
Explore Full Market Dynamics Analysis Request Free Sample
Ai Hardware For Edge Devices Market Segmentation
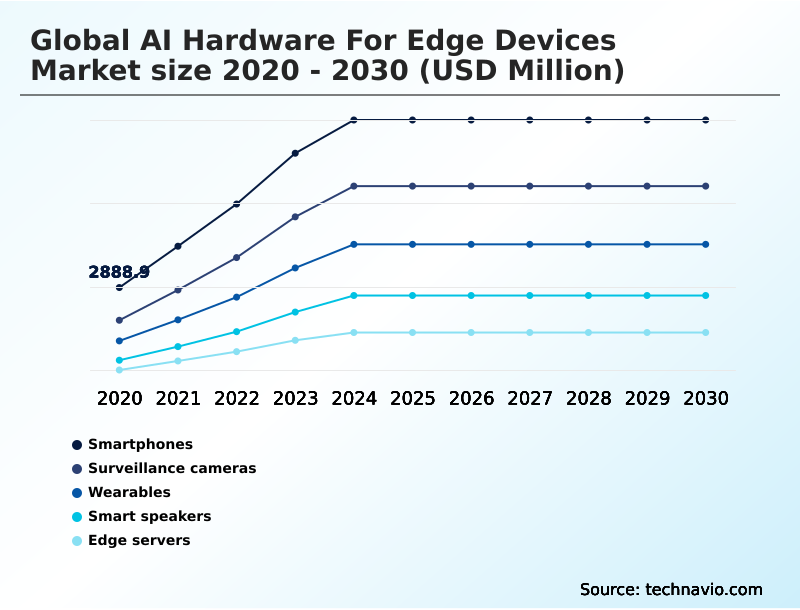
The ai hardware for edge devices industry research report provides comprehensive data including region-wise segment analysis, with forecasts and analysis for the period 2026-2030, as well as historical data from 2020-2024 for the following segments.
Device Segment Analysis
The smartphones segment is estimated to witness significant growth during the forecast period.
The smartphones segment is a primary force in the AI hardware for edge devices market, characterized by the deep integration of specialized processors into consumer handsets.
The standard for flagship devices now includes a dedicated neural processing unit within the main system-on-chip, enabling sophisticated on-device inference for tasks such as computational photography and real-time language translation.
This architecture provides the low-latency computation required for seamless augmented reality overlays and secures sensitive user data by facilitating on-device biometric authentication.
As a result of this deep integration, this segment alone accounts for a significant portion of the market, representing approximately 35% of the total value in 2024 and shaping the design priorities for next-generation mobile AI hardware.
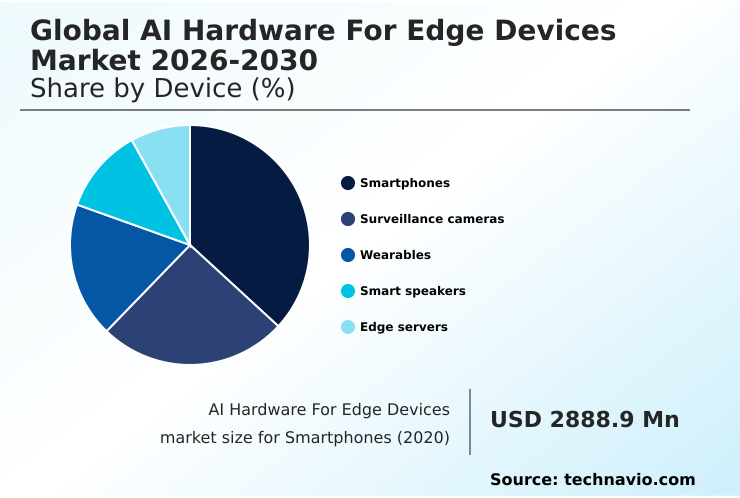
The Smartphones segment was valued at USD 7.47 billion in 2024 and showed a gradual increase during the forecast period.
Ai Hardware For Edge Devices Market by Region: APAC Leads with 36.9% Growth Share
APAC is estimated to contribute 36.9% to the growth of the global market during the forecast period.
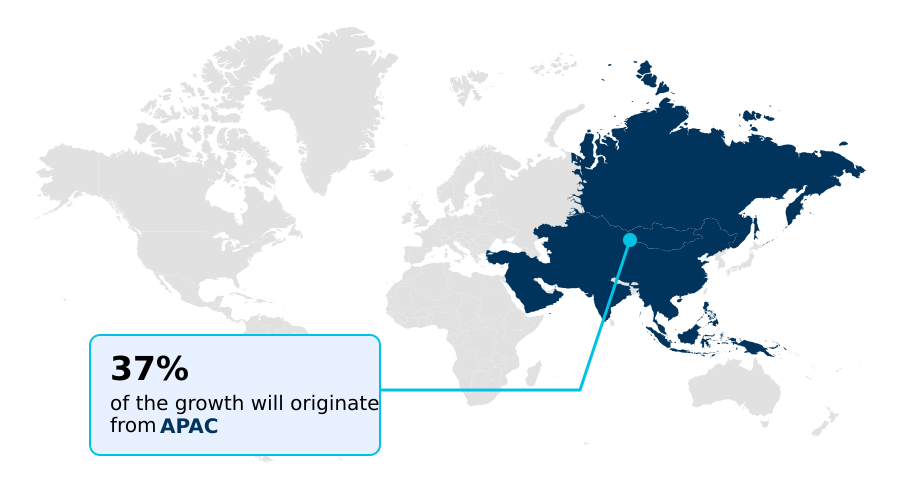
The geographic landscape of the market is led by the APAC region, which accounts for 36.9% of the market's incremental growth, driven by its dominance in semiconductor manufacturing and high-volume electronics production.
Countries in this region are the primary hubs for creating the system-on-chip and AI-enabled microcontrollers that power a vast array of consumer and industrial products.
North America follows, contributing 29.97% to growth, fueled by massive investment in autonomous systems and a robust ecosystem of software and AI accelerator for IoT startups.
In Europe, which accounts for 18% of growth, the market is shaped by stringent regulations like the General Data Protection Regulation (GDPR).
This regulatory pressure mandates on-device inference and secure data handling, driving demand for specialized edge AI platforms and a comprehensive edge-to-cloud strategy that prioritizes data sovereignty.
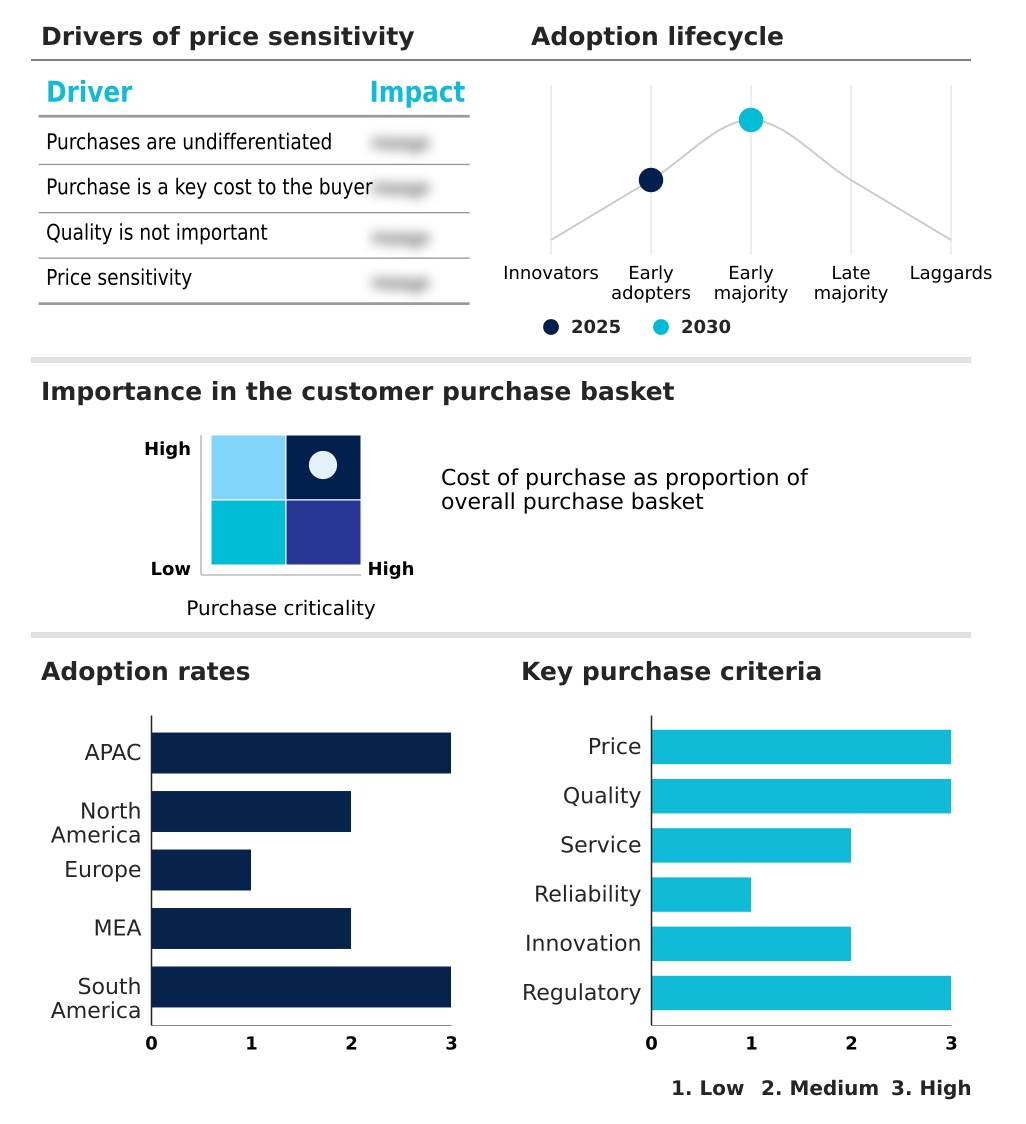
Customer Landscape Analysis for the Ai Hardware For Edge Devices Market
The ai hardware for edge devices market forecasting report includes the adoption lifecycle of the market, covering from the innovator’s stage to the laggard’s stage. It focuses on adoption rates in different regions based on penetration. Furthermore, the ai hardware for edge devices market report also includes key purchase criteria and drivers of price sensitivity to help companies evaluate and develop their market growth analysis strategies.
Competitive Landscape of the Ai Hardware For Edge Devices Market
Companies are implementing various strategies, such as strategic alliances, partnerships, mergers and acquisitions, geographical expansion, and product/service launches, to enhance their presence in the ai hardware for edge devices market industry.
Advanced Micro Devices Inc. - Offers embedded processors and adaptive SoCs engineered to accelerate real-time AI inference workloads at the edge.
The industry research and growth report includes detailed analyses of the competitive landscape of the market and information about key companies, including:
- Advanced Micro Devices Inc.
- Ambarella Inc.
- Apple Inc.
- Google LLC
- Graphcore Ltd.
- Hailo Technologies Ltd.
- Huawei Technologies Co. Ltd.
- Infineon Technologies AG
- Intel Corp.
- MediaTek Inc.
- Microchip Technology Inc.
- Mythic Inc.
- NVIDIA Corp.
- NXP Semiconductors NV
- Qualcomm Inc.
- Renesas Electronics Corp.
- Samsung Electronics Co. Ltd.
- SiMa Technologies Inc.
- Sony Semiconductor Solutions
- STMicroelectronics NV
- Texas Instruments Inc.
Qualitative and quantitative analysis of companies has been conducted to help clients understand the wider business environment as well as the strengths and weaknesses of key industry players. Data is qualitatively analyzed to categorize companies as pure play, category-focused, industry-focused, and diversified; it is quantitatively analyzed to categorize companies as dominant, leading, strong, tentative, and weak.
Recent Developments in the Ai Hardware For Edge Devices Market
- In May, 2025, Qualcomm Technologies announced its strategic intent to acquire Edge Impulse, a move aimed at enhancing the deployment of sophisticated AI models on its processors for applications like computer vision and predictive maintenance.
- In May, 2025, Qualcomm Technologies and Aramco Digital revealed a major collaboration to develop and commercialize advanced edge AI and industrial IoT technologies across Saudi Arabia, leveraging a dedicated 450 MHz industrial network.
- In February, 2025, Nvidia Corp. introduced its Jetson Thor platform, a high-performance edge AI module delivering 800 TOPS, specifically engineered for deployment in robotics and autonomous machines with demanding computational requirements.
- In January, 2025, Samsung Electronics Co. Ltd. unveiled its AI-powered Interactive Display, the WAFX P model, which integrates on-device generative AI and real-time transcription capabilities for educational and enterprise environments.
Research Analyst Overview: Ai Hardware For Edge Devices Market
The market is moving beyond performance benchmarks to address the critical challenge of hardware-software co-design, which has become a primary bottleneck for enterprise adoption. The fragmentation of software development kits and proprietary toolchains for different AI-native processors creates significant integration overhead, directly impacting R&D budgets and time-to-market.
A key boardroom consideration is now standardizing on workload-optimized platforms that can scale across different applications, from industrial automation to advanced driver-assistance systems (ADAS). This has elevated the importance of open standards like RISC-V, which offer a path away from vendor lock-in.
With the market expanding at a notable 18.5% year-over-year, the focus is shifting toward delivering complete edge AI platforms that abstract away the complexity of the underlying silicon, enabling developers to deploy complex sensor fusion and natural language processing models without deep hardware expertise. This requires a mature edge-to-cloud strategy that manages the entire lifecycle of on-device inference models.
Dive into Technavio’s robust research methodology, blending expert interviews, extensive data synthesis, and validated models for unparalleled Ai Hardware For Edge Devices Market insights. See full methodology.
| Market Scope | |
|---|---|
| Page number | 326 |
| Base year | 2025 |
| Historic period | 2020-2024 |
| Forecast period | 2026-2030 |
| Growth momentum & CAGR | Accelerate at a CAGR of 20.8% |
| Market growth 2026-2030 | USD 39683.9 million |
| Market structure | Fragmented |
| YoY growth 2025-2026(%) | 18.5% |
| Key countries | China, Japan, India, South Korea, Australia, Indonesia, US, Canada, Mexico, Germany, UK, France, Italy, Spain, The Netherlands, Saudi Arabia, UAE, South Africa, Israel, Turkey, Brazil, Argentina and Chile |
| Competitive landscape | Leading Companies, Market Positioning of Companies, Competitive Strategies, and Industry Risks |
Ai Hardware For Edge Devices Market: Key Questions Answered in This Report
-
What is the expected growth of the Ai Hardware For Edge Devices Market between 2026 and 2030?
-
The Ai Hardware For Edge Devices Market is expected to grow by USD 39.68 billion during 2026-2030, registering a CAGR of 20.8%. Year-over-year growth in 2026 is estimated at 18.5%%. This acceleration is shaped by rapid industrial automation and smart manufacturing growth, which is intensifying demand across multiple end-use verticals covered in the report.
-
-
What segmentation does the market report cover?
-
The report is segmented by Device (Smartphones, Surveillance cameras, Wearables, Smart speakers, and Edge servers), Processor Type (NPU, GPU, ASIC, CPU, and FPGA), Power Rating (1 to 3W, Less than 1W, 3 to 5W, and More than 5W) and Geography (APAC, North America, Europe, Middle East and Africa, South America). Among these, the Smartphones segment is estimated to witness significant growth during the forecast period, driven by rising adoption across key application areas. Each segment includes detailed qualitative and quantitative analysis, along with historical data from 2020-2024 and forecasts through 2030 with year-over-year growth rates.
-
-
Which regions are analyzed in the report?
-
The report covers APAC, North America, Europe, Middle East and Africa and South America. APAC is estimated to contribute 36.9% to market growth during the forecast period. Country-level analysis includes China, Japan, India, South Korea, Australia, Indonesia, US, Canada, Mexico, Germany, UK, France, Italy, Spain, The Netherlands, Saudi Arabia, UAE, South Africa, Israel, Turkey, Brazil, Argentina and Chile, with dedicated market size tables and year-over-year growth for each.
-
-
What are the key growth drivers and market challenges?
-
The primary driver is rapid industrial automation and smart manufacturing growth, which is accelerating investment and industry demand. The main challenge is high initial costs and supply chain constraints, creating operational barriers for key market participants. The report quantifies the impact of each driver and challenge across 2026 and 2030 with comparative analysis.
-
-
Who are the major players in the Ai Hardware For Edge Devices Market?
-
Key vendors include Advanced Micro Devices Inc., Ambarella Inc., Apple Inc., Google LLC, Graphcore Ltd., Hailo Technologies Ltd., Huawei Technologies Co. Ltd., Infineon Technologies AG, Intel Corp., MediaTek Inc., Microchip Technology Inc., Mythic Inc., NVIDIA Corp., NXP Semiconductors NV, Qualcomm Inc., Renesas Electronics Corp., Samsung Electronics Co. Ltd., SiMa Technologies Inc., Sony Semiconductor Solutions, STMicroelectronics NV and Texas Instruments Inc.. The report provides qualitative and quantitative analysis categorizing companies as dominant, leading, strong, tentative, and weak based on their market positioning. Company profiles include business segment analysis, SWOT assessment, key offerings, and recent strategic developments.
-
Ai Hardware For Edge Devices Market Research Insights
Market dynamics are increasingly shaped by the interplay between regulatory mandates and the technical necessity for decentralized AI processing. Frameworks like the General Data Protection Regulation (GDPR) are compelling enterprises to adopt on-premise AI hardware to ensure sensitive data remains localized, fueling demand for secure on-device AI solutions.
This is particularly evident in applications requiring real-time AI vision processing, such as in retail analytics or access control systems. Concurrently, the operational demand for energy-efficient AI inference in battery-powered devices pushes innovation in low-power AI chips.
While the APAC region leads in manufacturing scale and contributes over one-third of the market's incremental growth, North America's focus on capital-intensive sectors like autonomous vehicles drives demand for high-performance automotive AI hardware. This regional divergence creates a complex procurement landscape for global OEMs.
We can help! Our analysts can customize this ai hardware for edge devices market research report to meet your requirements.
 RIA -
RIA - 
