AI In Aerospace And Defense Industry Market Size 2025-2029
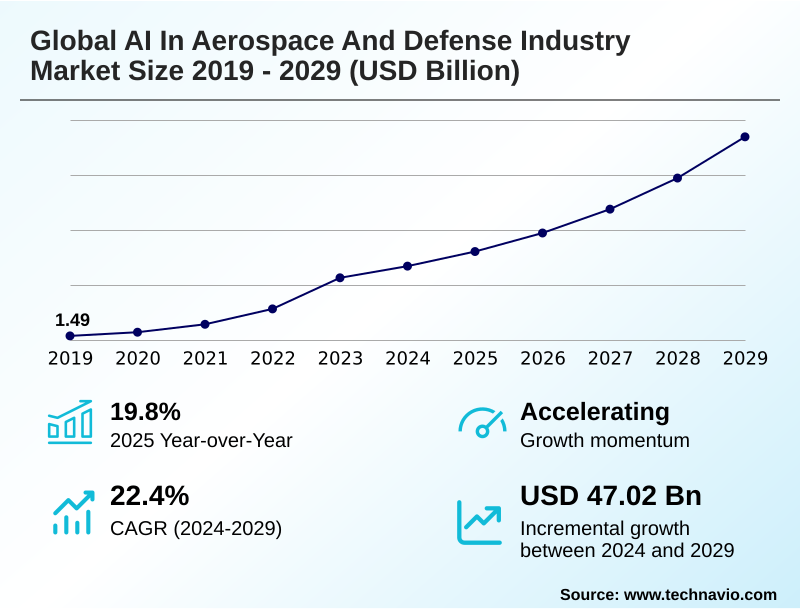
The ai in aerospace and defense industry market size is valued to increase by USD 47.02 billion, at a CAGR of 22.4% from 2024 to 2029. Strategic imperative for military modernization and technological superiority will drive the ai in aerospace and defense industry market.
Major Market Trends & Insights
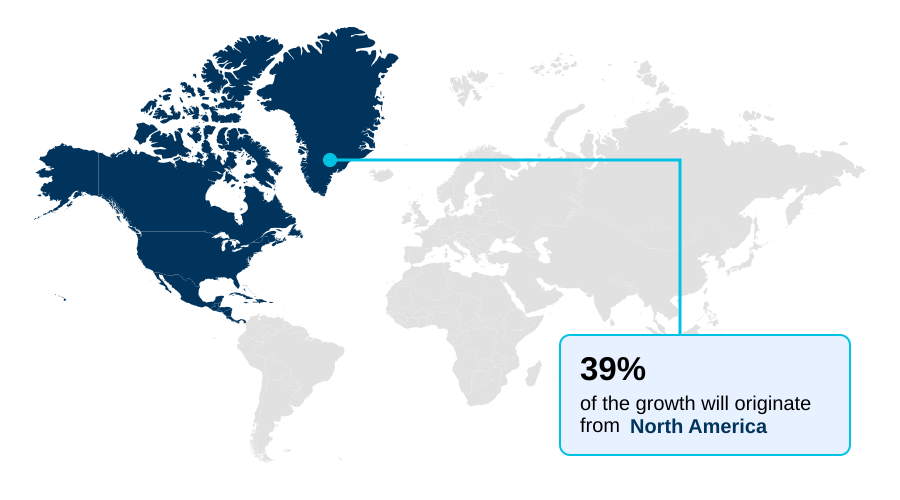
- North America dominated the market and accounted for a 39.3% growth during the forecast period.
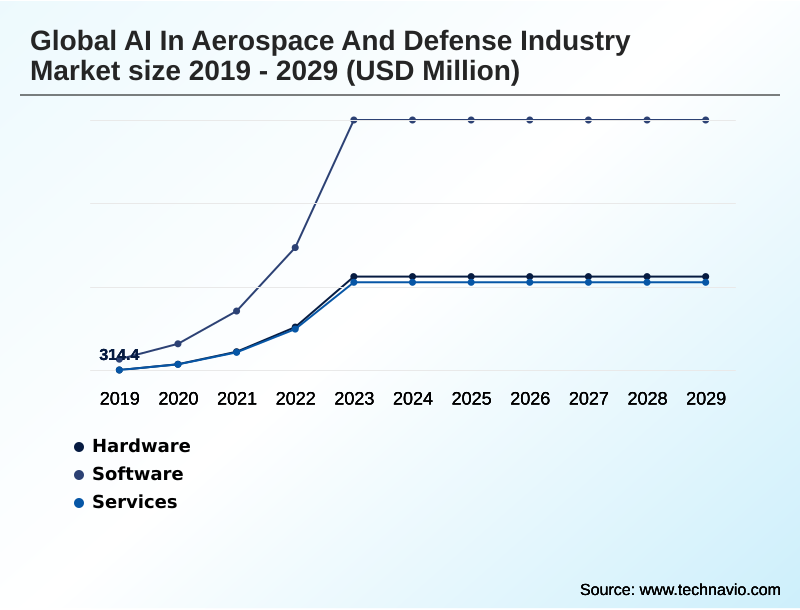
- By Type - Hardware segment was valued at USD 5.01 billion in 2023
- By Application - Military systems segment accounted for the largest market revenue share in 2023
Market Size & Forecast
- Market Opportunities: USD 72.39 billion
- Market Future Opportunities: USD 47.02 billion
- CAGR from 2024 to 2029 : 22.4%
Market Summary
- The AI in aerospace and defense industry market is undergoing a fundamental transformation, driven by the dual imperatives of maintaining technological superiority and achieving greater operational efficiency. This evolution is marked by the deep integration of advanced computational capabilities, such as machine learning and computer vision, into mission-critical systems.
- Key applications include predictive maintenance algorithms that analyze real-time sensor data to forecast equipment failures, thereby increasing asset availability and reducing sustainment costs. For instance, in a commercial aviation scenario, airlines leverage these systems to schedule proactive maintenance, minimizing costly aircraft-on-ground situations.
- In the defense sector, AI is central to developing autonomous navigation systems for unmanned platforms and enhancing intelligence, surveillance, and reconnaissance through automated data fusion and target recognition. This shift also involves significant investment in edge AI processing to ensure decision-making capabilities in disconnected environments.
- However, progress is tempered by challenges related to data security, the ethical implications of lethal autonomous weapons systems, and the complexities of integrating modern AI with legacy infrastructure.
What will be the Size of the AI In Aerospace And Defense Industry Market during the forecast period?
Get Key Insights on Market Forecast (PDF) Get Free Sample
How is the AI In Aerospace And Defense Industry Market Segmented?
The ai in aerospace and defense industry industry research report provides comprehensive data (region-wise segment analysis), with forecasts and estimates in "USD million" for the period 2025-2029, as well as historical data from 2019-2023 for the following segments.
- Type
- Software
- Hardware
- Services
- Application
- Military systems
- Commercial aviation
- Space
- End-user
- OEMs and Tier 1 suppliers
- Defense primes
- Space agencies and commercial operators
- Geography
- North America
- US
- Canada
- Mexico
- Europe
- Germany
- UK
- France
- APAC
- China
- India
- Japan
- Middle East and Africa
- Israel
- Saudi Arabia
- UAE
- South America
- Brazil
- Argentina
- Colombia
- Rest of World (ROW)
- North America
By Type Insights
The software segment is estimated to witness significant growth during the forecast period.
The software segment is central to achieving operational efficiency and technological superiority. It encompasses a range of solutions from predictive maintenance algorithms, which enhance asset readiness, to generative design tools that optimize component manufacturing.
These applications act as a force multiplier, enabling decision superiority in complex scenarios. The development of advanced autonomous navigation systems for unmanned aerial vehicles is a key focus, driven by the need for platforms to function in contested environments.
Furthermore, the migration toward edge AI processing is critical for real-time analysis on platforms where connectivity is limited. The use of human-machine teaming software architectures is becoming standard, with some integrations demonstrating a 15% reduction in mission planning timelines.
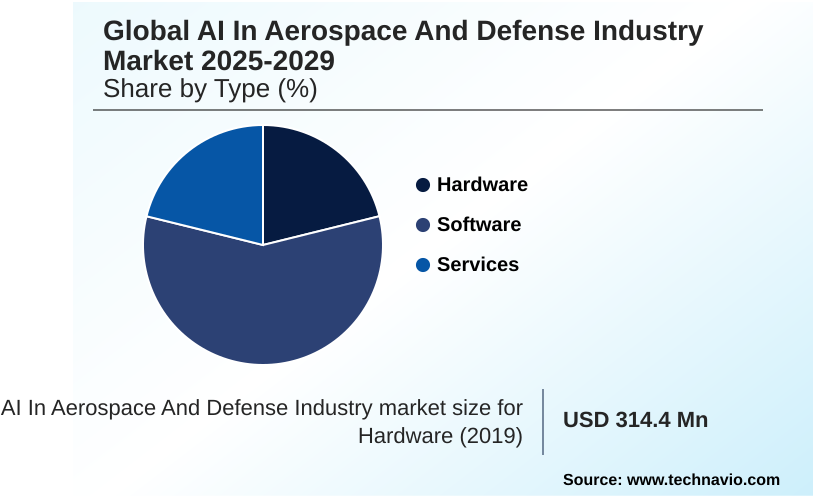
The Software segment was valued at USD 5.01 billion in 2023 and showed a gradual increase during the forecast period.
Regional Analysis
North America is estimated to contribute 39.3% to the growth of the global market during the forecast period.Technavio’s analysts have elaborately explained the regional trends and drivers that shape the market during the forecast period.
See How AI In Aerospace And Defense Industry Market Demand is Rising in North America Get Free Sample
North America commands the largest market share, accounting for approximately 39% of the incremental growth, driven by substantial defense spending and a robust innovation ecosystem.
The region's focus is on deploying sophisticated data analytics platforms to enhance mission readiness and pioneering AI pilot technology.
In APAC, which is the fastest-growing region, there is a strong emphasis on developing indigenous drone swarming capabilities for target recognition and advancing manned-unmanned teaming concepts.
The European market focuses on collaborative programs that utilize advanced data fusion algorithms to support a unified operational picture, aiming for cognitive load reduction for operators.
This investment is a departure from traditional platform-centric warfare, with some European joint ventures reporting a 30% improvement in interoperability during shared exercises.
Market Dynamics
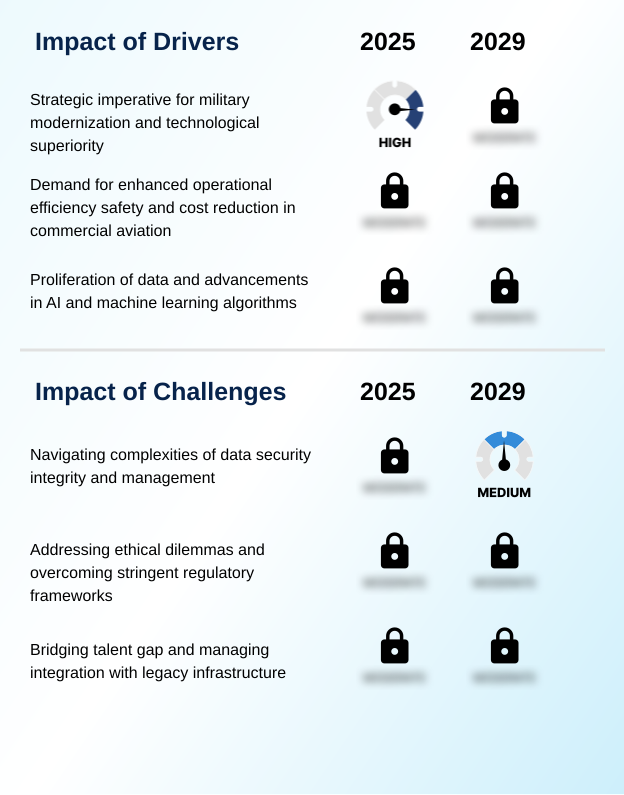
Our researchers analyzed the data with 2024 as the base year, along with the key drivers, trends, and challenges. A holistic analysis of drivers will help companies refine their marketing strategies to gain a competitive advantage.
- The strategic integration of artificial intelligence is reshaping aerospace and defense operations, presenting both opportunities and complex challenges. A primary focus is on AI integration in legacy aircraft, a critical task for modernizing fleets without complete replacement. This initiative is complemented by the development of ethical frameworks for autonomous weapons, aiming to establish guidelines for human-on-the-loop AI combat systems.
- In commercial aviation, certifying AI for flight-critical applications remains a significant hurdle, as the AI role in commercial aviation safety must be proven beyond doubt. Concurrently, machine learning for fuel efficiency and AI-powered air traffic optimization are delivering tangible economic benefits, with some systems demonstrating a capacity to improve airspace utilization by over 15%.
- In the defense sector, the focus is on achieving decision superiority through real-time threat analysis with AI and AI-enhanced ISR data processing. This is made possible by advances in edge AI for disconnected environments, ensuring autonomous navigation in GPS-denied areas.
- On the ground, AI for military supply chains is optimizing logistics, while predictive maintenance for fighter jets is increasing fleet readiness. Innovations like generative AI for component redesign and AI-driven swarm drone coordination are pushing the boundaries of what's possible.
- The ultimate goal is reducing cognitive load with AI for operators, a process validated through rigorous validating AI in combat simulations and underpinned by robust data security for military AI. In the space domain, AI in space situational awareness and automating satellite constellation management are becoming essential for managing increasingly congested orbits.
What are the key market drivers leading to the rise in the adoption of AI In Aerospace And Defense Industry Industry?
- The strategic imperative for military modernization and the pursuit of technological superiority is a key driver for the market.
- A primary driver is the strategic imperative to develop next-generation combat capabilities, demonstrated by advances in AI-piloted combat and the push for AI-driven joint all-domain operations.
- This necessitates investment in specialized hardware, including on-device AI semiconductors for the tactical edge and advanced high-power microwave systems. The development of sophisticated mission planning tools is critical for coordinating complex operations involving assets like the robotic combat vehicle.
- This push for autonomy faces regulatory hurdles, especially regarding AI safety certification and addressing the AI black box problem.
- Furthermore, the significant challenge of legacy infrastructure integration is driving innovation in modular software, with some new systems reducing integration time by up to 40% compared to previous monolithic approaches.
What are the market trends shaping the AI In Aerospace And Defense Industry Industry?
- The proliferation of generative artificial intelligence and foundation models is an influential trend shaping the market. This marks a shift toward leveraging AI for complex problem-solving and content creation.
- A dominant trend is the application of large language models and deep learning frameworks to process vast amounts of unstructured intelligence surveillance reconnaissance data, which improves analytical output by over 30%. This shift enables more sophisticated command and control systems.
- In commercial aviation, fuel optimization and advanced air traffic management are being enhanced through AI, while condition-based maintenance models are becoming standard practice. In the defense sector, the development of collaborative combat aircraft is accelerating.
- However, this progress raises complex questions regarding lethal autonomous weapons systems and introduces new vulnerabilities, such as sophisticated data poisoning attacks, which can compromise model integrity and lead to mission failure, a risk that has seen mitigation costs increase by 20%.
What challenges does the AI In Aerospace And Defense Industry Industry face during its growth?
- Navigating the complexities of data security, integrity, and management presents a key challenge affecting industry growth.
- A significant challenge is the hybrid talent gap, which constrains the development of tactical AI software and robust cybersecurity solutions needed to protect the emerging digital battlefield. This skills shortage affects the entire value chain, including supply chain optimization. The operational environment demands sophisticated threat detection capabilities, particularly effective counter-drone technology and advanced electronic warfare systems.
- The goal is to enhance situational awareness across all domains through AI-powered autonomous air systems. The complexity of these systems introduces new security vulnerabilities, with reports indicating a 25% increase in attack vectors associated with interconnected AI platforms.
- Securing these systems against advanced cyber threats remains a paramount concern for both military and commercial operators, driving significant investment in defensive technologies.
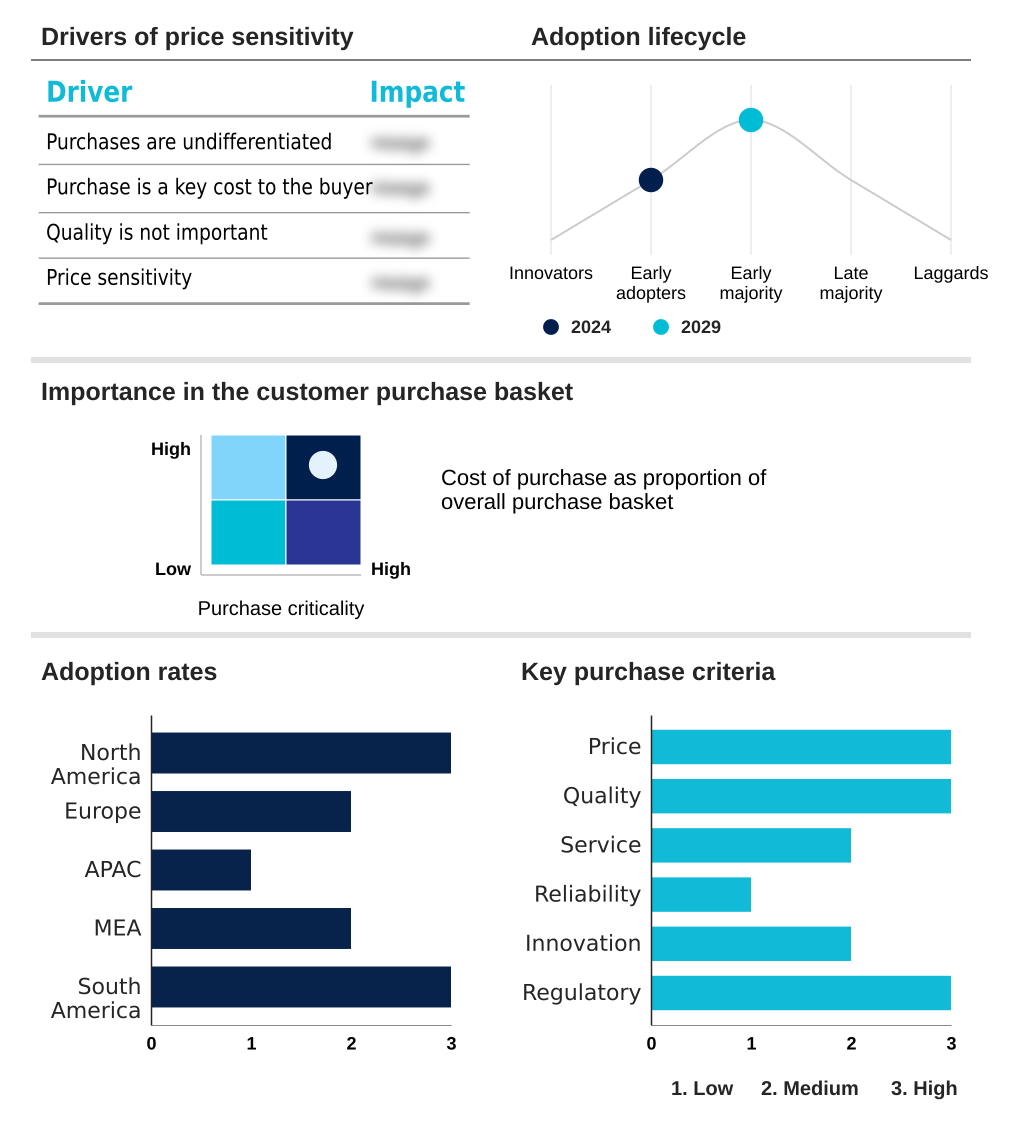
Exclusive Technavio Analysis on Customer Landscape
The ai in aerospace and defense industry market forecasting report includes the adoption lifecycle of the market, covering from the innovator’s stage to the laggard’s stage. It focuses on adoption rates in different regions based on penetration. Furthermore, the ai in aerospace and defense industry market report also includes key purchase criteria and drivers of price sensitivity to help companies evaluate and develop their market growth analysis strategies.
Customer Landscape of AI In Aerospace And Defense Industry Industry
Competitive Landscape
Companies are implementing various strategies, such as strategic alliances, ai in aerospace and defense industry market forecast, partnerships, mergers and acquisitions, geographical expansion, and product/service launches, to enhance their presence in the industry.
Anduril Industries Inc. - Delivers AI-powered autonomous systems including drones, surveillance platforms, and counter-drone technology, centered on an advanced software platform for integrated operations.
The industry research and growth report includes detailed analyses of the competitive landscape of the market and information about key companies, including:
- Anduril Industries Inc.
- BAE Systems Plc
- Epirus Inc.
- Firestorm Solutions LLC
- General Dynamics Corp.
- Helsing GmbH
- Kratos Defense and Security Solutions Inc.
- L3Harris Technologies Inc.
- Leidos Holdings Inc.
- Lockheed Martin Corp.
- Northrop Grumman Corp.
- Palantir Technologies Inc.
- Rebellion Defense Inc.
- RTX Corp.
- Science Applications International Corp. Inc
- Shield AI
- The Boeing Co.
Qualitative and quantitative analysis of companies has been conducted to help clients understand the wider business environment as well as the strengths and weaknesses of key industry players. Data is qualitatively analyzed to categorize companies as pure play, category-focused, industry-focused, and diversified; it is quantitatively analyzed to categorize companies as dominant, leading, strong, tentative, and weak.
Recent Development and News in Ai in aerospace and defense industry market
- In February, 2025, European AI defense company Helsing announced a partnership with French AI leader Mistral AI to jointly develop large language models specifically for defense and intelligence applications.
- In May, 2025, Korea Aerospace Industries announced a project to develop its own on-device AI semiconductors for the defense industry, with the explicit goal of implementing AI pilot technology in manned-unmanned teaming systems.
- In April, 2025, a Department of the Air Force official noted that modernizing massive, decades-old legacy codebases is a primary challenge, exploring generative AI coding assistants to accelerate the process.
- In September, 2024, BAE Systems secured a contract for the DARPA Artificial Intelligence Reinforcements (AIR) program, tasked with using machine learning to innovate simulation models for tactical autonomy.
Dive into Technavio’s robust research methodology, blending expert interviews, extensive data synthesis, and validated models for unparalleled AI In Aerospace And Defense Industry Market insights. See full methodology.
| Market Scope | |
|---|---|
| Page number | 320 |
| Base year | 2024 |
| Historic period | 2019-2023 |
| Forecast period | 2025-2029 |
| Growth momentum & CAGR | Accelerate at a CAGR of 22.4% |
| Market growth 2025-2029 | USD 47019.8 million |
| Market structure | Fragmented |
| YoY growth 2024-2025(%) | 19.8% |
| Key countries | US, Canada, Mexico, Germany, UK, France, Italy, Spain, The Netherlands, China, India, Japan, South Korea, Australia, Indonesia, Israel, Saudi Arabia, UAE, South Africa, Turkey, Brazil, Argentina and Colombia |
| Competitive landscape | Leading Companies, Market Positioning of Companies, Competitive Strategies, and Industry Risks |
Research Analyst Overview
- The AI in aerospace and defense industry market is defined by a rapid evolution in tactical capabilities, moving beyond theoretical applications to deployed systems. Central to this shift are sophisticated predictive maintenance algorithms, which are fundamental for asset readiness, and advanced autonomous navigation systems that enable operations in contested environments.
- Development is heavily focused on human-machine teaming and manned-unmanned teaming, concepts actualized through collaborative combat aircraft and cutting-edge AI pilot technology. The integration of generative design is reshaping manufacturing, while edge AI processing allows for real-time computations directly on platforms. Key systems include advanced command and control systems for situational awareness and AI-driven joint all-domain operations tools.
- Security remains paramount, with a focus on robust cybersecurity solutions to counter threats like data poisoning attacks. The development of on-device AI semiconductors and high-power microwave systems represents the hardware frontier. For operational effectiveness, mission planning tools, tactical AI software, and data analytics platforms are crucial for processing intelligence surveillance reconnaissance data.
- In one instance, the implementation of AI-driven data fusion algorithms led to a 40% reduction in target identification time. This progress in AI-powered autonomous air systems and drone swarming capabilities is paving the way for next-generation warfare, despite ongoing debates surrounding lethal autonomous weapons systems.
What are the Key Data Covered in this AI In Aerospace And Defense Industry Market Research and Growth Report?
-
What is the expected growth of the AI In Aerospace And Defense Industry Market between 2025 and 2029?
-
USD 47.02 billion, at a CAGR of 22.4%
-
-
What segmentation does the market report cover?
-
The report is segmented by Type (Hardware, Software, Services), Application (Military systems, Commercial aviation, Space), End-user (OEMs and Tier-1 suppliers, Defense primes, Space agencies and commercial operators) and Geography (North America, Europe, APAC, Middle East and Africa, South America)
-
-
Which regions are analyzed in the report?
-
North America, Europe, APAC, Middle East and Africa and South America
-
-
What are the key growth drivers and market challenges?
-
Strategic imperative for military modernization and technological superiority, Navigating complexities of data security integrity and management
-
-
Who are the major players in the AI In Aerospace And Defense Industry Market?
-
Anduril Industries Inc., BAE Systems Plc, Epirus Inc., Firestorm Solutions LLC, General Dynamics Corp., Helsing GmbH, Kratos Defense and Security Solutions Inc., L3Harris Technologies Inc., Leidos Holdings Inc., Lockheed Martin Corp., Northrop Grumman Corp., Palantir Technologies Inc., Rebellion Defense Inc., RTX Corp., Science Applications International Corp. Inc, Shield AI and The Boeing Co.
-
Market Research Insights
- The market is driven by a push for technological superiority and operational efficiency. AI acts as a force multiplier, enabling decision superiority through advanced analytics. The proliferation of unmanned aerial vehicles is reshaping the digital battlefield, where counter-drone technology and electronic warfare systems are crucial.
- In aviation, AI facilitates condition-based maintenance and fuel optimization, with predictive models reducing unscheduled downtime by up to 25%. This improves mission readiness. The use of large language models and deep learning frameworks aids target recognition and data fusion. However, legacy infrastructure integration and the hybrid talent gap present significant hurdles.
- The industry is also grappling with the AI black box problem and the need for stringent AI safety certification, especially for the robotic combat vehicle. The shift from platform-centric warfare to networked systems operating at the tactical edge, supported by supply chain optimization, is a defining transition, reducing operational costs by over 15%. This requires cognitive load reduction for personnel.
We can help! Our analysts can customize this ai in aerospace and defense industry market research report to meet your requirements.
 RIA -
RIA - 
