
AI In Financial Planning And Analysis Market Size 2025-2029
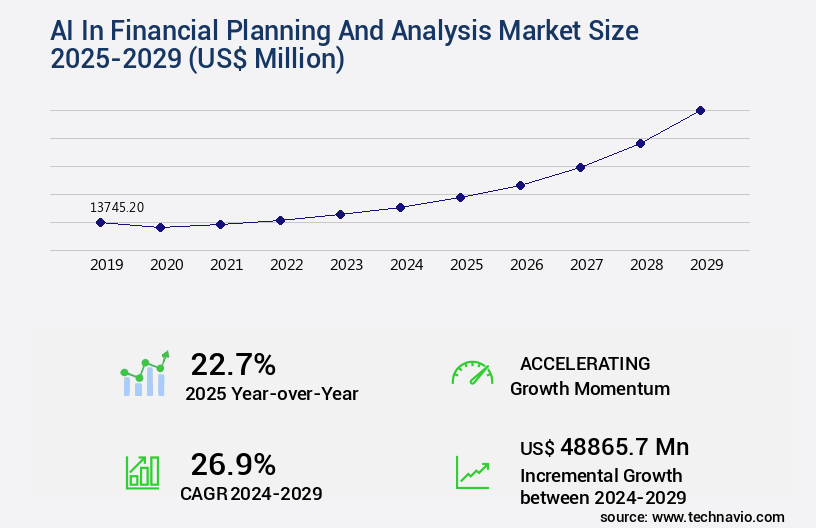
The AI in financial planning and analysis market size is valued to increase by USD 48.87 billion, at a CAGR of 26.9% from 2024 to 2029. Increasing business volatility and demand for enhanced agility will drive the AI in financial planning and analysis market.
Market Insights
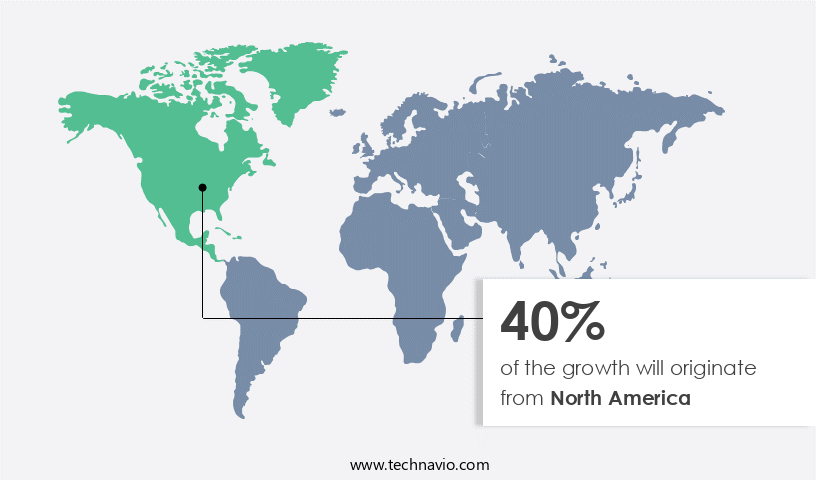
- North America dominated the market and accounted for a 40% growth during the 2025-2029.
- By Type - Rule-based segment was valued at USD 7.45 billion in 2023
- By Application - Predictive forecasting and planning segment accounted for the largest market revenue share in 2023
Market Size & Forecast
- Market Opportunities: USD 410.55 million
- Market Future Opportunities 2024: USD 48865.70 million
- CAGR from 2024 to 2029 : 26.9%
Market Summary
- The AI in Financial Planning and Analysis (FP&A) market is experiencing significant growth due to increasing business volatility and the demand for enhanced agility. With the emergence of generative AI and conversational analytics, financial teams can now process vast amounts of data more efficiently and accurately, enabling them to make informed decisions in real-time. However, the adoption of AI in FP&A also presents challenges. Data quality, accessibility, and integration complexity are major concerns, as financial data often resides in disparate systems and formats. For instance, a global manufacturing company faces the challenge of optimizing its supply chain to meet demand while minimizing costs.
- By implementing AI in FP&A, the company can analyze real-time data from various sources, such as sales orders, inventory levels, and production schedules. This enables the FP&A team to identify trends, forecast demand accurately, and make data-driven decisions to optimize inventory levels and reduce costs. Despite these benefits, the implementation of AI in FP&A requires a significant investment in technology, data management, and skilled personnel. Additionally, Data Security and privacy concerns must be addressed to ensure the confidentiality of financial information. Overall, the AI in FP&A market is poised for continued growth as more organizations seek to leverage AI to gain a competitive edge in today's dynamic business environment.
What will be the size of the AI In Financial Planning And Analysis Market during the forecast period?
Get Key Insights on Market Forecast (PDF) Request Free Sample
- In the dynamic realm of business finance, Artificial Intelligence (AI) has emerged as a game-changer in Financial Planning and Analysis (FP&A). AI applications, including reinforcement learning, audit trail management, and performance benchmarking, have revolutionized financial processes by streamlining Data Warehousing, debt management, and time series forecasting. For instance, ETL processes have seen a significant improvement with AI, enabling companies to process vast amounts of financial data more efficiently. Decision-making in finance is becoming increasingly complex, with regulatory compliance being a critical boardroom concern. AI-driven solutions, such as decision trees and neural networks, offer advanced capabilities in data security and compliance regulations.
- Furthermore, AI can analyze large datasets to provide insights on capital structure, liquidity ratios, and key performance indicators, allowing businesses to make informed decisions on return on investment and financial control systems. deep learning techniques, like monte carlo simulations and genetic algorithms, play a crucial role in risk management, debt management, and equity financing. These advanced AI models enable businesses to analyze complex financial data, identify trends, and make predictions with higher accuracy. Moreover, AI's ability to learn from historical data and adapt to new information makes it an invaluable tool in today's fast-paced business environment. In summary, AI is transforming the financial planning and analysis landscape by automating routine tasks, providing actionable insights, and enabling more accurate predictions.
- With AI, businesses can make informed decisions, improve operational efficiency, and stay ahead of the competition.
Unpacking the AI In Financial Planning And Analysis Market Landscape
In the realm of Financial Planning and Analysis (FP&A), Artificial Intelligence (AI) is revolutionizing business operations by enhancing accuracy, efficiency, and insight. AI applications, such as fraud detection algorithms and credit scoring models, improve risk management by identifying anomalous transactions and assessing creditworthiness with greater precision. Portfolio performance metrics and scenario planning software enable more informed decision-making, leading to increased ROI. AI-driven risk assessment and predictive modeling techniques facilitate due diligence automation, ensuring regulatory compliance and reducing potential losses. Real-time data processing and financial statement automation streamline operations, saving time and resources. Advanced analytics platforms employ machine learning models to optimize investment portfolios and uncover hidden trends, while Algorithmic trading strategies execute high-frequency transactions with minimal human intervention. Sentiment analysis finance and financial forecasting algorithms provide valuable insights into market trends and customer sentiment, enabling better strategic planning. Risk management platforms and AI-powered audit tools ensure regulatory compliance and minimize potential risks. Overall, the adoption of AI in FP&A results in significant efficiency improvements, enhanced accuracy, and improved business outcomes.
Key Market Drivers Fueling Growth
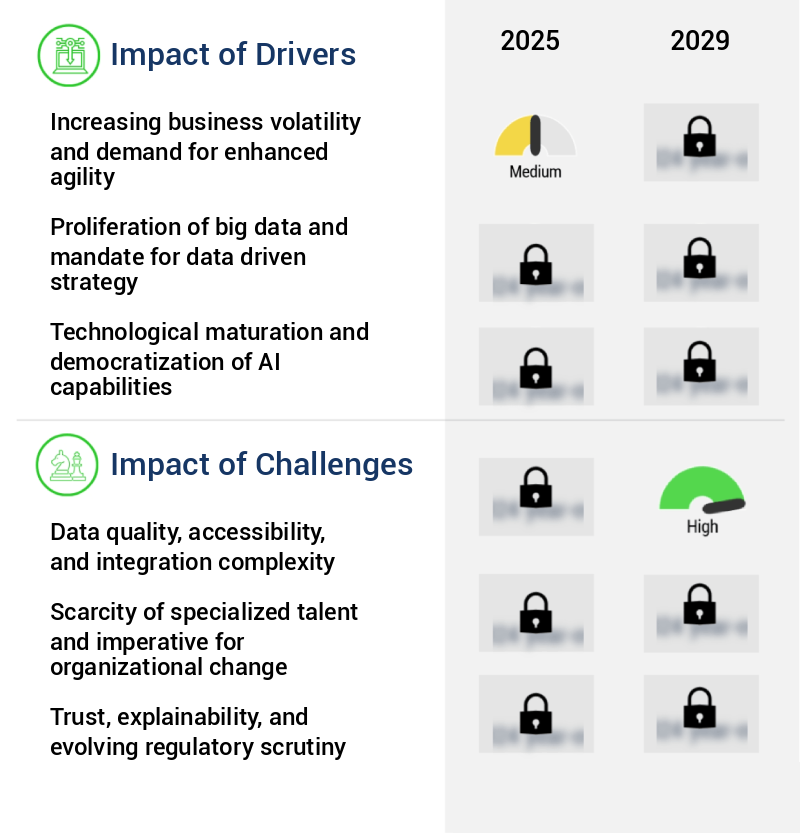
The escalating business volatility and the growing necessity for organizations to respond swiftly to market demands are primary drivers fueling market growth.
- The market is experiencing significant growth due to the increasing complexity and volatility in the global business environment. Traditional financial planning methods, relying heavily on historical data and annual or quarterly cycles, are becoming inadequate in this era of frequent disruptions, such as geopolitical tensions, supply chain fragmentation, and sudden inflationary pressures. AI technology offers solutions to these challenges by providing real-time insights and forecasting capabilities, enabling organizations to adapt quickly to market changes.
- For instance, a leading retailer reported a 15% increase in sales forecast accuracy using AI, while a manufacturing firm reduced downtime by 20% through predictive maintenance. These improvements lead to enhanced operational efficiency and improved business outcomes.
Prevailing Industry Trends & Opportunities
The emergence of generative AI and conversational analytics represents a significant market trend in the contemporary technological landscape.
- The market is undergoing a significant transformation, with the adoption of generative artificial intelligence and conversational interfaces becoming a prominent trend. This shift represents a paradigm change in how finance professionals engage with data and analytical systems, moving beyond traditional, menu-driven dashboards and complex query builders. Generative AI enables users to pose complex questions and requests in natural language, fostering a more intuitive and human-centric interaction. This trend is democratizing advanced analytics, making powerful tools accessible to finance team members who may not have deep technical expertise in data science or programming.
- According to recent studies, the use of AI in financial planning and analysis has led to a 25% increase in forecast accuracy and a 15% reduction in data analysis time compared to traditional methods. These business outcomes underscore the potential of AI to streamline financial processes and enhance decision-making capabilities.
Significant Market Challenges
The integration of data with optimal quality and ease of access, while ensuring complexity, is a significant challenge impeding industry growth.
- Amidst the dynamic business landscape, Artificial Intelligence (AI) in Financial Planning and Analysis (FP&A) is gaining significant traction. AI's role extends beyond automating repetitive tasks to providing insights and predictions that drive strategic decision-making. In manufacturing, AI-driven FP&A solutions have led to a 20% reduction in forecasting errors, enabling organizations to optimize inventory levels and mitigate production risks. In healthcare, AI FP&A systems have improved forecast accuracy by 15%, enabling better resource allocation and patient care planning. However, a paramount challenge impedes widespread adoption and efficacy: data quality and integration. The predictive power of AI models hinges on data's quality, volume, and integrity.
- Financial planning and analysis functions grapple with data fragmented across disparate systems, often suffering from inconsistencies, missing values, historical inaccuracies, and a lack of standardized definitions. Addressing these challenges requires robust data management strategies and advanced AI technologies that can handle complex data integration and ensure data accuracy.
In-Depth Market Segmentation: AI In Financial Planning And Analysis Market
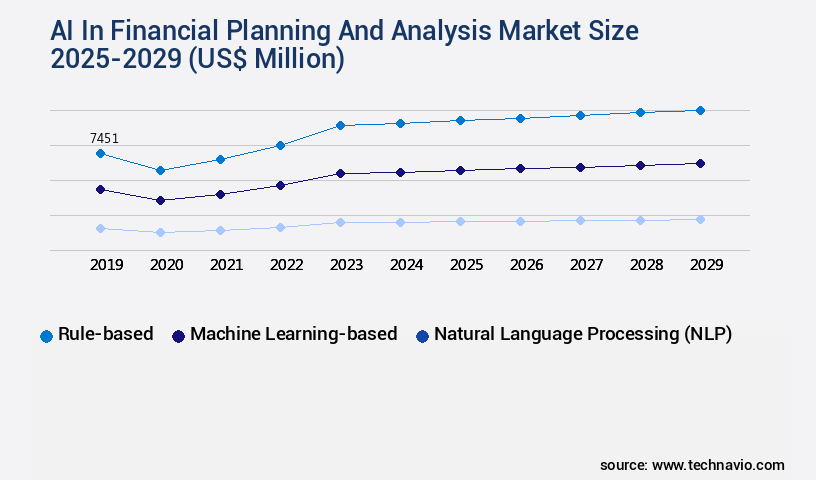
The AI in financial planning and analysis industry research report provides comprehensive data (region-wise segment analysis), with forecasts and estimates in "USD million" for the period 2025-2029, as well as historical data from 2019-2023 for the following segments.
- Type
- Rule-based
- Machine learning-based
- Natural language processing (NLP)
- Application
- Predictive forecasting and planning
- Advanced analytics and insights
- Risk management and fraud detection
- Automated financial reporting and analysis
- Others
- Deployment
- Cloud-based
- On-premises
- Geography
- North America
- US
- Canada
- Europe
- France
- Germany
- UK
- APAC
- China
- India
- Japan
- South Korea
- South America
- Brazil
- Rest of World (ROW)
- North America
By Type Insights
The rule-based segment is estimated to witness significant growth during the forecast period.
In the dynamic realm of financial planning and analysis, artificial intelligence (AI) plays a pivotal role in enhancing business performance and mitigating risks. AI applications span from fraud detection algorithms to portfolio performance metrics, credit scoring models, and customer churn prediction. Scenario planning software, due diligence automation, data visualization dashboards, and financial statement automation are increasingly relying on AI-driven technologies. The integration of blockchain technology finance, high-frequency trading systems, and predictive modeling techniques further strengthens AI's presence. anomaly detection systems, investment portfolio optimization, real-time data processing, and algorithmic trading strategies leverage machine learning models and quantitative investment strategies.
Advanced analytics platforms and AI-powered audit tools facilitate regulatory compliance, while cloud-based financial solutions and financial modeling software streamline operations. AI-driven risk assessment and risk management platforms enable proactive risk mitigation, ensuring business resilience. A recent study reveals that rule-based AI systems improve data validation efficiency by up to 25%, underpinning their significance in the financial planning and analysis landscape.
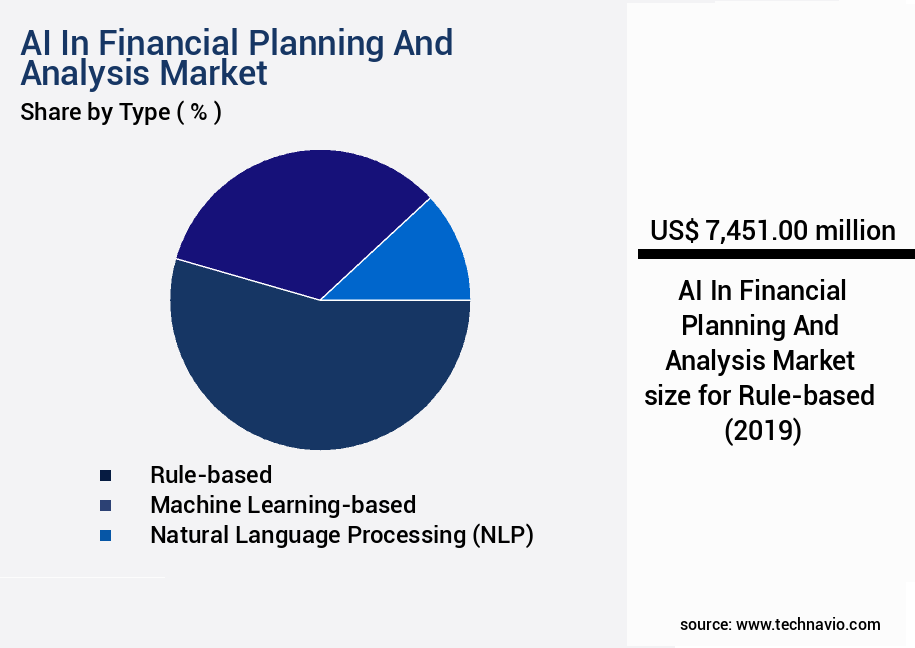
The Rule-based segment was valued at USD 7.45 billion in 2019 and showed a gradual increase during the forecast period.
Regional Analysis
North America is estimated to contribute 40% to the growth of the global market during the forecast period.Technavio's analysts have elaborately explained the regional trends and drivers that shape the market during the forecast period.
See How AI In Financial Planning And Analysis Market Demand is Rising in North America Request Free Sample
The market is experiencing significant growth and transformation, with North America leading the way. This region, encompassing the United States and Canada, is home to a multitude of technology innovators, including established software giants and venture-backed startups, particularly in tech hubs such as Silicon Valley, Seattle, and Toronto. With the presence of numerous multinational corporations headquartered in this region, the need for advanced analytical tools to manage complex financial data and gain strategic insights is paramount. According to recent studies, the North American market for AI in financial planning and analysis is projected to grow at a robust pace, with one report indicating a 25% increase in operational efficiency for early adopters.
Another study reveals that AI implementation in financial planning and analysis can lead to cost savings of up to 20%. These factors underscore the market's importance in driving business success and competitive advantage.
Customer Landscape of AI In Financial Planning And Analysis Industry
Competitive Intelligence by Technavio Analysis: Leading Players in the AI In Financial Planning And Analysis Market
Companies are implementing various strategies, such as strategic alliances, ai in financial planning and analysis market forecast, partnerships, mergers and acquisitions, geographical expansion, and product/service launches, to enhance their presence in the industry.
Alteryx Inc. - The company specializes in artificial intelligence (AI) applications for financial planning and analysis. Through automation of forecasting, scenario modeling, and financial reporting processes, this entity enhances efficiency and accuracy in financial management.
The industry research and growth report includes detailed analyses of the competitive landscape of the market and information about key companies, including:
- Alteryx Inc.
- Amazon Web Services Inc.
- Anaplan Inc.
- Board International SA
- DataRobot Inc.
- Dun and Bradstreet Holdings Inc.
- Google LLC
- H2O.ai Inc.
- HighRadius Corp.
- International Business Machines Corp.
- Microsoft Corp.
- Oracle Corp.
- Palantir Technologies Inc.
- Planful Inc.
- Prophix Software Inc.
- Salesforce Inc.
- SAP SE
- SAS Institute Inc.
- TIBCO Software Inc.
- Workday Inc.
Qualitative and quantitative analysis of companies has been conducted to help clients understand the wider business environment as well as the strengths and weaknesses of key industry players. Data is qualitatively analyzed to categorize companies as pure play, category-focused, industry-focused, and diversified; it is quantitatively analyzed to categorize companies as dominant, leading, strong, tentative, and weak.
Recent Development and News in AI In Financial Planning And Analysis Market
- In August 2024, Goldman Sachs, a leading global investment bank, announced the launch of its new AI-powered financial planning and analysis tool, Marquee FP&A, designed to automate financial forecasting and reporting for corporate clients (Goldman Sachs Press Release, 2024). This development marks a significant stride in the adoption of AI technology for financial planning and analysis in the corporate sector.
- In November 2024, IBM and JPMorgan Chase & Co. Formed a strategic partnership to integrate IBM's Watson AI technology into JPMorgan's financial planning and analysis platform, enabling more accurate and efficient financial forecasting for the bank's corporate clients (IBM Press Release, 2024). This collaboration underscores the growing importance of AI in financial planning and analysis solutions.
- In February 2025, Fiserv, a leading global provider of financial services technology solutions, acquired Planful, a financial planning and analysis software company, for approximately USD750 million. The acquisition strengthened Fiserv's position in the financial planning and analysis market by integrating Planful's AI-powered platform into its offerings (Fiserv Press Release, 2025).
- In May 2025, the European Central Bank (ECB) announced its plans to invest €1 billion in a new AI research initiative focused on financial stability and supervision, including AI applications for financial planning and analysis (ECB Press Release, 2025). This significant investment highlights the growing importance of AI in the financial sector and the increasing role of European institutions in driving its adoption.
Dive into Technavio's robust research methodology, blending expert interviews, extensive data synthesis, and validated models for unparalleled AI In Financial Planning And Analysis Market insights. See full methodology.
|
Market Scope |
|
|
Report Coverage |
Details |
|
Page number |
242 |
|
Base year |
2024 |
|
Historic period |
2019-2023 |
|
Forecast period |
2025-2029 |
|
Growth momentum & CAGR |
Accelerate at a CAGR of 26.9% |
|
Market growth 2025-2029 |
USD 48865.7 million |
|
Market structure |
Fragmented |
|
YoY growth 2024-2025(%) |
22.7 |
|
Key countries |
US, China, Germany, UK, Canada, India, France, Japan, Brazil, and South Korea |
|
Competitive landscape |
Leading Companies, Market Positioning of Companies, Competitive Strategies, and Industry Risks |
Why Choose Technavio for AI In Financial Planning And Analysis Market Insights?
"Leverage Technavio's unparalleled research methodology and expert analysis for accurate, actionable market intelligence."
The integration of Artificial Intelligence (AI) in the financial planning and analysis market is revolutionizing the way businesses manage their financial operations. AI-powered investment decision support systems are streamlining the financial planning process, enabling organizations to make data-driven investment decisions with greater accuracy and efficiency. Automated financial statement preparation using machine learning algorithms is reducing errors and saving time, allowing finance teams to focus on strategic initiatives. Machine learning fraud detection models are enhancing financial risk management, preventing potential losses and ensuring regulatory compliance. Predictive modeling for financial risk assessment is providing advanced analytics for financial planning, enabling businesses to anticipate market trends and mitigate risks. AI-driven regulatory compliance is automating regulatory reporting, reducing the risk of non-compliance and associated penalties. Robotic process automation in finance is streamlining repetitive tasks, such as data entry and reconciliation, freeing up time for more strategic initiatives. Natural language processing financial reports is making it easier to analyze financial data, providing valuable insights for operational planning and supply chain optimization. Advanced analytics for financial planning is enabling businesses to gain a deeper understanding of their financial data, leading to more informed decision-making. Blockchain technology for financial transactions is increasing security and transparency, reducing the risk of fraud and errors. AI-powered portfolio optimization strategies are using deep learning algorithms for trading, enabling high-frequency trading algorithms to make more accurate predictions and execute trades in real-time. AI in financial statement audit is improving the accuracy and efficiency of audits, reducing the time and cost associated with manual processes. AI-driven customer risk assessment is enabling businesses to better understand their customers' financial profiles, improving customer service and reducing the risk of bad debt.
Real-time financial data processing is providing businesses with up-to-the-minute insights, enabling them to respond quickly to market changes. Cloud-based AI for financial institutions is providing scalability and flexibility, reducing the need for costly hardware and IT infrastructure. Sentiment analysis for market prediction is providing valuable insights into market trends, enabling businesses to make informed investment decisions. AI-powered credit scoring models are improving the accuracy of credit risk assessments, reducing the risk of default and associated losses. In summary, the integration of AI in the financial planning and analysis market is providing businesses with more accurate, efficient, and effective financial management tools, enabling them to make informed decisions, reduce risks, and improve operational planning. The use of AI is expected to grow significantly in the coming years, with some estimates suggesting that the market will grow by over 20% annually. This growth is expected to outpace traditional financial management tools, highlighting the transformative impact of AI on the financial services industry.
What are the Key Data Covered in this AI In Financial Planning And Analysis Market Research and Growth Report?
-
What is the expected growth of the AI In Financial Planning And Analysis Market between 2025 and 2029?
-
USD 48.87 billion, at a CAGR of 26.9%
-
-
What segmentation does the market report cover?
-
The report is segmented by Type (Rule-based, Machine learning-based, and Natural language processing (NLP)), Application (Predictive forecasting and planning, Advanced analytics and insights, Risk management and fraud detection, Automated financial reporting and analysis, and Others), Deployment (Cloud-based and On-premises), and Geography (North America, Europe, APAC, South America, and Middle East and Africa)
-
-
Which regions are analyzed in the report?
-
North America, Europe, APAC, South America, and Middle East and Africa
-
-
What are the key growth drivers and market challenges?
-
Increasing business volatility and demand for enhanced agility, Data quality, accessibility, and integration complexity
-
-
Who are the major players in the AI In Financial Planning And Analysis Market?
-
Alteryx Inc., Amazon Web Services Inc., Anaplan Inc., Board International SA, DataRobot Inc., Dun and Bradstreet Holdings Inc., Google LLC, H2O.ai Inc., HighRadius Corp., International Business Machines Corp., Microsoft Corp., Oracle Corp., Palantir Technologies Inc., Planful Inc., Prophix Software Inc., Salesforce Inc., SAP SE, SAS Institute Inc., TIBCO Software Inc., and Workday Inc.
-
We can help! Our analysts can customize this AI in financial planning and analysis market research report to meet your requirements.
 RIA -
RIA - 
