AI In Government And Defense Market Size 2025-2029
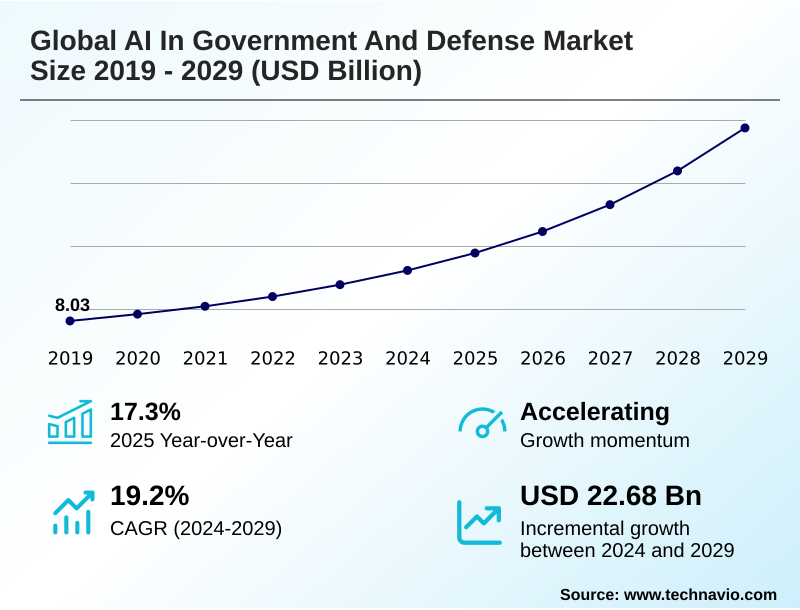
The ai in government and defense market size is valued to increase by USD 22.68 billion, at a CAGR of 19.2% from 2024 to 2029. Intensifying geopolitical competition and imperative for technological superiority will drive the ai in government and defense market.
Major Market Trends & Insights
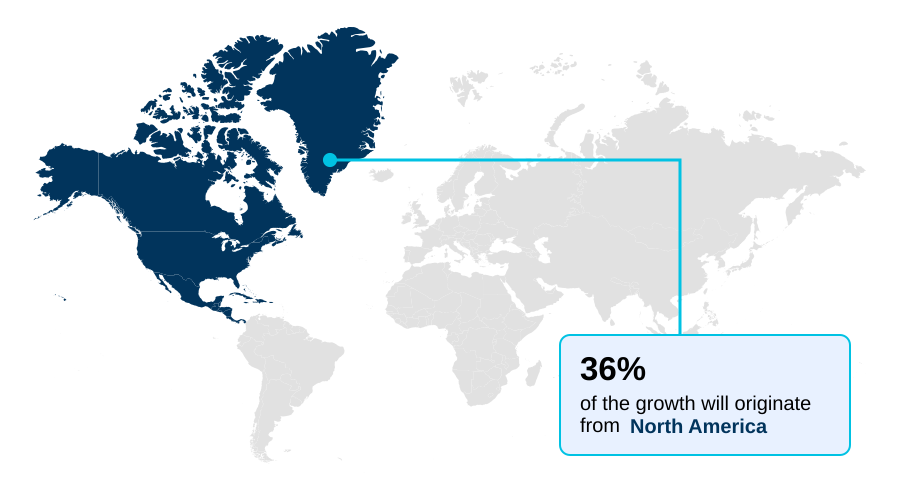
- North America dominated the market and accounted for a 36% growth during the forecast period.
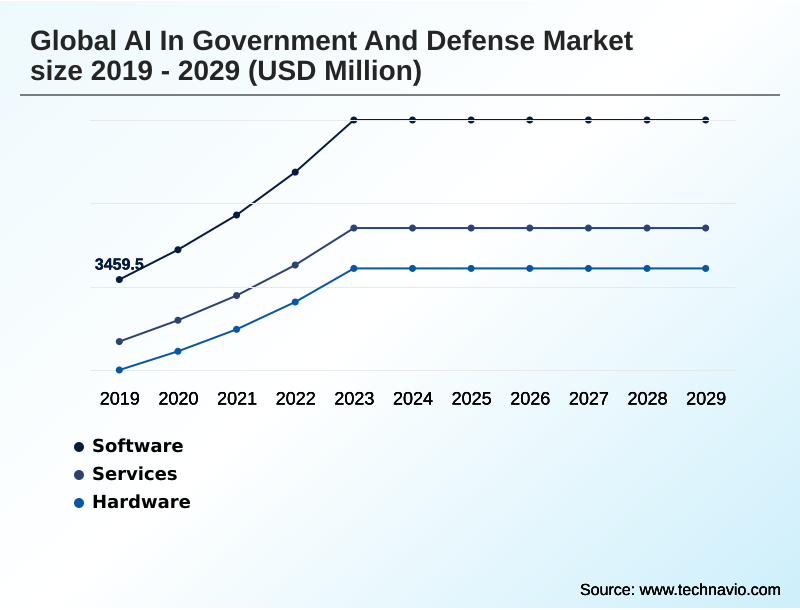
- By Component - Software segment was valued at USD 5.92 billion in 2023
- By Technology - Machine learning segment accounted for the largest market revenue share in 2023
Market Size & Forecast
- Market Opportunities: USD 30.71 billion
- Market Future Opportunities: USD 22.68 billion
- CAGR from 2024 to 2029 : 19.2%
Market Summary
- The AI in government and defense market is undergoing a fundamental transformation, moving from hardware-centric platforms to software-defined, data-driven ecosystems. This evolution is driven by the strategic imperative to achieve information superiority and decision advantage in increasingly complex operational environments.
- The rapid maturation of commercial technologies, particularly in machine learning and data analytics, provides a continuous influx of innovation that defense agencies are adapting for mission-critical functions. Key applications include enhancing intelligence, surveillance, and reconnaissance (ISR) through automated data processing and enabling more sophisticated command and control systems.
- For example, a naval force can deploy AI-powered predictive maintenance models that analyze real-time sensor data from its fleet, identifying potential equipment failures weeks in advance. This approach has been shown to increase vessel availability by over 20%, ensuring higher operational readiness while reducing long-term costs.
- However, integrating these advanced systems with legacy infrastructure and ensuring robust cybersecurity remain significant challenges that organizations must address to fully realize the benefits of AI.
What will be the Size of the AI In Government And Defense Market during the forecast period?
Get Key Insights on Market Forecast (PDF) Get Free Sample
How is the AI In Government And Defense Market Segmented?
The ai in government and defense industry research report provides comprehensive data (region-wise segment analysis), with forecasts and estimates in "USD million" for the period 2025-2029, as well as historical data from 2019-2023 for the following segments.
- Component
- Software
- Services
- Hardware
- Technology
- Machine learning
- Natural language processing
- Computer vision
- Robotics and autonomous systems
- Others
- Application
- ISR
- Cybersecurity
- Autonomous systems and vehicles
- Command and control
- Others
- Geography
- North America
- US
- Canada
- Mexico
- Europe
- Germany
- UK
- France
- APAC
- China
- India
- Japan
- Middle East and Africa
- Israel
- UAE
- Turkey
- South America
- Brazil
- Argentina
- Colombia
- Rest of World (ROW)
- North America
By Component Insights
The software segment is estimated to witness significant growth during the forecast period.
The software segment is the strategic core of the AI in government and defense market, encompassing mission-critical algorithms and platforms.
These systems leverage natural language processing and large language models for intelligence surveillance reconnaissance, particularly analyzing open-source intelligence within secure, air-gapped environments.
Key applications include data fusion analytics for sensor fusion, autonomous navigation for unmanned platforms, and automated target recognition, where AI models have demonstrated a 30% improvement in accuracy over legacy systems.
For instance, developing a synthetic training environment to simulate counter-insurgency operations or information warfare scenarios relies entirely on advanced software, highlighting its role in enhancing combat effectiveness and reducing cognitive load for personnel.
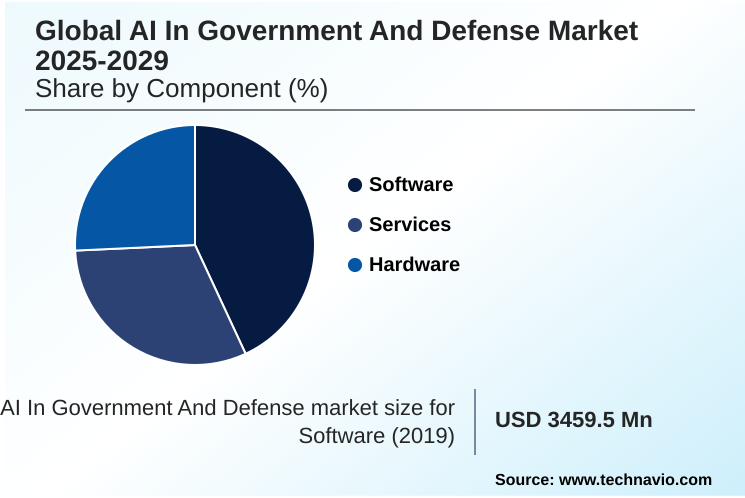
The Software segment was valued at USD 5.92 billion in 2023 and showed a gradual increase during the forecast period.
Regional Analysis
North America is estimated to contribute 36% to the growth of the global market during the forecast period.Technavio’s analysts have elaborately explained the regional trends and drivers that shape the market during the forecast period.
See How AI In Government And Defense Market Demand is Rising in North America Get Free Sample
The geographic landscape is defined by North America's leadership in large-scale AI integration, with an estimated growth rate of 19.3%, driven by a focus on network-centric warfare and joint all-domain operations.
This strategy leverages AI for command and control and cyber defense to achieve information superiority. In contrast, the APAC region is the fastest-growing market, expanding at approximately 20.0%, fueled by widespread military modernization and a regional arms race.
Nations there are investing in robotics and autonomous systems and advanced electronic warfare capabilities to gain an asymmetric advantage. European efforts center on multinational collaboration for developing shared platforms, emphasizing predictive maintenance and geospatial intelligence analysis to bolster operational readiness.
This regional divergence in priorities and investment creates a complex global market where situational awareness and achieving a force multiplier through technology are common goals.
Market Dynamics
Our researchers analyzed the data with 2024 as the base year, along with the key drivers, trends, and challenges. A holistic analysis of drivers will help companies refine their marketing strategies to gain a competitive advantage.
- The strategic value of artificial intelligence is realized across the entire defense lifecycle, beginning with advanced AI for mission planning and simulation. The use of sophisticated AI models for wargaming simulation allows commanders to test strategies against adaptive adversaries, revealing insights that were previously unattainable.
- This planning feeds directly into AI-powered command and control systems, which are central to the AI role in JADC2 implementation. In operational execution, the benefits of edge AI in military applications are profound, enabling AI for autonomous navigation in UAVs and other platforms in communication-denied environments.
- The role of AI in autonomous systems extends to complex human-machine teaming in combat scenarios. For threat management, AI for counter-drone system technology and using AI for threat detection are becoming standard requirements. Post-mission, AI for intelligence data analysis, including specialized AI in ISR data processing, and generative AI for intelligence summaries accelerate the production of actionable intelligence.
- The cumulative AI impact on military decision making is transformative, creating more adaptive and resilient forces. The benefits of AI in logistics planning and AI for predictive maintenance in defense also significantly boost operational readiness, with AI tools for military training now offering scenarios that are 50% more complex and adaptive than scripted exercises.
- Moreover, AI in cybersecurity threat hunting and broader AI applications in cybersecurity defense are essential for protecting these interconnected systems.
What are the key market drivers leading to the rise in the adoption of AI In Government And Defense Industry?
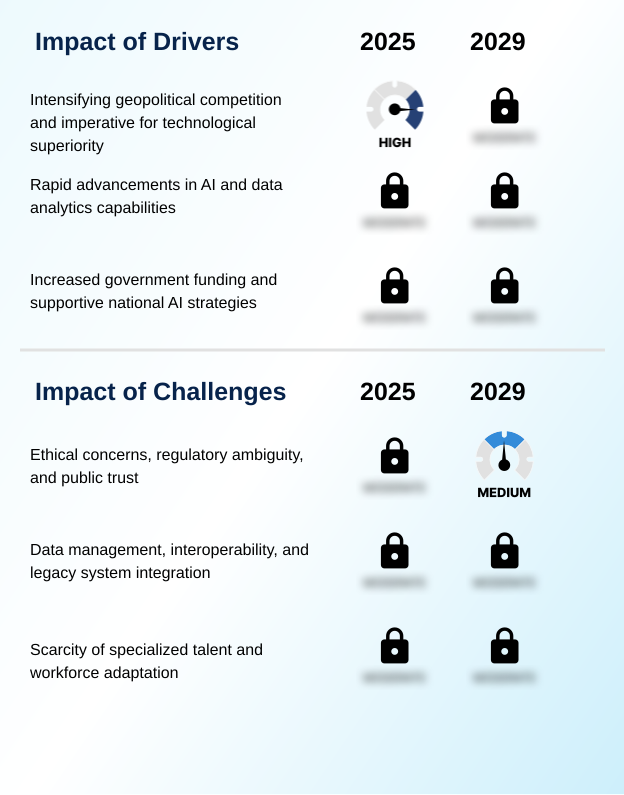
- Intensifying geopolitical competition and the imperative for technological superiority are key drivers of market growth.
- Intensifying geopolitical competition is a primary driver, compelling nations to seek information superiority and a decisive strategic advantage. This has led to a 25% average increase in national funding for AI initiatives focused on intelligentized warfare.
- The JADC2 initiative exemplifies this, aiming to create unified, data-driven ecosystems that shorten the sensor-to-shooter timeline significantly. The rapid advancement of commercial machine learning, particularly reinforcement learning and predictive analytics models, serves as a powerful force multiplier.
- These technologies, managed through MLOps platforms, can process data volumes over 100 times larger than human teams, enabling sophisticated signals intelligence processing and geospatial intelligence analysis to achieve a clear decision advantage in complex scenarios.
What are the market trends shaping the AI In Government And Defense Industry?
- The proliferation of domain-specific generative AI and large language models is a defining upcoming market trend. This shift emphasizes secure, mission-tuned systems over general-purpose models for government and defense applications.
- Key market trends are centered on decentralizing intelligence to the tactical edge and the proliferation of mission-tuned models. The deployment of generative AI in unmanned aerial systems and for creating decision support systems is accelerating mission planning, with some platforms drafting initial courses of action up to five times faster than manual methods.
- This move toward expeditionary warfare is supported by swarm intelligence and cognitive electronic warfare capabilities, enabling attritable autonomous systems to conduct battlefield data processing in contested environments. The goal is to facilitate human-on-the-loop control rather than full autonomy in critical engagements.
- Furthermore, the use of real-time object recognition at the edge reduces latency by over 60%, a crucial factor for survivability and combat effectiveness.
What challenges does the AI In Government And Defense Industry face during its growth?
- Ethical concerns, regulatory ambiguity, and the erosion of public trust present key challenges affecting industry growth.
- Significant challenges hinder market adoption, primarily the ethical concerns surrounding autonomous weapon systems and the complexities of algorithmic warfare, which can increase project development costs by over 40%. Integrating modern AI into legacy systems to support network-centric operations and multi-domain operations presents a major hurdle, with interoperability issues causing significant delays.
- The scarcity of specialized talent for developing explainable AI and ensuring cyber resilience creates a critical bottleneck. Furthermore, establishing resilient communications for federated learning and digital twin technology in combat scenarios is essential for mission-critical functions, yet the required infrastructure is often lacking. This talent and infrastructure gap directly impacts lethality and survivability programs.
Exclusive Technavio Analysis on Customer Landscape
The ai in government and defense market forecasting report includes the adoption lifecycle of the market, covering from the innovator’s stage to the laggard’s stage. It focuses on adoption rates in different regions based on penetration. Furthermore, the ai in government and defense market report also includes key purchase criteria and drivers of price sensitivity to help companies evaluate and develop their market growth analysis strategies.
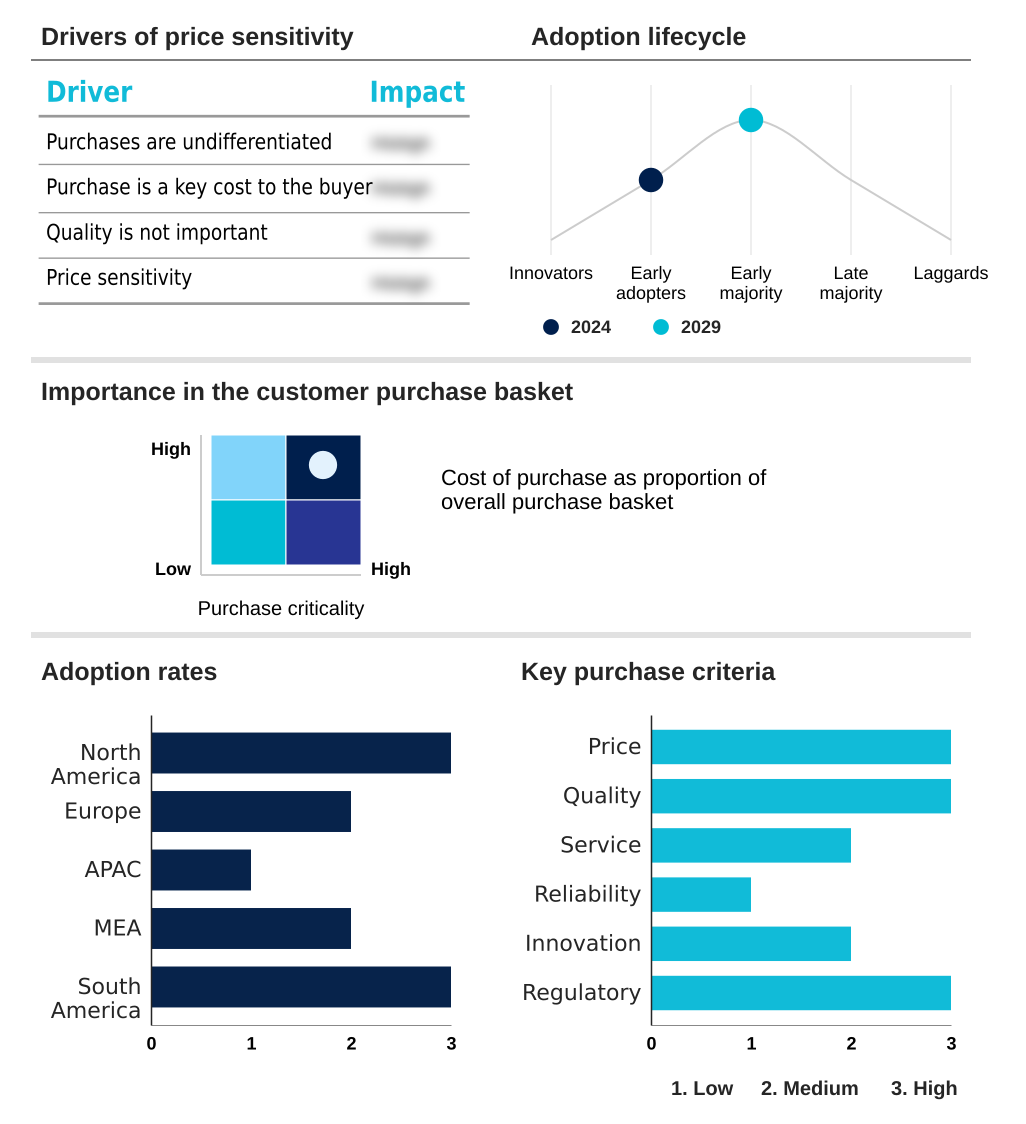
Customer Landscape of AI In Government And Defense Industry
Competitive Landscape
Companies are implementing various strategies, such as strategic alliances, ai in government and defense market forecast, partnerships, mergers and acquisitions, geographical expansion, and product/service launches, to enhance their presence in the industry.
Anduril Industries Inc. - Delivers AI-powered command and control, autonomous surveillance, and advanced unmanned aerial systems, focusing on integrated software-defined defense solutions.
The industry research and growth report includes detailed analyses of the competitive landscape of the market and information about key companies, including:
- Anduril Industries Inc.
- Anomali Inc.
- BAE Systems Plc
- Darktrace Holdings Ltd.
- Epirus Inc.
- General Dynamics Corp.
- Helsing GmbH
- IBM Corp.
- L3Harris Technologies Inc.
- Leidos Holdings Inc.
- Lockheed Martin Corp.
- Northrop Grumman Corp.
- NVIDIA Corp.
- Palantir Technologies Inc.
- Rafael Advanced Defense Ltd.
- RTX Corp.
- Shield AI
- Thales Group
Qualitative and quantitative analysis of companies has been conducted to help clients understand the wider business environment as well as the strengths and weaknesses of key industry players. Data is qualitatively analyzed to categorize companies as pure play, category-focused, industry-focused, and diversified; it is quantitatively analyzed to categorize companies as dominant, leading, strong, tentative, and weak.
Recent Development and News in Ai in government and defense market
- In August, 2024, RTX Corp. was awarded a major contract to develop and integrate an advanced AI-powered command and control system for a national air defense network, aiming to accelerate decision cycles in contested airspace.
- In November, 2024, Lockheed Martin Corp. announced the acquisition of a specialized AI software firm focused on generative AI for mission planning, enhancing its portfolio of autonomous systems and decision support tools.
- In February, 2025, Helsing GmbH entered into a strategic partnership with a European defense agency to co-develop a real-time sensor fusion platform for multi-domain operations, leveraging proprietary machine learning algorithms.
- In May, 2025, Shield AI demonstrated its next-generation Hivemind AI pilot successfully operating a swarm of collaborative combat aircraft in a complex, simulated electronic warfare environment, achieving mission objectives autonomously.
Dive into Technavio’s robust research methodology, blending expert interviews, extensive data synthesis, and validated models for unparalleled AI In Government And Defense Market insights. See full methodology.
| Market Scope | |
|---|---|
| Page number | 313 |
| Base year | 2024 |
| Historic period | 2019-2023 |
| Forecast period | 2025-2029 |
| Growth momentum & CAGR | Accelerate at a CAGR of 19.2% |
| Market growth 2025-2029 | USD 22675.9 million |
| Market structure | Fragmented |
| YoY growth 2024-2025(%) | 17.3% |
| Key countries | US, Canada, Mexico, Germany, UK, France, Italy, Spain, The Netherlands, China, India, Japan, South Korea, Australia, Indonesia, Israel, UAE, Turkey, Saudi Arabia, South Africa, Brazil, Argentina and Colombia |
| Competitive landscape | Leading Companies, Market Positioning of Companies, Competitive Strategies, and Industry Risks |
Research Analyst Overview
- The AI in government and defense market is driven by a strategic pivot to software-defined capabilities, leveraging foundational technologies like machine learning, reinforcement learning, and natural language processing. The integration of large language models and generative AI into MLOps platforms is enabling advanced data fusion analytics and geospatial intelligence analysis.
- This supports critical multi-domain operations through enhanced command and control and cognitive electronic warfare. In practice, predictive maintenance and predictive analytics models are optimizing fleet readiness, while robotic process automation streamlines logistics.
- The development of a synthetic training environment is a key boardroom-level focus, forcing decisions on budget allocation between virtual and live exercises, especially as AI-driven systems demonstrate a 40% reduction in training costs. The push for autonomous navigation and real-time object recognition in unmanned aerial systems and robotic combat vehicles is enabled by breakthroughs in computer vision and sensor fusion.
- Concurrently, the industry grapples with developing explainable AI for autonomous weapon systems, using digital twin technology and federated learning to ensure network-centric operations are secure. This imperative is creating new applications in signals intelligence processing, automated target recognition, cyber defense, and human-machine teaming, all central to the JADC2 initiative.
What are the Key Data Covered in this AI In Government And Defense Market Research and Growth Report?
-
What is the expected growth of the AI In Government And Defense Market between 2025 and 2029?
-
USD 22.68 billion, at a CAGR of 19.2%
-
-
What segmentation does the market report cover?
-
The report is segmented by Component (Software, Services, Hardware), Technology (Machine learning, Natural language processing, Computer vision, Robotics and autonomous systems, Others), Application (ISR, Cybersecurity, Autonomous systems and vehicles, Command and control, Others) and Geography (North America, Europe, APAC, Middle East and Africa, South America)
-
-
Which regions are analyzed in the report?
-
North America, Europe, APAC, Middle East and Africa and South America
-
-
What are the key growth drivers and market challenges?
-
Intensifying geopolitical competition and imperative for technological superiority, Ethical concerns, regulatory ambiguity, and public trust
-
-
Who are the major players in the AI In Government And Defense Market?
-
Anduril Industries Inc., Anomali Inc., BAE Systems Plc, Darktrace Holdings Ltd., Epirus Inc., General Dynamics Corp., Helsing GmbH, IBM Corp., L3Harris Technologies Inc., Leidos Holdings Inc., Lockheed Martin Corp., Northrop Grumman Corp., NVIDIA Corp., Palantir Technologies Inc., Rafael Advanced Defense Ltd., RTX Corp., Shield AI and Thales Group
-
Market Research Insights
- Market dynamics are increasingly shaped by the pursuit of information superiority and decision advantage. Investments are targeted at technologies that accelerate the sensor-to-shooter timeline, which has been reduced by over 40% in some applications through AI integration. The focus on data-driven ecosystems enables enhanced situational awareness, allowing for a more comprehensive operational picture.
- The strategic adoption of mission-tuned models and attritable autonomous systems provides an asymmetric advantage in contested environments. These platforms improve lethality and survivability while creating a significant force multiplier. This shift towards intelligentized warfare is compelling agencies to rethink doctrine and procurement to maintain a strategic advantage in an era of algorithmic competition.
We can help! Our analysts can customize this ai in government and defense market research report to meet your requirements.
 RIA -
RIA - 
