AI In Industrial Machinery Market Analysis, Size, and Forecast 2025-2029: North America (US, Canada, and Mexico), APAC (China, Japan, and India), Europe (Germany, UK, and France), Middle East and Africa (Saudi Arabia, UAE, and South Africa), South America (Brazil, Argentina, and Colombia), and Rest of World (ROW)

AI In Industrial Machinery Market Analysis, Size, and Forecast 2025-2029:
North America (US, Canada, and Mexico), APAC (China, Japan, and India), Europe (Germany, UK, and France), Middle East and Africa (Saudi Arabia, UAE, and South Africa), South America (Brazil, Argentina, and Colombia), and Rest of World (ROW)

Published: Dec 2025 339 Pages SKU: IRTNTR81059

Market Overview at a Glance

$19.40 B
Market Opportunity
32.9%
CAGR 2024 - 2029
33.1%
North America Growth
$2.59 B
Hardware segment 2023

AI In Industrial Machinery Market Size 2025-2029

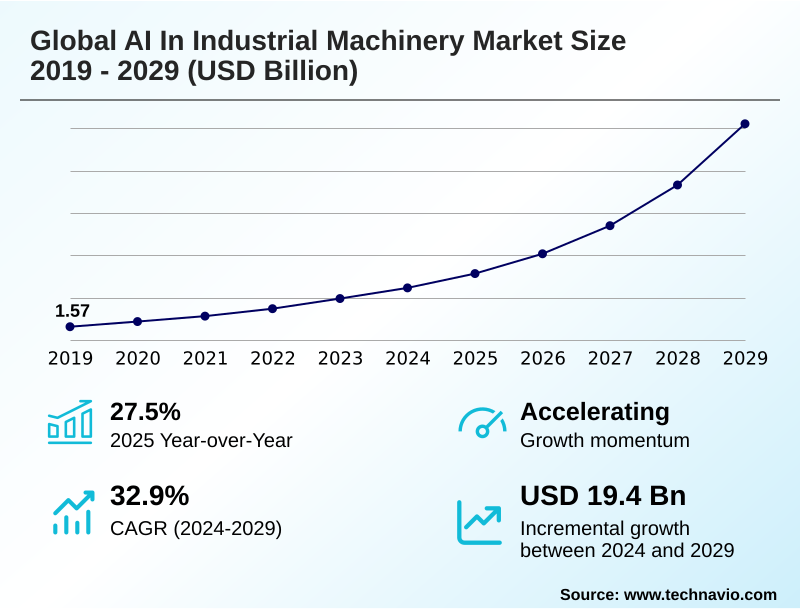
The ai in industrial machinery market size is valued to increase by USD 19.40 billion, at a CAGR of 32.9% from 2024 to 2029. Imperative for enhanced operational efficiency and predictive maintenance will drive the ai in industrial machinery market.

Major Market Trends & Insights

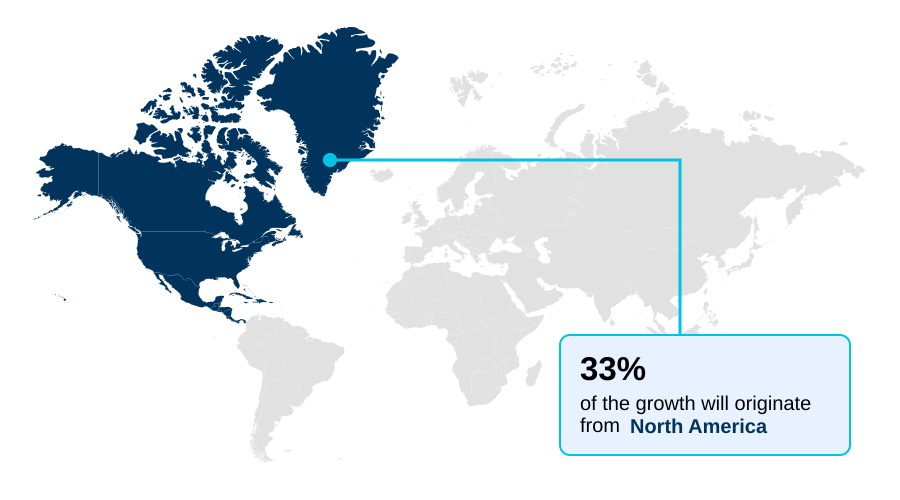
  • North America dominated the market and accounted for a 33.1% growth during the forecast period.
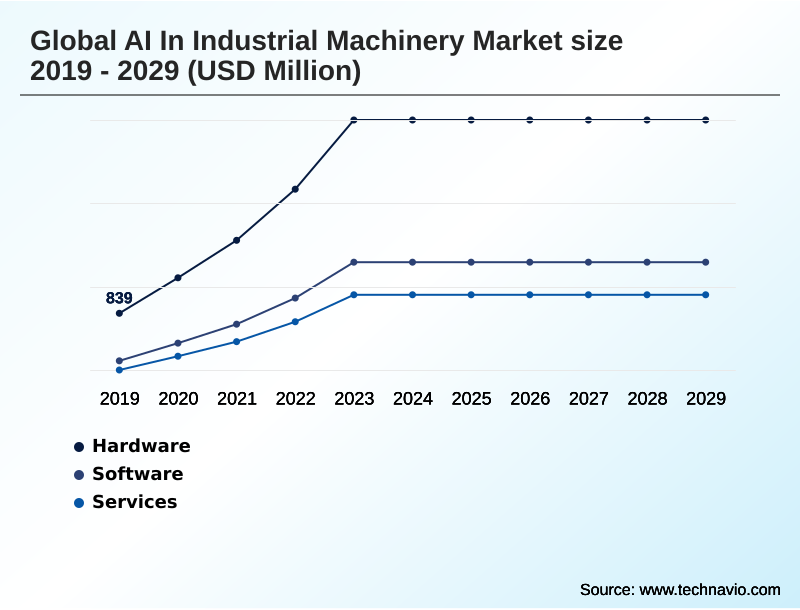
  • By Component - Hardware segment was valued at USD 2.59 billion in 2023
  • By Technology - Machine learning segment accounted for the largest market revenue share in 2023

Market Size & Forecast

  • Market Opportunities: USD 23.98 billion
  • Market Future Opportunities: USD 19.40 billion
  • CAGR from 2024 to 2029 : 32.9%

Market Summary

  • The AI in industrial machinery market is defined by the integration of intelligent systems to drive operational excellence and automation. This involves leveraging technologies like machine learning models and computer vision inspection to transform raw industrial internet of things (IIoT) data into actionable insights for real-time process optimization.
  • A key application is condition-based maintenance, where predictive maintenance algorithms analyze sensor data to forecast equipment failures, minimizing costly downtime. For instance, a smart factory ecosystem can utilize AI-driven automation to dynamically adjust production schedules in response to an unexpected supply chain disruption, rerouting materials and reallocating AI-powered robotics to maintain output.
  • This advanced human-machine interaction, powered by on-device computation and augmented worker capabilities, is crucial for building resilient and efficient manufacturing operations. The market is also seeing the rise of generative AI design and industrial copilots, which accelerate development cycles and enhance human-machine collaboration.
  • As data integration for AI models becomes more streamlined through unified platforms, the potential for autonomous process control and more sophisticated big data analytics continues to expand, making AI an indispensable tool for modern industry.

What will be the Size of the AI In Industrial Machinery Market during the forecast period?

Get Key Insights on Market Forecast (PDF) Request Free Sample

How is the AI In Industrial Machinery Market Segmented?

The ai in industrial machinery industry research report provides comprehensive data (region-wise segment analysis), with forecasts and estimates in "USD million" for the period 2025-2029, as well as historical data from 2019-2023 for the following segments.

  • Component
    • Hardware
    • Software
    • Services
  • Technology
    • Machine learning
    • Computer vision
    • Context awareness
    • Natural language processing
  • End-user
    • Automotive
    • Semiconductor
    • Oil and gas
    • Food processing
    • Others
  • Geography
    • North America
      • US
      • Canada
      • Mexico
    • APAC
      • China
      • Japan
      • India
    • Europe
      • Germany
      • UK
      • France
    • Middle East and Africa
      • Saudi Arabia
      • UAE
      • South Africa
    • South America
      • Brazil
      • Argentina
      • Colombia
    • Rest of World (ROW)

By Component Insights

The hardware segment is estimated to witness significant growth during the forecast period.

The hardware segment is foundational to the global AI in industrial machinery market, enabling advanced on-device computation and real-time data analysis.

This domain is shifting toward edge AI processing, which utilizes specialized hardware like neural processing units to run complex predictive maintenance algorithms directly on machinery, reducing latency.

The development of sophisticated AI-enabled sensors is critical for capturing high-fidelity operational technology (OT) data. This allows for more accurate computer vision inspection systems, which have demonstrated the ability to improve defect detection accuracy by more than 15%.

This move to decentralized intelligence is a key enabler for creating a responsive smart factory ecosystem and supports AI for factory automation, enhancing both efficiency and safety through improved human-machine collaboration.

Request Free Sample

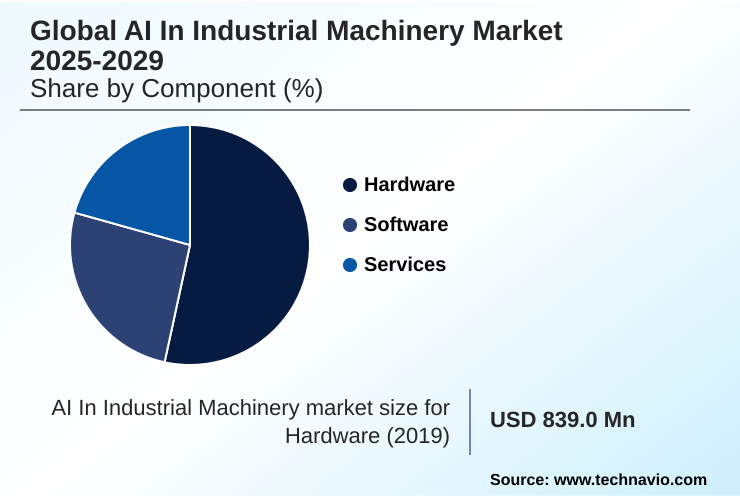
The Hardware segment was valued at USD 2.59 billion in 2023 and showed a gradual increase during the forecast period.

Request Free Sample

Regional Analysis

North America is estimated to contribute 33.1% to the growth of the global market during the forecast period.Technavio’s analysts have elaborately explained the regional trends and drivers that shape the market during the forecast period.

See How AI In Industrial Machinery Market Demand is Rising in North America Request Free Sample

The geographic landscape of the global AI in industrial machinery market is led by North America, which accounts for over 33% of the market opportunity, driven by early adoption in the US and Canada.

The region's focus on smart manufacturing AI solutions is bolstered by a strong technology infrastructure. Europe, another key region, is heavily influenced by Industrie 4.0 initiatives, promoting AI and robotics integration.

Meanwhile, APAC is the fastest-growing region, with countries like China and Japan advancing AI for factory automation to address rising labor costs and enhance production quality.

The use of autonomous industrial vehicles and AI in heavy machinery is particularly prominent in Australia's mining sector. Across these regions, the strategic deployment of big data analytics and AI-based asset management is critical for maintaining a competitive edge.

Market Dynamics

Our researchers analyzed the data with 2024 as the base year, along with the key drivers, trends, and challenges. A holistic analysis of drivers will help companies refine their marketing strategies to gain a competitive advantage.

  • Enterprises evaluating the global AI in industrial machinery market are focused on quantifiable outcomes and strategic implementation. A critical question is how AI reduces industrial downtime, with many firms turning to AI solutions for labor shortages. The decision between edge AI versus cloud AI is pivotal, as it impacts latency, security, and cost.
  • When firms implement AI predictive maintenance, they often see a greater than 20% improvement in equipment uptime compared to traditional methods. The role of AI in digital twins is expanding, allowing for complex simulations that de-risk new processes. A primary driver is optimizing industrial processes with AI, where AI computer vision for quality becomes essential.
  • However, the ROI calculation for industrial AI remains a significant hurdle, as does integrating AI with legacy systems. Cybersecurity risks of industrial AI are also a major concern for boardroom-level discussions. Success hinges on understanding machine learning for asset performance and the specific data requirements for industrial AI.
  • Furthermore, natural language processing industrial use is growing, particularly with generative AI for PLC programming. This is compelling a focus on training workforce for AI collaboration and leveraging AI-driven automation in logistics to improve overall equipment effectiveness (OEE). Firms using AI for energy consumption reduction are also finding significant operational savings, underscoring the technology's broad impact.

What are the key market drivers leading to the rise in the adoption of AI In Industrial Machinery Industry?

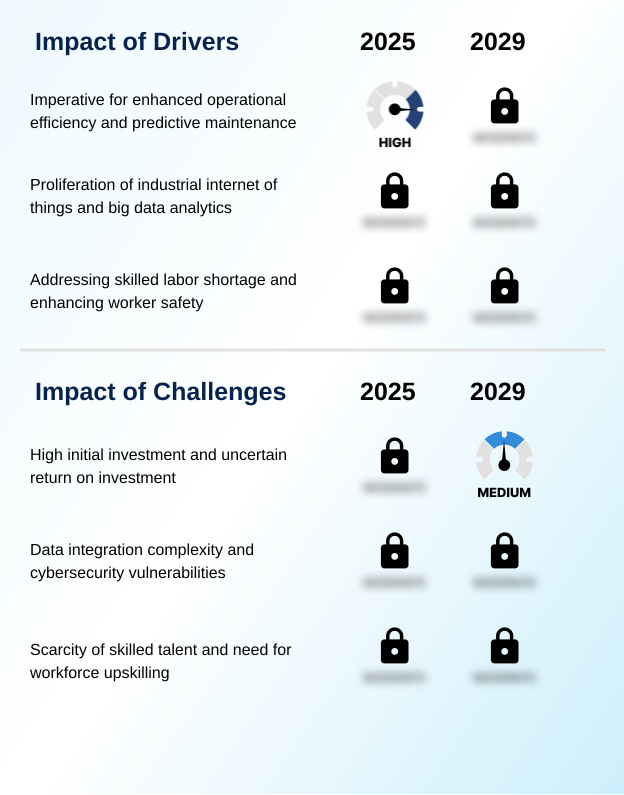
  • The imperative to enhance operational efficiency and implement predictive maintenance strategies is a key driver for market growth.

  • The primary driver for the global AI in industrial machinery market is the relentless pursuit of operational efficiency with AI.
  • Predictive maintenance, a key application, has been shown to reduce unplanned machinery downtime by up to 40% and cut maintenance costs by 25%.
  • The proliferation of the industrial internet of things (IIoT) serves as a fundamental catalyst, generating vast amounts of data that fuel machine learning models for real-time process optimization. This symbiotic relationship is enabling smarter, self-optimizing industrial ecosystems.
  • Furthermore, the persistent global shortage of skilled labor is accelerating the adoption of AI-powered robotics and autonomous systems, which augment worker capabilities and automate hazardous tasks.
  • The focus on AI for worker safety is a significant benefit, creating more resilient and sustainable industrial operations.

What are the market trends shaping the AI In Industrial Machinery Industry?

  • The emergence of generative AI, manifested through industrial copilots, is a significant upcoming trend. This technology is fundamentally reshaping human-machine interaction within industrial settings.

  • Key trends are reshaping the global AI in industrial machinery market, led by the emergence of generative AI design and industrial copilots. These AI assistants, integrated into engineering platforms, can reduce complex PLC code generation time by over 50%.
  • Another dominant trend is the shift toward edge computing in industry, which enables real-time data analysis and lowers latency for critical tasks. This decentralized approach is essential for AI-driven quality control and is being adopted by over 60% of new smart factory initiatives. The integration of AI with digital twin for manufacturing creates sophisticated virtual models for simulation and optimization.
  • This convergence of cyber-physical systems with AI-powered supply chain management allows for predictive modeling that enhances operational resilience and efficiency, forming a cornerstone of modern industrial strategy.

What challenges does the AI In Industrial Machinery Industry face during its growth?

  • The high initial investment coupled with uncertain return on investment poses a significant challenge to industry growth.

  • Significant challenges constrain the growth of the global AI in industrial machinery market, primarily the high initial investment and uncertain ROI for industrial AI. The total cost of ownership, including hardware, software, and integration services, can be substantial, with deployment costs often exceeding initial software licensing fees by a factor of three. Another major hurdle is data integration complexity.
  • Integrating siloed operational technology (OT) data with IT systems is a resource-intensive task, and poor data quality can compromise the performance of machine learning models. Cybersecurity for industrial AI remains a critical concern, as connected systems expand the attack surface, making them vulnerable to disruptions that could halt production.
  • Finally, the scarcity of skilled talent, with a 2-to-1 demand-to-supply ratio for data scientists with industrial expertise, makes it difficult to implement and manage AI initiatives.

Exclusive Technavio Analysis on Customer Landscape

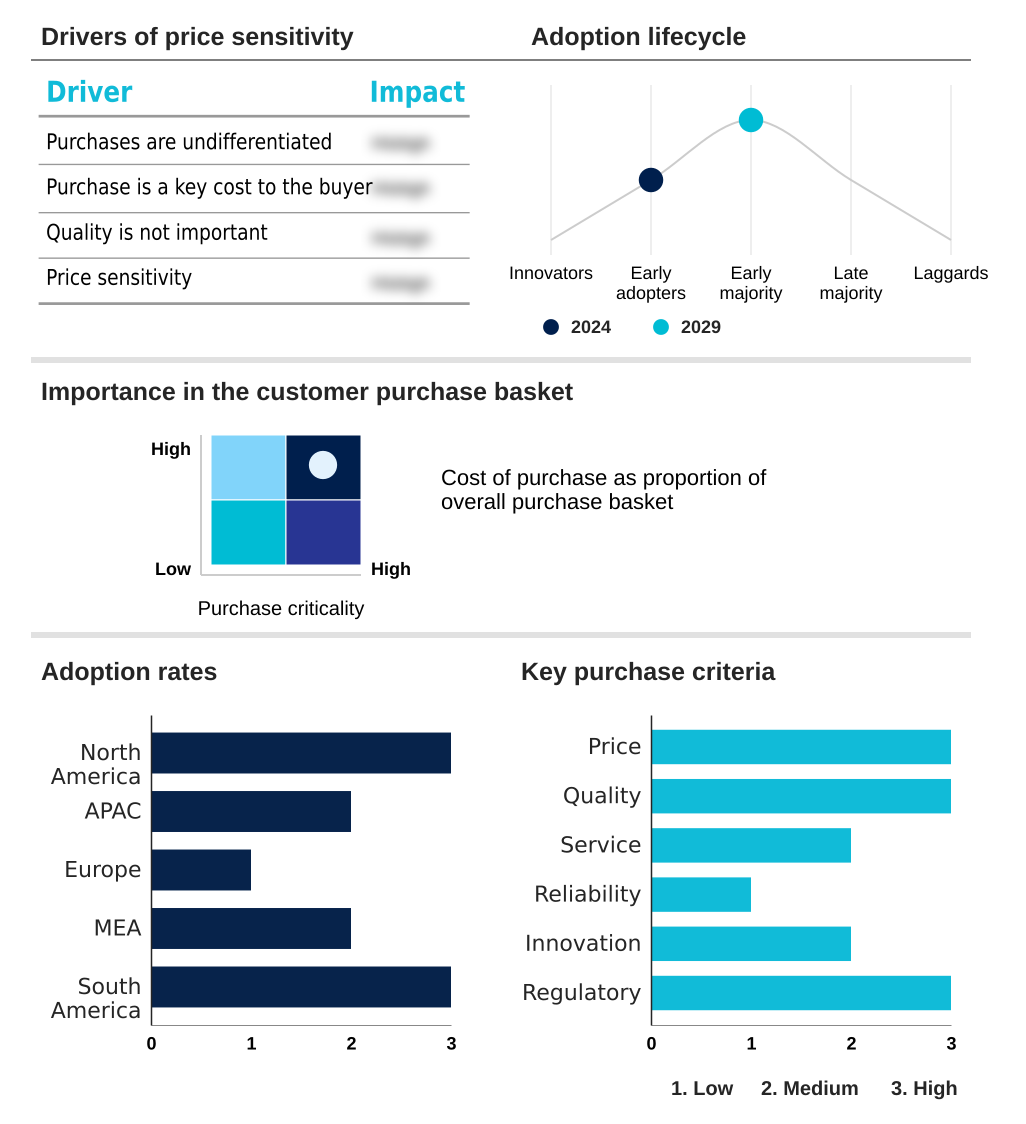
The ai in industrial machinery market forecasting report includes the adoption lifecycle of the market, covering from the innovator’s stage to the laggard’s stage. It focuses on adoption rates in different regions based on penetration. Furthermore, the ai in industrial machinery market report also includes key purchase criteria and drivers of price sensitivity to help companies evaluate and develop their market growth analysis strategies.

Customer Landscape of AI In Industrial Machinery Industry

Competitive Landscape

Companies are implementing various strategies, such as strategic alliances, ai in industrial machinery market forecast, partnerships, mergers and acquisitions, geographical expansion, and product/service launches, to enhance their presence in the industry.

ABB Ltd. - Analyzes integration of generative AI assistants for factory automation and AI-driven robotics for streamlined warehouse logistics.

The industry research and growth report includes detailed analyses of the competitive landscape of the market and information about key companies, including:

  • ABB Ltd.
  • AVEVA Group Plc
  • Bentley Systems Inc.
  • Robert Bosch GmbH
  • C3.ai Inc.
  • Caterpillar Inc.
  • Emerson Electric Co.
  • FANUC Corp.
  • General Electric Co.
  • Hitachi Ltd.
  • Honeywell International Inc.
  • IBM Corp.
  • KUKA AG
  • Microsoft Corp.
  • Mitsubishi Electric Corp.
  • NVIDIA Corp.
  • Oracle Corp.
  • Rockwell Automation Inc.
  • SAP SE
  • Siemens AG

Qualitative and quantitative analysis of companies has been conducted to help clients understand the wider business environment as well as the strengths and weaknesses of key industry players. Data is qualitatively analyzed to categorize companies as pure play, category-focused, industry-focused, and diversified; it is quantitatively analyzed to categorize companies as dominant, leading, strong, tentative, and weak.

Recent Development and News in Ai in industrial machinery market

  • In October 2024, Honeywell launched its AI-enabled Experion Operations Assistant, a new software solution designed to provide proactive insights to plant operators to improve decision-making and accelerate the move toward autonomous operations.
  • In November 2024, Siemens announced the expansion of its Industrial Copilot, a generative AI assistant, to support maintenance teams by translating complex machine error codes into plain language and providing step-by-step repair guidance.
  • In January 2025, Oracle introduced new generative AI agents for its Fusion Cloud Supply Chain and Manufacturing (SCM) suite, designed to automate routine tasks and provide data-driven insights for improved supply chain efficiency.
  • In February 2025, Intel began the rollout of its next-generation Xeon processors with built-in AI acceleration, specifically engineered to power enterprise-grade AI applications at the industrial edge.

Dive into Technavio’s robust research methodology, blending expert interviews, extensive data synthesis, and validated models for unparalleled AI In Industrial Machinery Market insights. See full methodology.

Market Scope
Page number 339
Base year 2024
Historic period 2019-2023
Forecast period 2025-2029
Growth momentum & CAGR Accelerate at a CAGR of 32.9%
Market growth 2025-2029 USD 19395.2 million
Market structure Fragmented
YoY growth 2024-2025(%) 27.5%
Key countries US, Canada, Mexico, China, Japan, India, South Korea, Australia, Indonesia, Germany, UK, France, Italy, Spain, The Netherlands, Saudi Arabia, UAE, South Africa, Israel, Turkey, Brazil, Argentina and Colombia
Competitive landscape Leading Companies, Market Positioning of Companies, Competitive Strategies, and Industry Risks

Request Free Sample

Research Analyst Overview

  • The AI in industrial machinery market is advancing through the convergence of sophisticated software and intelligent hardware. The proliferation of the industrial internet of things (IIoT) provides the data foundation for powerful machine learning models and predictive maintenance algorithms, which are becoming standard for achieving operational excellence.
  • Technologies such as computer vision inspection and natural language processing (NLP) are enabling new levels of AI-driven automation and enhanced human-machine interaction.
  • The strategic integration of AI-integrated digital twins with photorealistic simulation is a critical development, impacting boardroom decisions on capital expenditure by allowing for virtual commissioning and process optimization, which has been shown to reduce project validation times by over 40%.
  • The shift toward on-device computation, powered by advanced neural processing units and AI-enabled sensors, facilitates real-time data analysis and autonomous process control. This evolution is fostering a smart factory ecosystem where conversational interfaces and industrial copilots support augmented worker capabilities, moving the industry toward more resilient and efficient cyber-physical systems and data-driven automation.

What are the Key Data Covered in this AI In Industrial Machinery Market Research and Growth Report?

  • What is the expected growth of the AI In Industrial Machinery Market between 2025 and 2029?

    • USD 19.40 billion, at a CAGR of 32.9%

  • What segmentation does the market report cover?

    • The report is segmented by Component (Hardware, Software, Services), Technology (Machine learning, Computer vision, Context awareness, Natural language processing), End-user (Automotive, Semiconductor, Oil and gas, Food processing, Others) and Geography (North America, APAC, Europe, Middle East and Africa, South America)

  • Which regions are analyzed in the report?

    • North America, APAC, Europe, Middle East and Africa and South America

  • What are the key growth drivers and market challenges?

    • Imperative for enhanced operational efficiency and predictive maintenance, High initial investment and uncertain return on investment

  • Who are the major players in the AI In Industrial Machinery Market?

    • ABB Ltd., AVEVA Group Plc, Bentley Systems Inc., Robert Bosch GmbH, C3.ai Inc., Caterpillar Inc., Emerson Electric Co., FANUC Corp., General Electric Co., Hitachi Ltd., Honeywell International Inc., IBM Corp., KUKA AG, Microsoft Corp., Mitsubishi Electric Corp., NVIDIA Corp., Oracle Corp., Rockwell Automation Inc., SAP SE and Siemens AG

Market Research Insights

  • The dynamics of the AI in industrial machinery market are increasingly shaped by the pursuit of tangible business outcomes. The implementation of AI for worker safety has been shown to reduce workplace incidents by over 30% in high-risk environments.
  • Meanwhile, ROI for industrial AI is becoming clearer, with firms deploying predictive analytics for machinery reporting up to a 25% reduction in unplanned downtime. These gains are driving adoption, but successful AI and robotics integration hinges on robust data integration for AI models and a strategic approach to AI workforce upskilling.
  • The trend toward human-machine collaboration is central, empowering employees with tools that augment their skills rather than replace them. This creates a more resilient and efficient operational framework, justifying the investment in smart manufacturing AI solutions.

We can help! Our analysts can customize this ai in industrial machinery market research report to meet your requirements.

Get in touch

1. Executive Summary

1.1 Market overview

Executive Summary - Chart on Market Overview
Executive Summary - Data Table on Market Overview
Executive Summary - Chart on Global Market Characteristics
Executive Summary - Chart on Market by Geography
Executive Summary - Chart on Market Segmentation by Component
Executive Summary - Chart on Market Segmentation by Technology
Executive Summary - Chart on Market Segmentation by End-user
Executive Summary - Chart on Incremental Growth
Executive Summary - Data Table on Incremental Growth
Executive Summary - Chart on Company Market Positioning

2. Technavio Analysis

2.1 Analysis of price sensitivity, lifecycle, customer purchase basket, adoption rates, and purchase criteria

2.2 Criticality of inputs and Factors of differentiation

Chart on Overview on criticality of inputs and factors of differentiation

2.3 Factors of disruption

Chart on Overview on factors of disruption

2.4 Impact of drivers and challenges

Chart on Impact of drivers and challenges in 2024 and 2029

3. Market Landscape

3.1 Market ecosystem

Chart on Parent Market
Data Table on - Parent Market

3.2 Market characteristics

Chart on Market characteristics analysis

3.3 Value chain analysis

Chart on Value chain analysis

4. Market Sizing

4.1 Market definition

Data Table on Offerings of companies included in the market definition

4.2 Market segment analysis

Market segments

4.3 Market size 2024

4.4 Market outlook: Forecast for 2024-2029

Chart on Global - Market size and forecast 2024-2029 ($ million)
Data Table on Global - Market size and forecast 2024-2029 ($ million)
Chart on Global Market: Year-over-year growth 2024-2029 (%)
Data Table on Global Market: Year-over-year growth 2024-2029 (%)

5. Historic Market Size

5.1 Global AI In Industrial Machinery Market 2019 - 2023

Historic Market Size - Data Table on Global AI In Industrial Machinery Market 2019 - 2023 ($ million)

5.2 Component segment analysis 2019 - 2023

Historic Market Size - Component Segment 2019 - 2023 ($ million)

5.3 Technology segment analysis 2019 - 2023

Historic Market Size - Technology Segment 2019 - 2023 ($ million)

5.4 End-user segment analysis 2019 - 2023

Historic Market Size - End-user Segment 2019 - 2023 ($ million)

5.5 Geography segment analysis 2019 - 2023

Historic Market Size - Geography Segment 2019 - 2023 ($ million)

5.6 Country segment analysis 2019 - 2023

Historic Market Size - Country Segment 2019 - 2023 ($ million)

6. Five Forces Analysis

6.1 Five forces summary

Five forces analysis - Comparison between 2024 and 2029

6.2 Bargaining power of buyers

Bargaining power of buyers - Impact of key factors 2024 and 2029

6.3 Bargaining power of suppliers

Bargaining power of suppliers - Impact of key factors in 2024 and 2029

6.4 Threat of new entrants

Threat of new entrants - Impact of key factors in 2024 and 2029

6.5 Threat of substitutes

Threat of substitutes - Impact of key factors in 2024 and 2029

6.6 Threat of rivalry

Threat of rivalry - Impact of key factors in 2024 and 2029

6.7 Market condition

Chart on Market condition - Five forces 2024 and 2029

7. Market Segmentation by Component

7.1 Market segments

Chart on Component - Market share 2024-2029 (%)
Data Table on Component - Market share 2024-2029 (%)

7.2 Comparison by Component

Chart on Comparison by Component
Data Table on Comparison by Component

7.3 Hardware - Market size and forecast 2024-2029

Chart on Hardware - Market size and forecast 2024-2029 ($ million)
Data Table on Hardware - Market size and forecast 2024-2029 ($ million)
Chart on Hardware - Year-over-year growth 2024-2029 (%)
Data Table on Hardware - Year-over-year growth 2024-2029 (%)

7.4 Software - Market size and forecast 2024-2029

Chart on Software - Market size and forecast 2024-2029 ($ million)
Data Table on Software - Market size and forecast 2024-2029 ($ million)
Chart on Software - Year-over-year growth 2024-2029 (%)
Data Table on Software - Year-over-year growth 2024-2029 (%)

7.5 Services - Market size and forecast 2024-2029

Chart on Services - Market size and forecast 2024-2029 ($ million)
Data Table on Services - Market size and forecast 2024-2029 ($ million)
Chart on Services - Year-over-year growth 2024-2029 (%)
Data Table on Services - Year-over-year growth 2024-2029 (%)

7.6 Market opportunity by Component

Market opportunity by Component ($ million)
Data Table on Market opportunity by Component ($ million)

8. Market Segmentation by Technology

8.1 Market segments

Chart on Technology - Market share 2024-2029 (%)
Data Table on Technology - Market share 2024-2029 (%)

8.2 Comparison by Technology

Chart on Comparison by Technology
Data Table on Comparison by Technology

8.3 Machine learning - Market size and forecast 2024-2029

Chart on Machine learning - Market size and forecast 2024-2029 ($ million)
Data Table on Machine learning - Market size and forecast 2024-2029 ($ million)
Chart on Machine learning - Year-over-year growth 2024-2029 (%)
Data Table on Machine learning - Year-over-year growth 2024-2029 (%)

8.4 Computer vision - Market size and forecast 2024-2029

Chart on Computer vision - Market size and forecast 2024-2029 ($ million)
Data Table on Computer vision - Market size and forecast 2024-2029 ($ million)
Chart on Computer vision - Year-over-year growth 2024-2029 (%)
Data Table on Computer vision - Year-over-year growth 2024-2029 (%)

8.5 Context awareness - Market size and forecast 2024-2029

Chart on Context awareness - Market size and forecast 2024-2029 ($ million)
Data Table on Context awareness - Market size and forecast 2024-2029 ($ million)
Chart on Context awareness - Year-over-year growth 2024-2029 (%)
Data Table on Context awareness - Year-over-year growth 2024-2029 (%)

8.6 Natural language processing - Market size and forecast 2024-2029

Chart on Natural language processing - Market size and forecast 2024-2029 ($ million)
Data Table on Natural language processing - Market size and forecast 2024-2029 ($ million)
Chart on Natural language processing - Year-over-year growth 2024-2029 (%)
Data Table on Natural language processing - Year-over-year growth 2024-2029 (%)

8.7 Market opportunity by Technology

Market opportunity by Technology ($ million)
Data Table on Market opportunity by Technology ($ million)

9. Market Segmentation by End-user

9.1 Market segments

Chart on End-user - Market share 2024-2029 (%)
Data Table on End-user - Market share 2024-2029 (%)

9.2 Comparison by End-user

Chart on Comparison by End-user
Data Table on Comparison by End-user

9.3 Automotive - Market size and forecast 2024-2029

Chart on Automotive - Market size and forecast 2024-2029 ($ million)
Data Table on Automotive - Market size and forecast 2024-2029 ($ million)
Chart on Automotive - Year-over-year growth 2024-2029 (%)
Data Table on Automotive - Year-over-year growth 2024-2029 (%)

9.4 Semiconductor - Market size and forecast 2024-2029

Chart on Semiconductor - Market size and forecast 2024-2029 ($ million)
Data Table on Semiconductor - Market size and forecast 2024-2029 ($ million)
Chart on Semiconductor - Year-over-year growth 2024-2029 (%)
Data Table on Semiconductor - Year-over-year growth 2024-2029 (%)

9.5 Oil and gas - Market size and forecast 2024-2029

Chart on Oil and gas - Market size and forecast 2024-2029 ($ million)
Data Table on Oil and gas - Market size and forecast 2024-2029 ($ million)
Chart on Oil and gas - Year-over-year growth 2024-2029 (%)
Data Table on Oil and gas - Year-over-year growth 2024-2029 (%)

9.6 Food processing - Market size and forecast 2024-2029

Chart on Food processing - Market size and forecast 2024-2029 ($ million)
Data Table on Food processing - Market size and forecast 2024-2029 ($ million)
Chart on Food processing - Year-over-year growth 2024-2029 (%)
Data Table on Food processing - Year-over-year growth 2024-2029 (%)

9.7 Others - Market size and forecast 2024-2029

Chart on Others - Market size and forecast 2024-2029 ($ million)
Data Table on Others - Market size and forecast 2024-2029 ($ million)
Chart on Others - Year-over-year growth 2024-2029 (%)
Data Table on Others - Year-over-year growth 2024-2029 (%)

9.8 Market opportunity by End-user

Market opportunity by End-user ($ million)
Data Table on Market opportunity by End-user ($ million)

10. Customer Landscape

10.1 Customer landscape overview

Analysis of price sensitivity, lifecycle, customer purchase basket, adoption rates, and purchase criteria

11. Geographic Landscape

11.1 Geographic segmentation

Chart on Market share by geography 2024-2029 (%)
Data Table on Market share by geography 2024-2029 (%)

11.2 Geographic comparison

Chart on Geographic comparison
Data Table on Geographic comparison

11.3 North America - Market size and forecast 2024-2029

Chart on North America - Market size and forecast 2024-2029 ($ million)
Data Table on North America - Market size and forecast 2024-2029 ($ million)
Chart on North America - Year-over-year growth 2024-2029 (%)
Data Table on North America - Year-over-year growth 2024-2029 (%)
Chart on Regional Comparison - North America
Data Table on Regional Comparison - North America

11.3.1 US - Market size and forecast 2024-2029

Chart on US - Market size and forecast 2024-2029 ($ million)
Data Table on US - Market size and forecast 2024-2029 ($ million)
Chart on US - Year-over-year growth 2024-2029 (%)
Data Table on US - Year-over-year growth 2024-2029 (%)

11.3.2 Canada - Market size and forecast 2024-2029

Chart on Canada - Market size and forecast 2024-2029 ($ million)
Data Table on Canada - Market size and forecast 2024-2029 ($ million)
Chart on Canada - Year-over-year growth 2024-2029 (%)
Data Table on Canada - Year-over-year growth 2024-2029 (%)

11.3.3 Mexico - Market size and forecast 2024-2029

Chart on Mexico - Market size and forecast 2024-2029 ($ million)
Data Table on Mexico - Market size and forecast 2024-2029 ($ million)
Chart on Mexico - Year-over-year growth 2024-2029 (%)
Data Table on Mexico - Year-over-year growth 2024-2029 (%)

11.4 APAC - Market size and forecast 2024-2029

Chart on APAC - Market size and forecast 2024-2029 ($ million)
Data Table on APAC - Market size and forecast 2024-2029 ($ million)
Chart on APAC - Year-over-year growth 2024-2029 (%)
Data Table on APAC - Year-over-year growth 2024-2029 (%)
Chart on Regional Comparison - APAC
Data Table on Regional Comparison - APAC

11.4.1 China - Market size and forecast 2024-2029

Chart on China - Market size and forecast 2024-2029 ($ million)
Data Table on China - Market size and forecast 2024-2029 ($ million)
Chart on China - Year-over-year growth 2024-2029 (%)
Data Table on China - Year-over-year growth 2024-2029 (%)

11.4.2 Japan - Market size and forecast 2024-2029

Chart on Japan - Market size and forecast 2024-2029 ($ million)
Data Table on Japan - Market size and forecast 2024-2029 ($ million)
Chart on Japan - Year-over-year growth 2024-2029 (%)
Data Table on Japan - Year-over-year growth 2024-2029 (%)

11.4.3 India - Market size and forecast 2024-2029

Chart on India - Market size and forecast 2024-2029 ($ million)
Data Table on India - Market size and forecast 2024-2029 ($ million)
Chart on India - Year-over-year growth 2024-2029 (%)
Data Table on India - Year-over-year growth 2024-2029 (%)

11.4.4 South Korea - Market size and forecast 2024-2029

Chart on South Korea - Market size and forecast 2024-2029 ($ million)
Data Table on South Korea - Market size and forecast 2024-2029 ($ million)
Chart on South Korea - Year-over-year growth 2024-2029 (%)
Data Table on South Korea - Year-over-year growth 2024-2029 (%)

11.4.5 Australia - Market size and forecast 2024-2029

Chart on Australia - Market size and forecast 2024-2029 ($ million)
Data Table on Australia - Market size and forecast 2024-2029 ($ million)
Chart on Australia - Year-over-year growth 2024-2029 (%)
Data Table on Australia - Year-over-year growth 2024-2029 (%)

11.4.6 Indonesia - Market size and forecast 2024-2029

Chart on Indonesia - Market size and forecast 2024-2029 ($ million)
Data Table on Indonesia - Market size and forecast 2024-2029 ($ million)
Chart on Indonesia - Year-over-year growth 2024-2029 (%)
Data Table on Indonesia - Year-over-year growth 2024-2029 (%)

11.5 Europe - Market size and forecast 2024-2029

Chart on Europe - Market size and forecast 2024-2029 ($ million)
Data Table on Europe - Market size and forecast 2024-2029 ($ million)
Chart on Europe - Year-over-year growth 2024-2029 (%)
Data Table on Europe - Year-over-year growth 2024-2029 (%)
Chart on Regional Comparison - Europe
Data Table on Regional Comparison - Europe

11.5.1 Germany - Market size and forecast 2024-2029

Chart on Germany - Market size and forecast 2024-2029 ($ million)
Data Table on Germany - Market size and forecast 2024-2029 ($ million)
Chart on Germany - Year-over-year growth 2024-2029 (%)
Data Table on Germany - Year-over-year growth 2024-2029 (%)

11.5.2 UK - Market size and forecast 2024-2029

Chart on UK - Market size and forecast 2024-2029 ($ million)
Data Table on UK - Market size and forecast 2024-2029 ($ million)
Chart on UK - Year-over-year growth 2024-2029 (%)
Data Table on UK - Year-over-year growth 2024-2029 (%)

11.5.3 France - Market size and forecast 2024-2029

Chart on France - Market size and forecast 2024-2029 ($ million)
Data Table on France - Market size and forecast 2024-2029 ($ million)
Chart on France - Year-over-year growth 2024-2029 (%)
Data Table on France - Year-over-year growth 2024-2029 (%)

11.5.4 Italy - Market size and forecast 2024-2029

Chart on Italy - Market size and forecast 2024-2029 ($ million)
Data Table on Italy - Market size and forecast 2024-2029 ($ million)
Chart on Italy - Year-over-year growth 2024-2029 (%)
Data Table on Italy - Year-over-year growth 2024-2029 (%)

11.5.5 Spain - Market size and forecast 2024-2029

Chart on Spain - Market size and forecast 2024-2029 ($ million)
Data Table on Spain - Market size and forecast 2024-2029 ($ million)
Chart on Spain - Year-over-year growth 2024-2029 (%)
Data Table on Spain - Year-over-year growth 2024-2029 (%)

11.5.6 The Netherlands - Market size and forecast 2024-2029

Chart on The Netherlands - Market size and forecast 2024-2029 ($ million)
Data Table on The Netherlands - Market size and forecast 2024-2029 ($ million)
Chart on The Netherlands - Year-over-year growth 2024-2029 (%)
Data Table on The Netherlands - Year-over-year growth 2024-2029 (%)

11.6 Middle East and Africa - Market size and forecast 2024-2029

Chart on Middle East and Africa - Market size and forecast 2024-2029 ($ million)
Data Table on Middle East and Africa - Market size and forecast 2024-2029 ($ million)
Chart on Middle East and Africa - Year-over-year growth 2024-2029 (%)
Data Table on Middle East and Africa - Year-over-year growth 2024-2029 (%)
Chart on Regional Comparison - Middle East and Africa
Data Table on Regional Comparison - Middle East and Africa

11.6.1 Saudi Arabia - Market size and forecast 2024-2029

Chart on Saudi Arabia - Market size and forecast 2024-2029 ($ million)
Data Table on Saudi Arabia - Market size and forecast 2024-2029 ($ million)
Chart on Saudi Arabia - Year-over-year growth 2024-2029 (%)
Data Table on Saudi Arabia - Year-over-year growth 2024-2029 (%)

11.6.2 UAE - Market size and forecast 2024-2029

Chart on UAE - Market size and forecast 2024-2029 ($ million)
Data Table on UAE - Market size and forecast 2024-2029 ($ million)
Chart on UAE - Year-over-year growth 2024-2029 (%)
Data Table on UAE - Year-over-year growth 2024-2029 (%)

11.6.3 South Africa - Market size and forecast 2024-2029

Chart on South Africa - Market size and forecast 2024-2029 ($ million)
Data Table on South Africa - Market size and forecast 2024-2029 ($ million)
Chart on South Africa - Year-over-year growth 2024-2029 (%)
Data Table on South Africa - Year-over-year growth 2024-2029 (%)

11.6.4 Israel - Market size and forecast 2024-2029

Chart on Israel - Market size and forecast 2024-2029 ($ million)
Data Table on Israel - Market size and forecast 2024-2029 ($ million)
Chart on Israel - Year-over-year growth 2024-2029 (%)
Data Table on Israel - Year-over-year growth 2024-2029 (%)

11.6.5 Turkey - Market size and forecast 2024-2029

Chart on Turkey - Market size and forecast 2024-2029 ($ million)
Data Table on Turkey - Market size and forecast 2024-2029 ($ million)
Chart on Turkey - Year-over-year growth 2024-2029 (%)
Data Table on Turkey - Year-over-year growth 2024-2029 (%)

11.7 South America - Market size and forecast 2024-2029

Chart on South America - Market size and forecast 2024-2029 ($ million)
Data Table on South America - Market size and forecast 2024-2029 ($ million)
Chart on South America - Year-over-year growth 2024-2029 (%)
Data Table on South America - Year-over-year growth 2024-2029 (%)
Chart on Regional Comparison - South America
Data Table on Regional Comparison - South America

11.7.1 Brazil - Market size and forecast 2024-2029

Chart on Brazil - Market size and forecast 2024-2029 ($ million)
Data Table on Brazil - Market size and forecast 2024-2029 ($ million)
Chart on Brazil - Year-over-year growth 2024-2029 (%)
Data Table on Brazil - Year-over-year growth 2024-2029 (%)

11.7.2 Argentina - Market size and forecast 2024-2029

Chart on Argentina - Market size and forecast 2024-2029 ($ million)
Data Table on Argentina - Market size and forecast 2024-2029 ($ million)
Chart on Argentina - Year-over-year growth 2024-2029 (%)
Data Table on Argentina - Year-over-year growth 2024-2029 (%)

11.7.3 Colombia - Market size and forecast 2024-2029

Chart on Colombia - Market size and forecast 2024-2029 ($ million)
Data Table on Colombia - Market size and forecast 2024-2029 ($ million)
Chart on Colombia - Year-over-year growth 2024-2029 (%)
Data Table on Colombia - Year-over-year growth 2024-2029 (%)

11.8 Market opportunity by geography

Market opportunity by geography ($ million)
Data Tables on Market opportunity by geography ($ million)

12. Drivers, Challenges, and Opportunity

12.1 Market drivers

Imperative for enhanced operational efficiency and predictive maintenance
Proliferation of industrial internet of things and big data analytics
Addressing skilled labor shortage and enhancing worker safety

12.2 Market challenges

High initial investment and uncertain return on investment
Data integration complexity and cybersecurity vulnerabilities
Scarcity of skilled talent and need for workforce upskilling

12.3 Impact of drivers and challenges

Impact of drivers and challenges in 2024 and 2029

12.4 Market opportunities

Emergence of generative AI and industrial copilots
Proliferation of edge AI and on-device processing
Integration of AI with digital twins for advanced simulation

13. Competitive Landscape

13.1 Overview

13.2

Overview on criticality of inputs and factors of differentiation

13.3 Landscape disruption

Overview on factors of disruption

13.4 Industry risks

Impact of key risks on business

14. Competitive Analysis

14.1 Companies profiled

Companies covered

14.2 Company ranking index

14.3 Market positioning of companies

Matrix on companies position and classification

14.4 ABB Ltd.

ABB Ltd. - Overview
ABB Ltd. - Business segments
ABB Ltd. - Key news
ABB Ltd. - Key offerings
ABB Ltd. - Segment focus
SWOT

14.5 AVEVA Group Plc

AVEVA Group Plc - Overview
AVEVA Group Plc - Business segments
AVEVA Group Plc - Key offerings
AVEVA Group Plc - Segment focus
SWOT

14.6 Bentley Systems Inc.

Bentley Systems Inc. - Overview
Bentley Systems Inc. - Business segments
Bentley Systems Inc. - Key news
Bentley Systems Inc. - Key offerings
Bentley Systems Inc. - Segment focus
SWOT

14.7 C3.ai Inc.

C3.ai Inc. - Overview
C3.ai Inc. - Product / Service
C3.ai Inc. - Key news
C3.ai Inc. - Key offerings
SWOT

14.8 Emerson Electric Co.

Emerson Electric Co. - Overview
Emerson Electric Co. - Business segments
Emerson Electric Co. - Key news
Emerson Electric Co. - Key offerings
Emerson Electric Co. - Segment focus
SWOT

14.9 General Electric Co.

General Electric Co. - Overview
General Electric Co. - Business segments
General Electric Co. - Key news
General Electric Co. - Key offerings
General Electric Co. - Segment focus
SWOT

14.10 Honeywell International Inc.

Honeywell International Inc. - Overview
Honeywell International Inc. - Business segments
Honeywell International Inc. - Key news
Honeywell International Inc. - Key offerings
Honeywell International Inc. - Segment focus
SWOT

14.11 IBM Corp.

IBM Corp. - Overview
IBM Corp. - Business segments
IBM Corp. - Key news
IBM Corp. - Key offerings
IBM Corp. - Segment focus
SWOT

14.12 Microsoft Corp.

Microsoft Corp. - Overview
Microsoft Corp. - Business segments
Microsoft Corp. - Key news
Microsoft Corp. - Key offerings
Microsoft Corp. - Segment focus
SWOT

14.13 Mitsubishi Electric Corp.

Mitsubishi Electric Corp. - Overview
Mitsubishi Electric Corp. - Business segments
Mitsubishi Electric Corp. - Key offerings
Mitsubishi Electric Corp. - Segment focus
SWOT

14.14 NVIDIA Corp.

NVIDIA Corp. - Overview
NVIDIA Corp. - Business segments
NVIDIA Corp. - Key news
NVIDIA Corp. - Key offerings
NVIDIA Corp. - Segment focus
SWOT

14.15 Oracle Corp.

Oracle Corp. - Overview
Oracle Corp. - Business segments
Oracle Corp. - Key news
Oracle Corp. - Key offerings
Oracle Corp. - Segment focus
SWOT

14.16 Rockwell Automation Inc.

Rockwell Automation Inc. - Overview
Rockwell Automation Inc. - Business segments
Rockwell Automation Inc. - Key news
Rockwell Automation Inc. - Key offerings
Rockwell Automation Inc. - Segment focus
SWOT

14.17 SAP SE

SAP SE - Overview
SAP SE - Business segments
SAP SE - Key news
SAP SE - Key offerings
SAP SE - Segment focus
SWOT

14.18 Siemens AG

Siemens AG - Overview
Siemens AG - Business segments
Siemens AG - Key news
Siemens AG - Key offerings
Siemens AG - Segment focus
SWOT

15. Appendix

15.1 Scope of the report

Market definition
Objectives
Notes and caveats

15.2 Inclusions and exclusions checklist

Inclusions checklist
Exclusions checklist

15.3 Currency conversion rates for US$

15.4 Research methodology

15.5 Data procurement

Information sources

15.6 Data validation

15.7 Validation techniques employed for market sizing

15.8 Data synthesis

15.9 360 degree market analysis

15.10 List of abbreviations

Research Methodology

Technavio presents a detailed picture of the market by way of study, synthesis, and summation of data from multiple sources. The analysts have presented the various facets of the market with a particular focus on identifying the key industry influencers. The data thus presented is comprehensive, reliable, and the result of extensive research, both primary and secondary.

INFORMATION SOURCES

Primary sources

  • Manufacturers and suppliers
  • Channel partners
  • Industry experts
  • Strategic decision makers

Secondary sources

  • Industry journals and periodicals
  • Government data
  • Financial reports of key industry players
  • Historical data
  • Press releases

DATA ANALYSIS

Data Synthesis

  • Collation of data
  • Estimation of key figures
  • Analysis of derived insights

Data Validation

  • Triangulation with data models
  • Reference against proprietary databases
  • Corroboration with industry experts

REPORT WRITING

Qualitative

  • Market drivers
  • Market challenges
  • Market trends
  • Five forces analysis

Quantitative

  • Market size and forecast
  • Market segmentation
  • Geographical insights
  • Competitive landscape

Interested in this report?

Get your sample now to see our research methodology and insights!

Download Now

Frequently Asked Questions

AI In Industrial Machinery market growth will increase by USD 19395.2 million during 2025-2029.

The AI In Industrial Machinery market is expected to grow at a CAGR of 32.9% during 2025-2029.

AI In Industrial Machinery market is segmented by Component (Hardware, Software, Services) Technology (Machine learning, Computer vision, Context awareness, Natural language processing) End-user (Automotive, Semiconductor, Oil and gas, Food processing, Others)

ABB Ltd., AVEVA Group Plc, Bentley Systems Inc., Robert Bosch GmbH, C3.ai Inc., Caterpillar Inc., Emerson Electric Co., FANUC Corp., General Electric Co., Hitachi Ltd., Honeywell International Inc., IBM Corp., KUKA AG, Microsoft Corp., Mitsubishi Electric Corp., NVIDIA Corp., Oracle Corp., Rockwell Automation Inc., SAP SE, Siemens AG are a few of the key vendors in the AI In Industrial Machinery market.

North America will register the highest growth rate of 33.1% among the other regions. Therefore, the AI In Industrial Machinery market in North America is expected to garner significant business opportunities for the vendors during the forecast period.

US, Canada, Mexico, China, Japan, India, South Korea, Australia, Indonesia, Germany, UK, France, Italy, Spain, The Netherlands, Saudi Arabia, UAE, South Africa, Israel, Turkey, Brazil, Argentina, Colombia

  • Imperative for enhanced operational efficiency and predictive maintenance is the driving factor this market.

The AI In Industrial Machinery market vendors should focus on grabbing business opportunities from the Component segment as it accounted for the largest market share in the base year.