
AI In Insurance Claims Processing Market Size 2025-2029
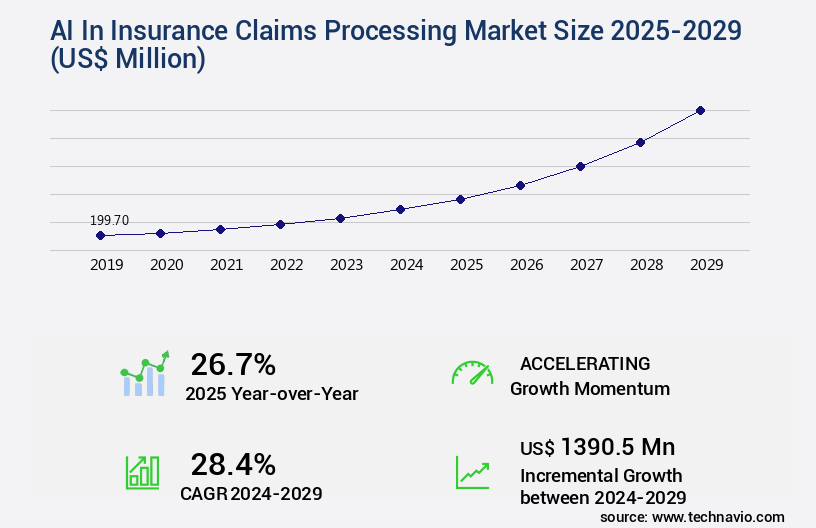
The AI in insurance claims processing market size is valued to increase by USD 1.39 billion, at a CAGR of 28.4% from 2024 to 2029. Escalating demand for automation to enhance operational efficiency and reduce costs will drive the AI in insurance claims processing market.
Major Market Trends & Insights
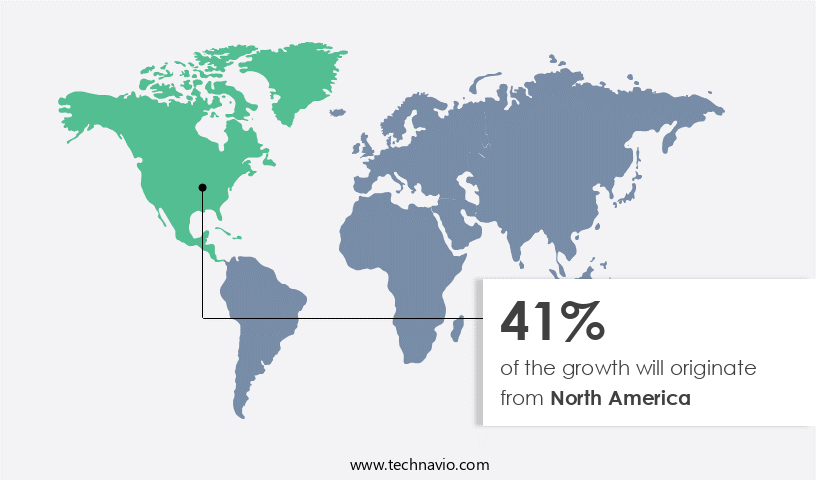
- North America dominated the market and accounted for a 41% growth during the forecast period.
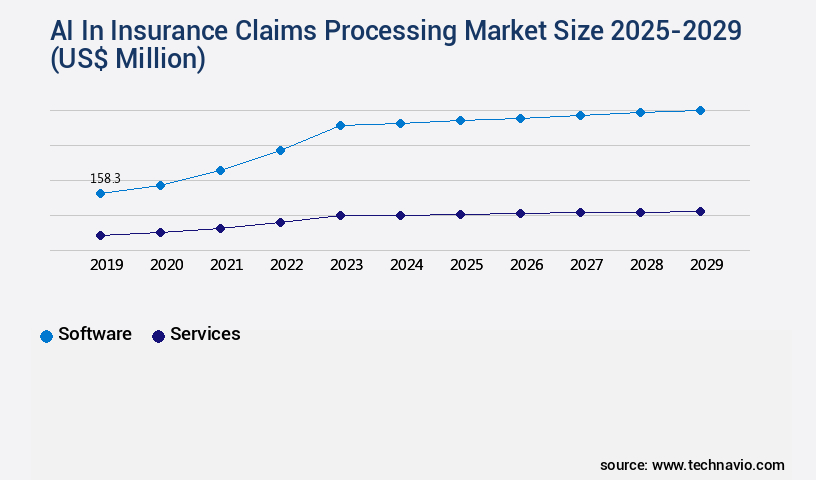
- By Component - Software segment was valued at USD 158.30 billion in 2023
- By Deployment - Cloud segment accounted for the largest market revenue share in 2023
Market Size & Forecast
- Market Opportunities: USD 876.01 million
- Market Future Opportunities: USD 1390.50 million
- CAGR from 2024 to 2029 : 28.4%
Market Summary
- In the insurance industry, the adoption of Artificial Intelligence (AI) in claims processing has emerged as a significant trend, driven by the escalating demand for automation to enhance operational efficiency and reduce costs. AI technologies, including machine learning and natural language processing, are increasingly being utilized to analyze claims data, identify patterns, and make informed decisions. One notable development is the proliferation of generative AI, which goes beyond automating routine tasks to provide enhanced decision-making capabilities and improved customer experience. For instance, AI can be employed to analyze policy documents, medical records, and other claim-related data to determine the validity and amount of claims, reducing the need for manual intervention.
- However, the implementation of AI in insurance claims processing is not without challenges. Stringent data privacy, security, and evolving regulatory compliance requirements necessitate robust data management systems and advanced encryption techniques. Moreover, ensuring the ethical use of AI and mitigating potential biases in decision-making processes are crucial considerations. This growth is attributed to the increasing adoption of AI technologies in underwriting, claims processing, fraud detection, and customer engagement.
- In conclusion, the integration of AI in insurance claims processing is revolutionizing the industry by streamlining processes, enhancing decision-making capabilities, and improving customer experience. Despite the challenges, the market's potential for growth is immense, with continued investment and innovation expected to drive its evolution.
What will be the Size of the AI In Insurance Claims Processing Market during the forecast period?
Get Key Insights on Market Forecast (PDF) Request Free Sample
How is the AI In Insurance Claims Processing Market Segmented ?
The AI in insurance claims processing industry research report provides comprehensive data (region-wise segment analysis), with forecasts and estimates in "USD million" for the period 2025-2029, as well as historical data from 2019-2023 for the following segments.
- Component
- Software
- Services
- Deployment
- Cloud
- On premises
- Technology
- Machine learning
- Natural language processing
- Computer vision
- Others
- Geography
- North America
- US
- Canada
- Europe
- France
- Germany
- Italy
- UK
- APAC
- China
- India
- Japan
- South America
- Brazil
- Rest of World (ROW)
- North America
By Component Insights
The software segment is estimated to witness significant growth during the forecast period.
The market continues to evolve, with the software segment leading the charge. This segment encompasses a variety of applications, platforms, and modules, each designed to streamline specific tasks throughout the claims lifecycle. Leveraging advanced technologies like machine learning and deep learning, these solutions automate claims processing workflow, reduce claims handling time, and enhance claims accuracy. For instance, computer vision software, a key component, employs image recognition capabilities to analyze damaged assets, such as vehicles and buildings, and swiftly assesses the severity and cost of repairs. This technology has significantly reduced claims denial rates for property and casualty insurers.
According to a recent study, insurers using computer vision software experienced a 20% decrease in claims denial rates. Furthermore, these solutions ensure regulatory compliance, data privacy, and security, while providing claims adjuster support and real-time claims tracking. Predictive modeling and fraud detection algorithms further bolster their capabilities, ensuring claims cost reduction and automated claims adjudication.
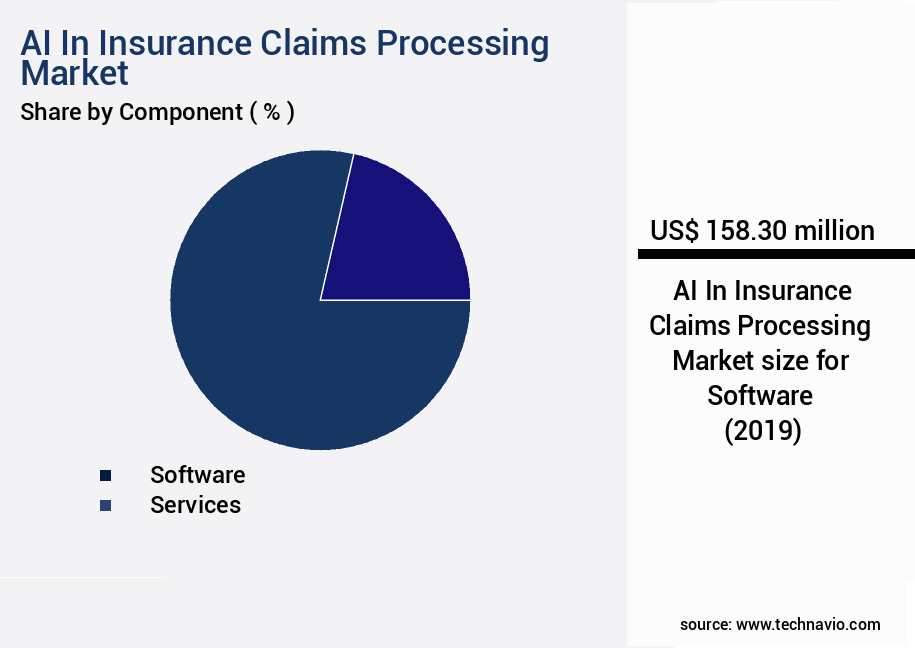
The Software segment was valued at USD 158.30 billion in 2019 and showed a gradual increase during the forecast period.
Regional Analysis
North America is estimated to contribute 41% to the growth of the global market during the forecast period.Technavio's analysts have elaborately explained the regional trends and drivers that shape the market during the forecast period.
See How AI In Insurance Claims Processing Market Demand is Rising in North America Request Free Sample
The market is witnessing significant growth and transformation, with North America leading the charge as the most mature and prominent region. Fueled by high technological adoption rates, a robust insurance industry, and the presence of both established carriers and innovative insurtech companies, the United States and Canada are driving the demand for AI solutions. The primary motivation behind this adoption is the need to manage escalating claims costs, particularly in the property and casualty and health sectors, while delivering a rapid, transparent, and digitally native service experience that meets modern consumer expectations.
Market Dynamics
Our researchers analyzed the data with 2024 as the base year, along with the key drivers, trends, and challenges. A holistic analysis of drivers will help companies refine their marketing strategies to gain a competitive advantage.
The market is experiencing significant growth as insurers seek to optimize their workflow and improve efficiency in claims handling. AI-driven claims processing workflow optimization is achieved through implementing natural language processing for claims, enabling faster and more accurate claims handling. Machine learning algorithms are used to improve claims handling efficiency by automating claims assessment using image recognition technology. Predictive modeling for claims severity and reserve estimation allows insurers to make data-driven decisions and reduce uncertainty. Fraud detection is another area where AI is making a significant impact, with insurers leveraging AI to enhance claims data validation using algorithms. AI-powered claims lifecycle management system integration streamlines the entire claims process, from intake to resolution. Strategies for mitigating bias in AI-based claims processing are essential to ensure fairness and transparency.
Data security and privacy are critical concerns in AI-driven claims systems, with insurers implementing robust security measures to protect sensitive information. Automated claims adjudication using machine learning models and real-time claims tracking and reporting dashboards improve customer experience and regulatory compliance. Optical character recognition for policy document extraction and AI-driven claims cost reduction and efficiency gains are other key benefits of AI in insurance claims processing. Claims adjuster support tools based on AI technologies and automated claims appeal management systems further enhance the claims handling process. AI-powered claims investigation tools and techniques ensure that claims are thoroughly investigated and resolved in a timely and accurate manner. Overall, AI is transforming the insurance claims processing industry by reducing costs, improving efficiency, and enhancing customer experience.
What are the key market drivers leading to the rise in the adoption of AI In Insurance Claims Processing Industry?
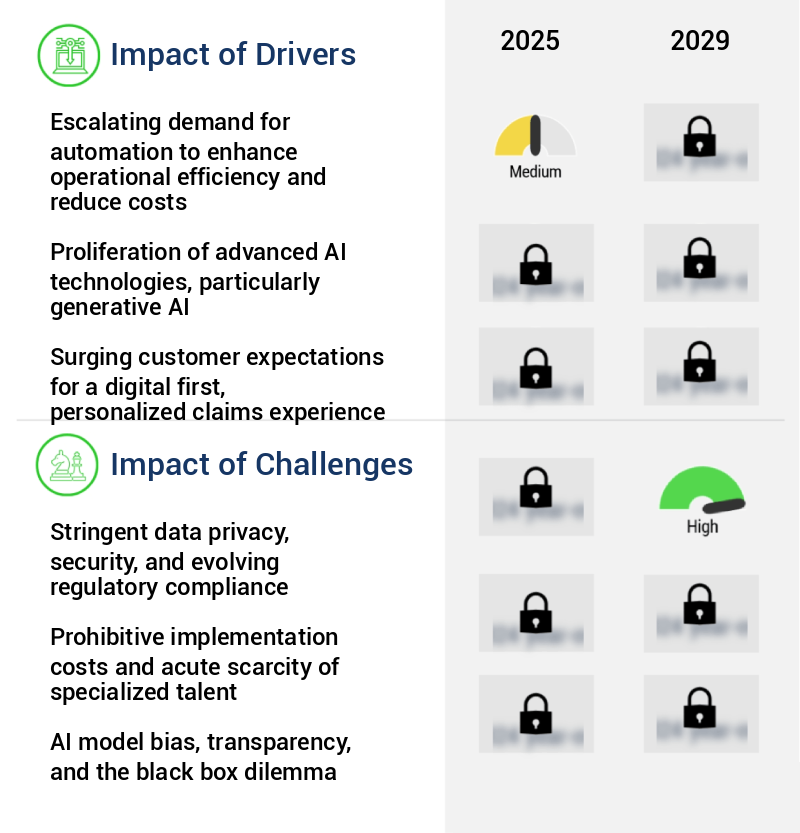
- The escalating demand for automation, driven by the need to enhance operational efficiency and reduce costs, is a primary market trend.
- The global insurance industry is witnessing a significant shift towards the adoption of Artificial Intelligence (AI) in claims processing. This transformation is driven by the pressing need for insurers to streamline operations, reduce administrative costs, and mitigate human error. Traditional claims processing involves numerous manual touchpoints from the First Notice of Loss (FNOL) to final settlement, making the process labor-intensive, time-consuming, and costly. AI offers a transformative solution by automating repetitive, rules-based tasks, enabling human adjusters to focus on complex, high-value activities that require empathy and nuanced judgment. According to recent studies, AI in insurance claims processing is projected to save the industry up to 20-30% in operational costs.
- Furthermore, AI's ability to analyze vast amounts of data in real-time and provide actionable insights can lead to faster claim processing and improved customer satisfaction. By automating mundane tasks, insurers can allocate resources more efficiently and effectively, ultimately leading to increased productivity and profitability.
What are the market trends shaping the AI In Insurance Claims Processing Industry?
- The proliferation of generative AI is becoming a significant market trend, enhancing decision-making processes and enhancing customer experiences.
- A paradigm shift is underway in The market, marked by the emergence of generative artificial intelligence (AI). This advanced technology goes beyond the predictive capabilities of earlier machine learning models, introducing a new level of cognitive ability to the claims workflow. Generative AI is not just automating repetitive tasks; it's augmenting claims handlers' decision-making capabilities and revolutionizing customer interactions. The core value proposition of generative AI lies in its ability to understand, summarize, and generate human-like text from extensive datasets of structured and unstructured information. This capability unlocks a range of applications that were previously the exclusive domain of human expertise.
- For instance, AI-driven claims processing can analyze policy documents, medical records, and other complex data to determine claim validity and expedite settlements. Moreover, it can generate personalized communication with policyholders, enhancing customer satisfaction. The application of generative AI in insurance claims processing is poised for significant growth. According to recent estimates, the market is expected to expand at a remarkable pace, with the number of AI applications in insurance claims processing projected to double in the next five years. This surge in adoption is driven by the increasing demand for faster, more efficient, and more accurate claims processing, as well as the growing availability of advanced AI technologies.
What challenges does the AI In Insurance Claims Processing Industry face during its growth?
- Strict data privacy regulations, evolving security requirements, and increasing compliance standards pose significant challenges to industry growth. Adhering to these mandates necessitates substantial resources and expertise, potentially hindering innovation and expansion.
- The integration of Artificial Intelligence (AI) in insurance claims processing is a significant trend shaping the industry, offering potential for increased efficiency and accuracy. AI systems can analyze vast amounts of data, including personally identifiable information (PII) and protected health information (PHI), to expedite claims processing and enhance underwriting. However, the adoption of AI comes with challenges, particularly in the realm of data privacy, security, and regulatory compliance. The claims process is data-intensive, necessitating the collection and analysis of sensitive information. The deployment of AI systems, which rely on large datasets, introduces substantial risks of data breaches, misuse, and unauthorized access.
- Regulatory bodies in major markets, such as North America and Europe, are intensifying their focus on how organizations manage personal data and implement algorithmic systems. According to recent estimates, the global AI in insurance market is projected to reach a value of USD1.3 billion by 2027, representing a substantial growth in the sector. Despite these opportunities, insurers must navigate the complex regulatory landscape and address data privacy concerns to fully realize the benefits of AI in insurance claims processing.
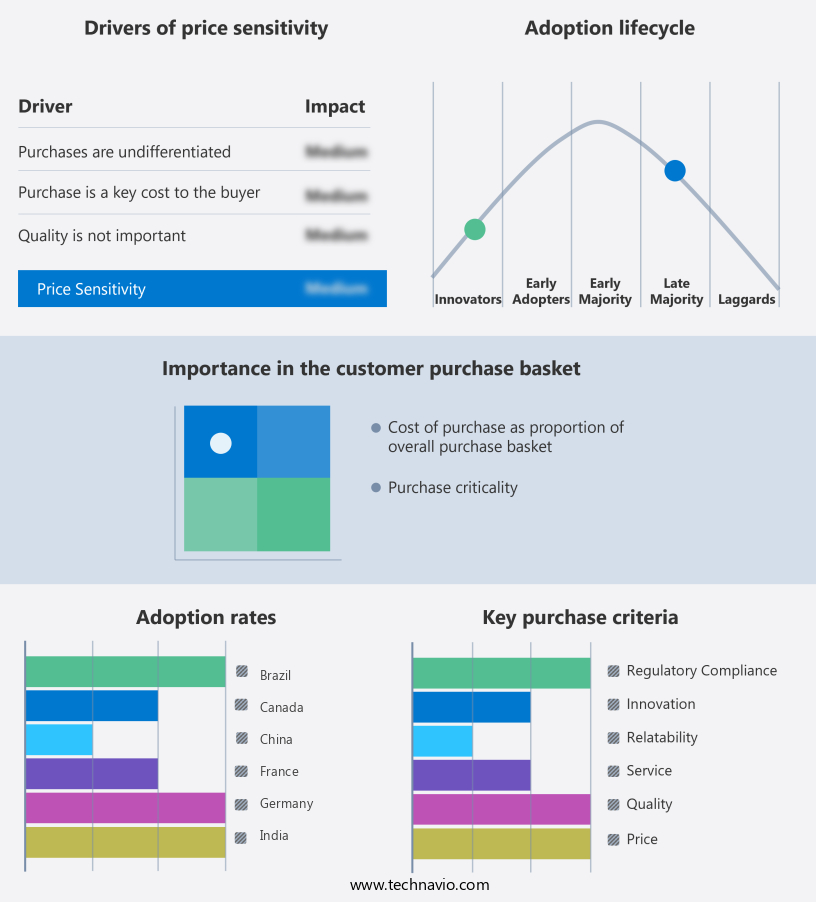
Exclusive Technavio Analysis on Customer Landscape
The ai in insurance claims processing market forecasting report includes the adoption lifecycle of the market, covering from the innovator's stage to the laggard's stage. It focuses on adoption rates in different regions based on penetration. Furthermore, the ai in insurance claims processing market report also includes key purchase criteria and drivers of price sensitivity to help companies evaluate and develop their market growth analysis strategies.
Customer Landscape of AI In Insurance Claims Processing Industry
Competitive Landscape
Companies are implementing various strategies, such as strategic alliances, ai in insurance claims processing market forecast, partnerships, mergers and acquisitions, geographical expansion, and product/service launches, to enhance their presence in the industry.
Amazon Web Services Inc. - This company specializes in cloud infrastructure and artificial intelligence (AI) services, enabling businesses to develop, train, and implement custom AI solutions for claims processing applications using offerings such as Amazon Bedrock and SageMaker.
The industry research and growth report includes detailed analyses of the competitive landscape of the market and information about key companies, including:
- Amazon Web Services Inc.
- Bdeo Technologies S.L.
- Duck Creek Technologies LLC
- FRISS
- Google Cloud
- Guidewire Software Inc.
- International Business Machines Corp.
- LexisNexis Legal and Professional
- Microsoft Corp.
- Open Text Corp.
- Pegasystems Inc.
- Ravin AI Ltd.
- SAS Institute Inc.
- Shift Technology
- Solera Holdings LLC
- Tractable Ltd.
- UiPath Inc.
- Verisk Analytics Inc.
Qualitative and quantitative analysis of companies has been conducted to help clients understand the wider business environment as well as the strengths and weaknesses of key industry players. Data is qualitatively analyzed to categorize companies as pure play, category-focused, industry-focused, and diversified; it is quantitatively analyzed to categorize companies as dominant, leading, strong, tentative, and weak.
Recent Development and News in AI In Insurance Claims Processing Market
- In January 2024, Allstate Insurance Company, a leading US insurer, announced the deployment of an AI-powered claims processing platform from Guidewire Software. This solution, named Claims IQ, uses machine learning algorithms to analyze claims data and streamline the underwriting process, reducing the average time taken to process a claim by 25% (Allstate press release).
- In March 2024, IBM and Lemonade, a digital insurance company, announced a strategic partnership to integrate IBM's Watson AI technology into Lemonade's claims processing system. This collaboration aimed to enhance the accuracy and speed of claims processing, with Watson's AI analyzing historical claims data to identify patterns and improve risk assessment (IBM press release).
- In May 2024, Desjardins General Insurance, a Canadian insurer, revealed a USD10 million investment in Desjardins AI, its AI-driven subsidiary focused on claims processing. This investment would support the development and implementation of advanced AI solutions, enabling the company to process claims more efficiently and effectively (Desjardins press release).
- In January 2025, the European Insurance and Occupational Pensions Authority (EIOPA) published a report on the use of AI in the European insurance sector, emphasizing the need for regulatory guidance and ethical considerations. The report highlighted the potential benefits of AI in claims processing, including increased efficiency and improved customer experience, but also raised concerns about data privacy and transparency (EIOPA report).
Dive into Technavio's robust research methodology, blending expert interviews, extensive data synthesis, and validated models for unparalleled AI In Insurance Claims Processing Market insights. See full methodology.
|
Market Scope |
|
|
Report Coverage |
Details |
|
Page number |
228 |
|
Base year |
2024 |
|
Historic period |
2019-2023 |
|
Forecast period |
2025-2029 |
|
Growth momentum & CAGR |
Accelerate at a CAGR of 28.4% |
|
Market growth 2025-2029 |
USD 1390.5 million |
|
Market structure |
Fragmented |
|
YoY growth 2024-2025(%) |
26.7 |
|
Key countries |
US, China, Germany, UK, Canada, India, France, Japan, Italy, and Brazil |
|
Competitive landscape |
Leading Companies, Market Positioning of Companies, Competitive Strategies, and Industry Risks |
Research Analyst Overview
- The insurance claims processing market continues to evolve, with artificial intelligence (AI) playing an increasingly significant role in streamlining processes and enhancing efficiency. AI applications span the entire claims lifecycle, from policy document extraction and claims processing workflow to claims data integration and claims accuracy improvement. Machine learning algorithms are utilized for claims denial rate reduction and real-time claims tracking, while deep learning models aid in fraud detection and claims reserve estimation. One notable example of AI's impact is a leading insurer that implemented an AI-powered fraud detection system, resulting in a 30% decrease in fraudulent claims. The industry anticipates a 25% compound annual growth rate (CAGR) in AI adoption for claims processing.
- Document verification methods have evolved, with AI explainability claims ensuring transparency and regulatory compliance. Claims adjuster support is augmented through AI-driven claims investigation tools, predictive modeling, and automated claims adjudication. Claims handling efficiency is further boosted by underwriting risk assessment and claims audit trails. Data privacy regulations necessitate the implementation of robust data security claims and bias mitigation claims, ensuring fairness and transparency. AI-powered fraud detection and image recognition claims are essential components of claims resolution strategies, enhancing customer experience. Predictive modeling claims and claims severity prediction enable insurers to make informed decisions and optimize claims settlement time.
- Claims cost reduction is a significant benefit, as AI automation software reduces manual labor and processing errors. In conclusion, the insurance claims processing market is undergoing continuous transformation, with AI playing a pivotal role in enhancing efficiency, reducing costs, and improving customer experience. The integration of various AI applications, from document processing to fraud detection, is reshaping the industry landscape.
What are the Key Data Covered in this AI In Insurance Claims Processing Market Research and Growth Report?
-
What is the expected growth of the AI In Insurance Claims Processing Market between 2025 and 2029?
-
USD 1.39 billion, at a CAGR of 28.4%
-
-
What segmentation does the market report cover?
-
The report is segmented by Component (Software and Services), Deployment (Cloud and On premises), Technology (Machine learning, Natural language processing, Computer vision, and Others), and Geography (North America, Europe, APAC, South America, and Middle East and Africa)
-
-
Which regions are analyzed in the report?
-
North America, Europe, APAC, South America, and Middle East and Africa
-
-
What are the key growth drivers and market challenges?
-
Escalating demand for automation to enhance operational efficiency and reduce costs, Stringent data privacy, security, and evolving regulatory compliance
-
-
Who are the major players in the AI In Insurance Claims Processing Market?
-
Amazon Web Services Inc., Bdeo Technologies S.L., Duck Creek Technologies LLC, FRISS, Google Cloud, Guidewire Software Inc., International Business Machines Corp., LexisNexis Legal and Professional, Microsoft Corp., Open Text Corp., Pegasystems Inc., Ravin AI Ltd., SAS Institute Inc., Shift Technology, Solera Holdings LLC, Tractable Ltd., UiPath Inc., and Verisk Analytics Inc.
-
Market Research Insights
- The market for AI in insurance claims processing continues to advance, with innovations in areas such as claims intake automation, claims reporting dashboards, policy information extraction, and claims validation rules. One example of the market's impact is a leading insurer achieving a 30% reduction in claims resolution time through the integration of AI systems. Furthermore, industry experts anticipate a growth rate of over 20% in the next five years for AI applications in insurance claims processing. These advancements contribute to increased operational efficiency, improved communication channels, and enhanced fraud prevention measures.
- Data preprocessing techniques, claims audit management, and underwriting decision support are among the various areas benefiting from AI integration. Additionally, AI technologies facilitate claims triage systems, claims handling procedures, and claims documentation management, ultimately leading to better data governance and case management.
We can help! Our analysts can customize this AI in insurance claims processing market research report to meet your requirements.
 RIA -
RIA - 
