Digital Insurance Market Analysis North America, Europe, APAC, South America, Middle East and Africa - US, China, Germany, UK, Canada, India, France, Brazil, Japan, Mexico - Size and Forecast 2024-2028

Digital Insurance Market Analysis North America, Europe, APAC, South America, Middle East and Africa - US, China, Germany, UK, Canada, India, France, Brazil, Japan, Mexico - Size and Forecast 2024-2028

Published: Sep 2024 204 Pages SKU: IRTNTR80188

Market Overview at a Glance

$67.23 B
Market Opportunity
12.8%
CAGR
12.4
YoY growth 2023-2024(%)

Digital Insurance Market Size 2024-2028

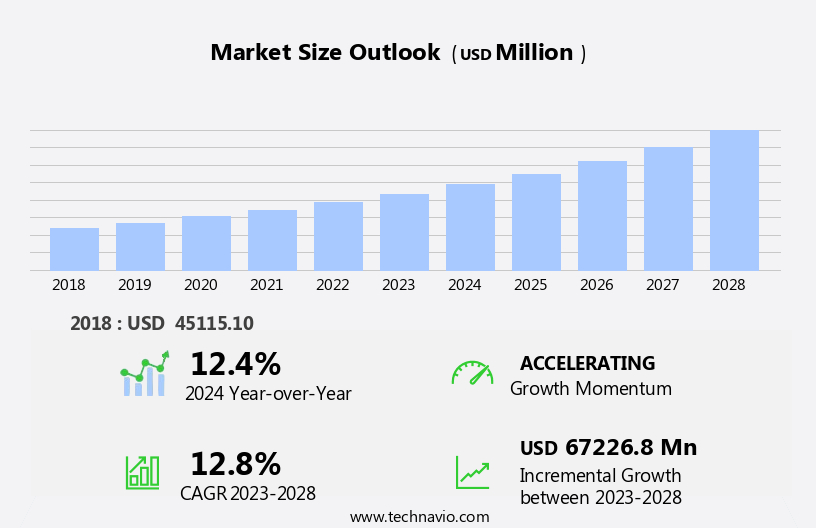
The digital insurance market size is forecast to increase by USD 67.23 billion, at a CAGR of 12.8% between 2023 and 2028.

  • The market is experiencing significant growth, driven by the increasing number of insurance policies being sold digitally. This trend is fueled by the emergence and advancement of Low Code/No Code (LCNC) development in the digital insurance sector. LCNC technologies enable insurers to create and customize digital insurance products quickly and efficiently, meeting the evolving needs of consumers. However, this market also faces challenges, primarily regulatory compliance. As digital insurance offerings expand, insurers must navigate complex regulatory landscapes to ensure they are meeting all necessary requirements.
  • Compliance with data privacy and security regulations, for instance, is crucial in the digital insurance sector. Companies that effectively address these challenges and leverage LCNC technologies to streamline their digital offerings will be well-positioned to capitalize on the market's growth potential.

What will be the Size of the Digital Insurance Market during the forecast period?

Digital Insurance Market Size

Explore in-depth regional segment analysis with market size data - historical 2018-2022 and forecasts 2024-2028 - in the full report.  
Request Free Sample

The market continues to evolve, with dynamic market activities unfolding across various sectors. Regulatory reporting, mobile apps, and customer churn are integral components shaping this industry's landscape. KYC/AML compliance, Payment Gateways, and Big Data are essential tools for insurers, enabling efficient policy administration and fraud detection. Cloud computing and data analytics facilitate real-time risk assessment and actuarial modeling, while IoT sensors and claims frequency data inform machine learning algorithms. Insurance broking, PPC marketing, and API integrations streamline the policy lifecycle management process. Catastrophe modeling and predictive modeling help insurers assess risk and manage claims processing more effectively.

Compliance regulations, such as GDPR, digital identity verification, and data privacy, ensure secure customer interactions. Insurtech solutions, including AI-powered chatbots, on-demand insurance, and policy renewals, enhance the customer experience. Usage-based insurance, embedded insurance, and investment strategies leverage data to offer personalized insurance products. Risk transfer, claims severity, and combined ratio are essential metrics for insurers, with solvency ratio and claims management systems ensuring financial stability. Wearable technology and open banking further expand the potential for innovation in the market.

How is this Digital Insurance Industry segmented?

The digital insurance industry research report provides comprehensive data (region-wise segment analysis), with forecasts and estimates in "USD million" for the period 2024-2028, as well as historical data from 2018-2022 for the following segments.

  • Distribution Channel
    • Direct sales
    • Brokers/agents
    • Affiliated partners
  • End-user
    • Individuals
    • Businesses
  • Geography
    • North America
      • US
    • Europe
      • Germany
      • UK
    • APAC
      • China
    • Rest of World (ROW)

By Distribution Channel Insights

The direct sales segment is estimated to witness significant growth during the forecast period.

The market is experiencing a significant shift towards direct-to-consumer (DTC) models, eliminating the need for intermediaries such as brokers and agents. This model enables insurers to sell policies directly to consumers through digital platforms, fostering seamless interactions. The DTC approach offers numerous advantages, including cost efficiency. By removing intermediaries, insurers save on commission fees. Additionally, biometric authentication enhances security, while customer segmentation and predictive modeling provide personalized insurance solutions. Blockchain technology streamlines reinsurance treaties and policy administration systems, improving transparency and efficiency. Fraud detection and claims processing are optimized through ai-powered chatbots and claims management systems. On-demand insurance and usage-based models cater to evolving consumer needs.

Insurtech solutions, including api integrations, data analytics, and open banking, facilitate innovation and competition. Regulatory reporting, gdpr compliance, and kyc/aml compliance ensure data privacy and security. The market's evolution is further driven by digital identity verification, wearable technology, and investment strategies. Overall, the DTC model transforms the insurance industry, offering a more efficient, cost-effective, and personalized experience for consumers.

Digital Insurance Market Size

Request Free Sample

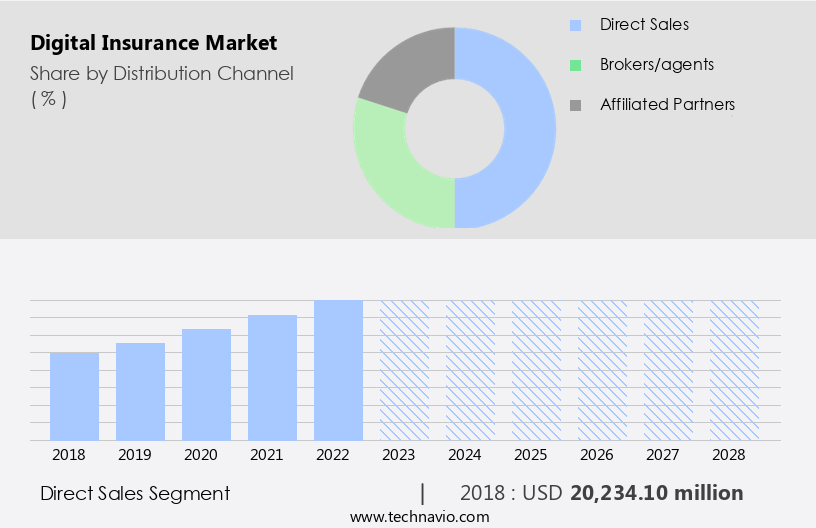
The Direct sales segment was valued at USD 20.23 billion in 2018 and showed a gradual increase during the forecast period.

Regional Analysis

North America is estimated to contribute 34% to the growth of the global market during the forecast period.Technavio's analysts have elaborately explained the regional trends and drivers that shape the market during the forecast period.

Digital Insurance Market Share by Geography

 Request Free Sample

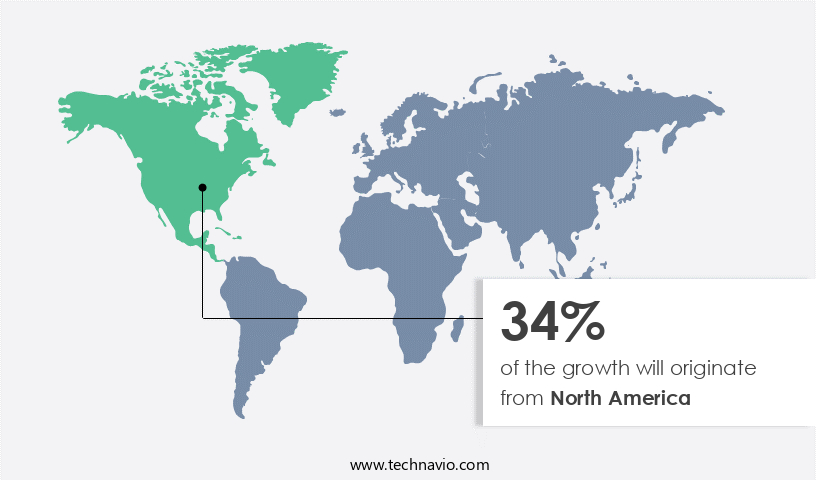
The market in North America is witnessing significant growth, fueled by technological innovations and shifting consumer preferences. This dynamic market is marked by the widespread adoption of digital platforms, enhancing accessibility and efficiency for both consumers and businesses. A pivotal trend shaping the regional digital insurance landscape is the emergence of Insurtech companies. These tech-driven firms deliver innovative insurance solutions, catering to the evolving market needs. In February 2023, a California-based Insurtech firm, NEXT Insurance, announced a strategic partnership with LegalZoom. This collaboration aims to streamline the insurance buying process for small businesses by integrating insurance offerings with LegalZoom's legal services platform.

Moreover, biometric authentication and API integrations are transforming the industry by ensuring secure and seamless customer experiences. Policy administration systems, fraud detection, and predictive modeling are other key areas where technology is driving improvements, leading to increased customer satisfaction and loyalty. Additionally, regulatory compliance, such as GDPR and KYC/AML, is being addressed through advanced digital identity verification and regulatory reporting solutions. Insurance platforms are incorporating machine learning and AI-powered chatbots to provide personalized insurance offerings and enhance claims processing. Wearable technology and usage-based insurance are also gaining traction, enabling real-time risk assessment and tailored insurance policies. Furthermore, open banking and big data are revolutionizing the industry by enabling real-time data access and analytics, leading to improved risk assessment and pricing models.

Blockchain technology is being explored for its potential in risk transfer, claims processing, and policy administration, offering increased transparency and security. Reinsurance treaties are being digitized, enabling real-time risk assessment and transfer, and reducing the need for intermediaries. Policy lifecycle management, including policy renewals and claims management, is being automated, leading to increased efficiency and reduced costs. Insurtech solutions are also addressing the challenges of on-demand insurance, catastrophe modeling, and investment strategies, providing customized solutions for various industries and use cases. Digital insurance policies, claims processing, and loss ratio analysis are other areas where technology is driving significant improvements, leading to increased competitiveness and customer satisfaction.

The market in North America is a dynamic and evolving landscape, shaped by technological advancements, changing consumer preferences, and regulatory requirements. The integration of various technologies, including biometric authentication, API integrations, machine learning, and blockchain, is driving innovation and improving the overall customer experience. The market is expected to continue growing, as businesses and consumers increasingly demand more accessible, efficient, and personalized insurance solutions.

Market Dynamics

Our researchers analyzed the data with 2023 as the base year, along with the key drivers, trends, and challenges. A holistic analysis of drivers will help companies refine their marketing strategies to gain a competitive advantage.

In the dynamic and evolving the market, insurers leverage advanced technology to deliver innovative solutions that cater to customers' diverse needs. Digital platforms facilitate seamless policy purchases, real-time claims processing, and personalized risk assessments. Artificial intelligence and machine learning algorithms enhance underwriting, fraud detection, and customer engagement. Telematics devices monitor driving behavior for usage-based insurance. Blockchain technology ensures secure data sharing and smart contracts. Mobile apps enable on-the-go access to policies, claims, and customer service. Robo-advisors offer customized recommendations based on user data. Cybersecurity measures protect sensitive information. Digital transformation in the insurance industry continues to redefine customer experience and operational efficiency.

What are the key market drivers leading to the rise in the adoption of Digital Insurance Industry?

  • The significant growth in the number of insurance policies sold is the primary factor fueling market expansion. 
  • The market is experiencing notable growth due to several factors. One significant driver is the increasing enrollment in Medicare, projected to reach 61 million in 2024, with further expansion to 74 million by 2034. This demographic shift underscores the rising demand for Health Insurance among the aging population. Moreover, advancements in technology are revolutionizing the insurance industry. Affiliate marketing strategies are being employed to expand customer reach, while insurtech solutions streamline policy administration systems. Biometric authentication and fraud detection systems ensure policyholder security and accuracy.
  • Reinsurance treaties are being managed through blockchain technology for enhanced transparency and efficiency. Insurance premiums are being calculated using advanced catastrophe modeling and risk assessment techniques. API integrations enable seamless data exchange between insurers and third-party providers, ensuring accurate and timely policy renewals. These technological advancements are transforming the insurance landscape, making it more accessible and convenient for customers.

What are the market trends shaping the Digital Insurance Industry?

  • The digital insurance sector is experiencing an emerging trend towards the development of Living Connected Care (LTC) solutions. LTC is a significant innovation in the industry, and its adoption is increasingly mandatory for insurers to remain competitive.
  • The market is experiencing substantial growth and transformation due to the adoption of advanced technologies. Actuarial modeling and predictive analytics are increasingly being used to assess risk and price policies more accurately. Insurance platforms are integrating digital identity verification systems to ensure GDPR compliance and enhance security. On-demand insurance solutions are gaining popularity, offering customers flexible coverage for specific periods. AI-powered chatbots are streamlining customer interactions, providing personalized insurance recommendations based on data analysis. Policy lifecycle management systems enable insurers to automate processes, reduce errors, and improve efficiency. Social media marketing is being leveraged to reach wider audiences and engage customers.
  • Data privacy and encryption are critical concerns, with insurers investing in robust security measures to protect sensitive customer information. The integration of LCNC platforms simplifies application development, reducing complexity and development time, and broadening the talent pool for insurance tech projects. These innovations are shaping the future of the digital insurance industry.

What challenges does the Digital Insurance Industry face during its growth?

  • In the digital insurance sector, ensuring regulatory compliance is a critical challenge that significantly impacts industry growth. This requirement necessitates a profound understanding of various regulations and their implementation in the digital context, as non-compliance can lead to severe consequences, including legal action and reputational damage. 
  • The market is subject to rigorous regulatory reporting requirements, with regulations such as the General Data Protection Regulation (GDPR) and the California Consumer Privacy Act (CCPA) shaping the industry landscape. Insurers must ensure compliance with customer data management, consent mechanisms, data breach reporting, and the lawful processing of personal information to avoid severe penalties, reputational damage, and customer trust erosion. Compliance with regulations like the Health Insurance Portability and Accountability Act (HIPAA) for medical information and the Gramm-Leach-Bliley Act (GLBA) for financial data is mandatory. Insurtech innovations, such as mobile apps, payment gateways, and IoT sensors, are transforming the market.
  • Big data and cloud computing enable insurers to leverage data analytics for risk assessment, claims frequency analysis, and machine learning models to personalize insurance offerings. Customer churn is a significant concern, and insurers are investing in insurance broking and pay-per-click (PPC) marketing strategies to attract and retain customers. The market's future growth depends on the ability to balance regulatory compliance with technological innovation and customer expectations.

Exclusive Customer Landscape

The digital insurance market forecasting report includes the adoption lifecycle of the market, covering from the innovator's stage to the laggard's stage. It focuses on adoption rates in different regions based on penetration. Furthermore, the digital insurance market report also includes key purchase criteria and drivers of price sensitivity to help companies evaluate and develop their market growth analysis strategies.
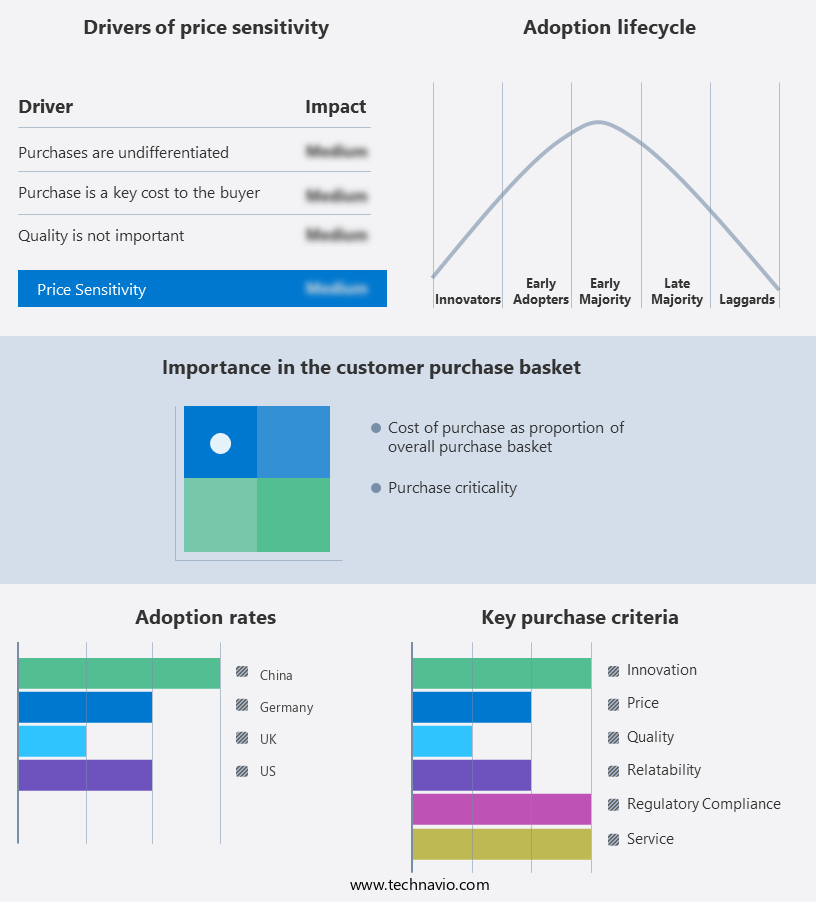
Digital Insurance Market Share by Geography

 Customer Landscape

Key Companies & Market Insights

Companies are implementing various strategies, such as strategic alliances, digital insurance market forecast, partnerships, mergers and acquisitions, geographical expansion, and product/service launches, to enhance their presence in the industry.

ACKO General Insurance Ltd - In the digital insurance landscape, our company provides coverage for automobiles, bicycles, and health, leveraging advanced technology to streamline the buying process and deliver customized policies to clients worldwide.

The industry research and growth report includes detailed analyses of the competitive landscape of the market and information about key companies, including:

  • ACKO General Insurance Ltd
  • Allianz SE
  • AXA Group
  • DeadHappy Ltd.
  • Ethos Technologies Inc
  • Getsafe Digital GmbH
  • Go Digit General Insurance Ltd.
  • Haven Life Insurance Agency LLC
  • Hippo Enterprises Inc
  • ICICI Prudential Life Insurance Co. Ltd
  • Insured Nomads Corp
  • Kin Insurance Technology Hub LLC
  • Ladder Insurance Services, LLC
  • Lemonade Inc.
  • Life Insurance Corp. of India
  • New York Life Insurance Co
  • NEXT Insurance
  • OPES insurance
  • Oscar Insurance Corp.
  • RELX Plc
  • Root inc
  • Sure inc
  • The Allstate Corp.
  • Turtlemint Insurance Broking Services Pvt Ltd
  • Vitality Health Limited
  • wefox Insurance AG
  • Westland Insurance
  • Willis Towers Watson Public Ltd. Co.
  • Yu Life ltd

Qualitative and quantitative analysis of companies has been conducted to help clients understand the wider business environment as well as the strengths and weaknesses of key industry players. Data is qualitatively analyzed to categorize companies as pure play, category-focused, industry-focused, and diversified; it is quantitatively analyzed to categorize companies as dominant, leading, strong, tentative, and weak.

Recent Development and News in Digital Insurance Market

  • In January 2024, Lemonade, a leading digital insurtech company, announced the launch of its new product, "Lemonade for Business," expanding its offerings beyond home and auto insurance to include commercial insurance (Reuters). This move aimed to cater to the growing demand for digital business insurance solutions.
  • In March 2024, Allstate and State Farm, two major insurance players, formed a partnership to collaborate on digital insurance initiatives, including the development of new digital products and the enhancement of their existing offerings (Wall Street Journal). This strategic alliance was aimed at strengthening their competitive positions in the rapidly evolving the market.
  • In May 2024, Chubb, a well-established insurance company, completed the acquisition of ACE Group for approximately USD28.3 billion, creating the world's largest commercial insurer (SEC Filing). This merger was a significant move to expand Chubb's market presence and enhance its product offerings in the digital insurance space.
  • In January 2025, the European Union's Executive European Commission approved the Digital Single Market Strategy for Insurance, allowing insurers to sell insurance products across EU borders, improving customer choice and competition in the European the market (European Commission Press Release). This regulatory approval was a significant step towards creating a unified the market in Europe.

Research Analyst Overview

  • In the dynamic the market, API security assumes paramount importance to safeguard sensitive data during information exchange. User interface (UI) design and user experience (UX) optimization are key differentiators, as international insurers compete for customers' attention. Investment portfolio management, data analytics dashboards, and predictive analytics enable insurers to assess risk management strategies effectively. Insurance fraud prevention and claims adjustment are enhanced through data mining and machine learning. Mobile app development is a priority for insurers, offering convenience and personalized services. Legal compliance, financial modeling, and prescriptive analytics are integral to making informed decisions. Sales funnel optimization and marketing automation are essential for effective customer onboarding.
  • Financial technology (fintech) innovations, such as microservices architecture and insurance comparison sites, disrupt traditional business models. Data governance, policy documentation, and information security management are crucial for maintaining trust and transparency. Insurance regulations demand adherence to capital allocation and third-party risk management standards. Business intelligence (BI) and decision support systems help insurers stay competitive in the rapidly evolving market. Cloud computing infrastructure and information security are vital components of a robust digital strategy.

Dive into Technavio's robust research methodology, blending expert interviews, extensive data synthesis, and validated models for unparalleled Digital Insurance Market insights. See full methodology.

Market Scope

Report Coverage

Details

Page number

204

Base year

2023

Historic period

2018-2022

Forecast period

2024-2028

Growth momentum & CAGR

Accelerate at a CAGR of 12.8%

Market growth 2024-2028

USD 67226.8 million

Market structure

Fragmented

YoY growth 2023-2024(%)

12.4

Key countries

US, China, Germany, and UK

Competitive landscape

Leading Companies, Market Positioning of Companies, Competitive Strategies, and Industry Risks

Request Free Sample

What are the Key Data Covered in this Digital Insurance Market Research and Growth Report?

  • CAGR of the Digital Insurance industry during the forecast period
  • Detailed information on factors that will drive the growth and forecasting between 2024 and 2028
  • Precise estimation of the size of the market and its contribution of the industry in focus to the parent market
  • Accurate predictions about upcoming growth and trends and changes in consumer behaviour
  • Growth of the market across North America, Europe, APAC, South America, and Middle East and Africa
  • Thorough analysis of the market's competitive landscape and detailed information about companies
  • Comprehensive analysis of factors that will challenge the digital insurance market growth of industry companies

We can help! Our analysts can customize this digital insurance market research report to meet your requirements.

Get in touch

1 Executive Summary

  • 1.1 Market overview
    • Executive Summary - Chart on Market Overview
    • Executive Summary - Data Table on Market Overview
    • Executive Summary - Chart on Global Market Characteristics
    • Executive Summary - Chart on Market by Geography
    • Executive Summary - Chart on Market Segmentation by Distribution Channel
    • Executive Summary - Chart on Market Segmentation by End-user
    • Executive Summary - Chart on Incremental Growth
    • Executive Summary - Data Table on Incremental Growth
    • Executive Summary - Chart on Company Market Positioning

2 Technavio Analysis

  • 2.1 Analysis of price sensitivity, lifecycle, customer purchase basket, adoption rates, and purchase criteria
    • Analysis of price sensitivity, lifecycle, customer purchase basket, adoption rates, and purchase criteria
  • 2.2 Criticality of inputs and Factors of differentiation
    • Overview on criticality of inputs and factors of differentiation
  • 2.3 Factors of disruption
    • Overview on factors of disruption
  • 2.4 Impact of drivers and challenges
    • Impact of drivers and challenges in 2023 and 2028

3 Market Landscape

  • 3.1 Market ecosystem
    • Parent Market
    • Data Table on - Parent Market
  • 3.2 Market characteristics
    • Market characteristics analysis
  • 3.3 Value chain analysis
    • Value Chain Analysis

4 Market Sizing

  • 4.1 Market definition
    • Offerings of companies included in the market definition
  • 4.2 Market segment analysis
    • Market segments
  • 4.3 Market size 2023
    • 4.4 Market outlook: Forecast for 2023-2028
      • Chart on Global - Market size and forecast 2023-2028 ($ million)
      • Data Table on Global - Market size and forecast 2023-2028 ($ million)
      • Chart on Global Market: Year-over-year growth 2023-2028 (%)
      • Data Table on Global Market: Year-over-year growth 2023-2028 (%)

    5 Historic Market Size

    • 5.1 Global Digital Insurance Market 2018 - 2022
      • Historic Market Size - Data Table on Global Digital Insurance Market 2018 - 2022 ($ million)
    • 5.2 Distribution Channel segment analysis 2018 - 2022
      • Historic Market Size - Distribution Channel Segment 2018 - 2022 ($ million)
    • 5.3 End-user segment analysis 2018 - 2022
      • Historic Market Size - End-user Segment 2018 - 2022 ($ million)
    • 5.4 Geography segment analysis 2018 - 2022
      • Historic Market Size - Geography Segment 2018 - 2022 ($ million)
    • 5.5 Country segment analysis 2018 - 2022
      • Historic Market Size - Country Segment 2018 - 2022 ($ million)

    6 Qualitative Analysis

    • 6.1 Impact of AI on the Global Digital Insurance Market

      7 Five Forces Analysis

      • 7.1 Five forces summary
        • Five forces analysis - Comparison between 2023 and 2028
      • 7.2 Bargaining power of buyers
        • Bargaining power of buyers - Impact of key factors 2023 and 2028
      • 7.3 Bargaining power of suppliers
        • Bargaining power of suppliers - Impact of key factors in 2023 and 2028
      • 7.4 Threat of new entrants
        • Threat of new entrants - Impact of key factors in 2023 and 2028
      • 7.5 Threat of substitutes
        • Threat of substitutes - Impact of key factors in 2023 and 2028
      • 7.6 Threat of rivalry
        • Threat of rivalry - Impact of key factors in 2023 and 2028
      • 7.7 Market condition
        • Chart on Market condition - Five forces 2023 and 2028

      8 Market Segmentation by Distribution Channel

      • 8.1 Market segments
        • Chart on Distribution Channel - Market share 2023-2028 (%)
        • Data Table on Distribution Channel - Market share 2023-2028 (%)
      • 8.2 Comparison by Distribution Channel
        • Chart on Comparison by Distribution Channel
        • Data Table on Comparison by Distribution Channel
      • 8.3 Direct sales - Market size and forecast 2023-2028
        • Chart on Direct sales - Market size and forecast 2023-2028 ($ million)
        • Data Table on Direct sales - Market size and forecast 2023-2028 ($ million)
        • Chart on Direct sales - Year-over-year growth 2023-2028 (%)
        • Data Table on Direct sales - Year-over-year growth 2023-2028 (%)
      • 8.4 Brokers/agents - Market size and forecast 2023-2028
        • Chart on Brokers/agents - Market size and forecast 2023-2028 ($ million)
        • Data Table on Brokers/agents - Market size and forecast 2023-2028 ($ million)
        • Chart on Brokers/agents - Year-over-year growth 2023-2028 (%)
        • Data Table on Brokers/agents - Year-over-year growth 2023-2028 (%)
      • 8.5 Affiliated partners - Market size and forecast 2023-2028
        • Chart on Affiliated partners - Market size and forecast 2023-2028 ($ million)
        • Data Table on Affiliated partners - Market size and forecast 2023-2028 ($ million)
        • Chart on Affiliated partners - Year-over-year growth 2023-2028 (%)
        • Data Table on Affiliated partners - Year-over-year growth 2023-2028 (%)
      • 8.6 Market opportunity by Distribution Channel
        • Market opportunity by Distribution Channel ($ million)
        • Data Table on Market opportunity by Distribution Channel ($ million)

      9 Market Segmentation by End-user

      • 9.1 Market segments
        • Chart on End-user - Market share 2023-2028 (%)
        • Data Table on End-user - Market share 2023-2028 (%)
      • 9.2 Comparison by End-user
        • Chart on Comparison by End-user
        • Data Table on Comparison by End-user
      • 9.3 Individuals - Market size and forecast 2023-2028
        • Chart on Individuals - Market size and forecast 2023-2028 ($ million)
        • Data Table on Individuals - Market size and forecast 2023-2028 ($ million)
        • Chart on Individuals - Year-over-year growth 2023-2028 (%)
        • Data Table on Individuals - Year-over-year growth 2023-2028 (%)
      • 9.4 Businesses - Market size and forecast 2023-2028
        • Chart on Businesses - Market size and forecast 2023-2028 ($ million)
        • Data Table on Businesses - Market size and forecast 2023-2028 ($ million)
        • Chart on Businesses - Year-over-year growth 2023-2028 (%)
        • Data Table on Businesses - Year-over-year growth 2023-2028 (%)
      • 9.5 Market opportunity by End-user
        • Market opportunity by End-user ($ million)
        • Data Table on Market opportunity by End-user ($ million)

      10 Customer Landscape

      • 10.1 Customer landscape overview
        • Analysis of price sensitivity, lifecycle, customer purchase basket, adoption rates, and purchase criteria

      11 Geographic Landscape

      • 11.1 Geographic segmentation
        • Chart on Market share by geography 2023-2028 (%)
        • Data Table on Market share by geography 2023-2028 (%)
      • 11.2 Geographic comparison
        • Chart on Geographic comparison
        • Data Table on Geographic comparison
      • 11.3 North America - Market size and forecast 2023-2028
        • Chart on North America - Market size and forecast 2023-2028 ($ million)
        • Data Table on North America - Market size and forecast 2023-2028 ($ million)
        • Chart on North America - Year-over-year growth 2023-2028 (%)
        • Data Table on North America - Year-over-year growth 2023-2028 (%)
      • 11.4 Europe - Market size and forecast 2023-2028
        • Chart on Europe - Market size and forecast 2023-2028 ($ million)
        • Data Table on Europe - Market size and forecast 2023-2028 ($ million)
        • Chart on Europe - Year-over-year growth 2023-2028 (%)
        • Data Table on Europe - Year-over-year growth 2023-2028 (%)
      • 11.5 APAC - Market size and forecast 2023-2028
        • Chart on APAC - Market size and forecast 2023-2028 ($ million)
        • Data Table on APAC - Market size and forecast 2023-2028 ($ million)
        • Chart on APAC - Year-over-year growth 2023-2028 (%)
        • Data Table on APAC - Year-over-year growth 2023-2028 (%)
      • 11.6 South America - Market size and forecast 2023-2028
        • Chart on South America - Market size and forecast 2023-2028 ($ million)
        • Data Table on South America - Market size and forecast 2023-2028 ($ million)
        • Chart on South America - Year-over-year growth 2023-2028 (%)
        • Data Table on South America - Year-over-year growth 2023-2028 (%)
      • 11.7 Middle East and Africa - Market size and forecast 2023-2028
        • Chart on Middle East and Africa - Market size and forecast 2023-2028 ($ million)
        • Data Table on Middle East and Africa - Market size and forecast 2023-2028 ($ million)
        • Chart on Middle East and Africa - Year-over-year growth 2023-2028 (%)
        • Data Table on Middle East and Africa - Year-over-year growth 2023-2028 (%)
      • 11.8 US - Market size and forecast 2023-2028
        • Chart on US - Market size and forecast 2023-2028 ($ million)
        • Data Table on US - Market size and forecast 2023-2028 ($ million)
        • Chart on US - Year-over-year growth 2023-2028 (%)
        • Data Table on US - Year-over-year growth 2023-2028 (%)
      • 11.9 China - Market size and forecast 2023-2028
        • Chart on China - Market size and forecast 2023-2028 ($ million)
        • Data Table on China - Market size and forecast 2023-2028 ($ million)
        • Chart on China - Year-over-year growth 2023-2028 (%)
        • Data Table on China - Year-over-year growth 2023-2028 (%)
      • 11.10 Germany - Market size and forecast 2023-2028
        • Chart on Germany - Market size and forecast 2023-2028 ($ million)
        • Data Table on Germany - Market size and forecast 2023-2028 ($ million)
        • Chart on Germany - Year-over-year growth 2023-2028 (%)
        • Data Table on Germany - Year-over-year growth 2023-2028 (%)
      • 11.11 UK - Market size and forecast 2023-2028
        • Chart on UK - Market size and forecast 2023-2028 ($ million)
        • Data Table on UK - Market size and forecast 2023-2028 ($ million)
        • Chart on UK - Year-over-year growth 2023-2028 (%)
        • Data Table on UK - Year-over-year growth 2023-2028 (%)
      • 11.12 Canada - Market size and forecast 2023-2028
        • Chart on Canada - Market size and forecast 2023-2028 ($ million)
        • Data Table on Canada - Market size and forecast 2023-2028 ($ million)
        • Chart on Canada - Year-over-year growth 2023-2028 (%)
        • Data Table on Canada - Year-over-year growth 2023-2028 (%)
      • 11.13 India - Market size and forecast 2023-2028
        • Chart on India - Market size and forecast 2023-2028 ($ million)
        • Data Table on India - Market size and forecast 2023-2028 ($ million)
        • Chart on India - Year-over-year growth 2023-2028 (%)
        • Data Table on India - Year-over-year growth 2023-2028 (%)
      • 11.14 France - Market size and forecast 2023-2028
        • Chart on France - Market size and forecast 2023-2028 ($ million)
        • Data Table on France - Market size and forecast 2023-2028 ($ million)
        • Chart on France - Year-over-year growth 2023-2028 (%)
        • Data Table on France - Year-over-year growth 2023-2028 (%)
      • 11.15 Brazil - Market size and forecast 2023-2028
        • Chart on Brazil - Market size and forecast 2023-2028 ($ million)
        • Data Table on Brazil - Market size and forecast 2023-2028 ($ million)
        • Chart on Brazil - Year-over-year growth 2023-2028 (%)
        • Data Table on Brazil - Year-over-year growth 2023-2028 (%)
      • 11.16 Japan - Market size and forecast 2023-2028
        • Chart on Japan - Market size and forecast 2023-2028 ($ million)
        • Data Table on Japan - Market size and forecast 2023-2028 ($ million)
        • Chart on Japan - Year-over-year growth 2023-2028 (%)
        • Data Table on Japan - Year-over-year growth 2023-2028 (%)
      • 11.17 Mexico - Market size and forecast 2023-2028
        • Chart on Mexico - Market size and forecast 2023-2028 ($ million)
        • Data Table on Mexico - Market size and forecast 2023-2028 ($ million)
        • Chart on Mexico - Year-over-year growth 2023-2028 (%)
        • Data Table on Mexico - Year-over-year growth 2023-2028 (%)
      • 11.18 Market opportunity by geography
        • Market opportunity by geography ($ million)
        • Data Tables on Market opportunity by geography ($ million)

      12 Drivers, Challenges, and Opportunity/Restraints

      • 12.1 Market drivers
        • 12.2 Market challenges
          • 12.3 Impact of drivers and challenges
            • Impact of drivers and challenges in 2023 and 2028
          • 12.4 Market opportunities/restraints

            13 Competitive Landscape

            • 13.1 Overview
              • 13.2 Competitive Landscape
                • Overview on criticality of inputs and factors of differentiation
              • 13.3 Landscape disruption
                • Overview on factors of disruption
              • 13.4 Industry risks
                • Impact of key risks on business

              14 Competitive Analysis

              • 14.1 Companies profiled
                • Companies covered
              • 14.2 Company ranking index
                • Company ranking index
              • 14.3 Market positioning of companies
                • Matrix on companies position and classification
              • 14.4 ACKO General Insurance Ltd
                • ACKO General Insurance Ltd - Overview
                • ACKO General Insurance Ltd - Product / Service
                • ACKO General Insurance Ltd - Key offerings
                • SWOT
              • 14.5 DeadHappy Ltd.
                • DeadHappy Ltd. - Overview
                • DeadHappy Ltd. - Product / Service
                • DeadHappy Ltd. - Key offerings
                • SWOT
              • 14.6 Getsafe Digital GmbH
                • Getsafe Digital GmbH - Overview
                • Getsafe Digital GmbH - Product / Service
                • Getsafe Digital GmbH - Key offerings
                • SWOT
              • 14.7 Go Digit General Insurance Ltd.
                • Go Digit General Insurance Ltd. - Overview
                • Go Digit General Insurance Ltd. - Product / Service
                • Go Digit General Insurance Ltd. - Key offerings
                • SWOT
              • 14.8 Haven Life Insurance Agency LLC
                • Haven Life Insurance Agency LLC - Overview
                • Haven Life Insurance Agency LLC - Product / Service
                • Haven Life Insurance Agency LLC - Key offerings
                • SWOT
              • 14.9 Hippo Enterprises Inc
                • Hippo Enterprises Inc - Overview
                • Hippo Enterprises Inc - Business segments
                • Hippo Enterprises Inc - Key offerings
                • Hippo Enterprises Inc - Segment focus
                • SWOT
              • 14.10 Insured Nomads Corp
                • Insured Nomads Corp - Overview
                • Insured Nomads Corp - Product / Service
                • Insured Nomads Corp - Key offerings
                • SWOT
              • 14.11 Kin Insurance Technology Hub LLC
                • Kin Insurance Technology Hub LLC - Overview
                • Kin Insurance Technology Hub LLC - Product / Service
                • Kin Insurance Technology Hub LLC - Key offerings
                • SWOT
              • 14.12 Ladder Insurance Services, LLC
                • Ladder Insurance Services, LLC - Overview
                • Ladder Insurance Services, LLC - Product / Service
                • Ladder Insurance Services, LLC - Key offerings
                • SWOT
              • 14.13 Lemonade Inc.
                • Lemonade Inc. - Overview
                • Lemonade Inc. - Product / Service
                • Lemonade Inc. - Key offerings
                • SWOT
              • 14.14 Oscar Insurance Corp.
                • Oscar Insurance Corp. - Overview
                • Oscar Insurance Corp. - Product / Service
                • Oscar Insurance Corp. - Key offerings
                • SWOT
              • 14.15 Root inc
                • Root inc - Overview
                • Root inc - Product / Service
                • Root inc - Key offerings
                • SWOT
              • 14.16 The Allstate Corp.
                • The Allstate Corp. - Overview
                • The Allstate Corp. - Business segments
                • The Allstate Corp. - Key offerings
                • The Allstate Corp. - Segment focus
                • SWOT
              • 14.17 Vitality Health Limited
                • Vitality Health Limited - Overview
                • Vitality Health Limited - Product / Service
                • Vitality Health Limited - Key offerings
                • SWOT
              • 14.18 Westland Insurance
                • Westland Insurance - Overview
                • Westland Insurance - Product / Service
                • Westland Insurance - Key offerings
                • SWOT

              15 Appendix

              • 15.1 Scope of the report
                • 15.2 Inclusions and exclusions checklist
                  • Inclusions checklist
                  • Exclusions checklist
                • 15.3 Currency conversion rates for US$
                  • Currency conversion rates for US$
                • 15.4 Research methodology
                  • Research methodology
                • 15.5 Data procurement
                  • Information sources
                • 15.6 Data validation
                  • Data validation
                • 15.7 Validation techniques employed for market sizing
                  • Validation techniques employed for market sizing
                • 15.8 Data synthesis
                  • Data synthesis
                • 15.9 360 degree market analysis
                  • 360 degree market analysis
                • 15.10 List of abbreviations
                  • List of abbreviations

                Research Methodology

                Technavio presents a detailed picture of the market by way of study, synthesis, and summation of data from multiple sources. The analysts have presented the various facets of the market with a particular focus on identifying the key industry influencers. The data thus presented is comprehensive, reliable, and the result of extensive research, both primary and secondary.

                INFORMATION SOURCES

                Primary sources

                • Manufacturers and suppliers
                • Channel partners
                • Industry experts
                • Strategic decision makers

                Secondary sources

                • Industry journals and periodicals
                • Government data
                • Financial reports of key industry players
                • Historical data
                • Press releases

                DATA ANALYSIS

                Data Synthesis

                • Collation of data
                • Estimation of key figures
                • Analysis of derived insights

                Data Validation

                • Triangulation with data models
                • Reference against proprietary databases
                • Corroboration with industry experts

                REPORT WRITING

                Qualitative

                • Market drivers
                • Market challenges
                • Market trends
                • Five forces analysis

                Quantitative

                • Market size and forecast
                • Market segmentation
                • Geographical insights
                • Competitive landscape

                Interested in this report?

                Get your sample now to see our research methodology and insights!

                Download Now

                Frequently Asked Questions

                Digital Insurance market growth will increase by $ 67226.8 mn during 2024-2028 .

                The Digital Insurance market is expected to grow at a CAGR of 12.8% during 2024-2028 .

                Digital Insurance market is segmented by Distribution Channel( Direct sales, Brokers/agents, Affiliated partners) End-user( Individuals, Businesses)

                ACKO General Insurance Ltd, Allianz SE, AXA Group, DeadHappy Ltd., Ethos Technologies Inc, Getsafe Digital GmbH, Go Digit General Insurance Ltd., Haven Life Insurance Agency LLC, Hippo Enterprises Inc, ICICI Prudential Life Insurance Co. Ltd, Insured Nomads Corp, Kin Insurance Technology Hub LLC, Ladder Insurance Services, LLC, Lemonade Inc., Life Insurance Corp. of India, New York Life Insurance Co, NEXT Insurance, OPES insurance, Oscar Insurance Corp., RELX Plc, Root inc, Sure inc, The Allstate Corp., Turtlemint Insurance Broking Services Pvt Ltd, Vitality Health Limited, wefox Insurance AG, Westland Insurance, Willis Towers Watson Public Ltd. Co., Yu Life ltd are a few of the key vendors in the Digital Insurance market.

                North America will register the highest growth rate of 34% among the other regions. Therefore, the Digital Insurance market in North America is expected to garner significant business opportunities for the vendors during the forecast period.

                US, China, Germany, UK

                • Increase in number of insurance policiesThe global digital insurance market is experiencing a significant surge in the number of insurance policies being issued is the driving factor this market.
                • driven by various factors including demographic shifts and the growing accessibility of digital platforms.Rising enrollment in Medicare: Medicare enrollment is projected to reach 61 million in 2024 is the driving factor this market.
                • up from 60 million in 2023. This upward trend is expected to continue is the driving factor this market.
                • with enrollment projected to hit 74 million by 2034. The increasing number of Medicare enrollees highlights the growing demand for health insurance among the aging population. This demographic shift is a key driver for the expansion of insurance policies is the driving factor this market.
                • as more individuals seek coverage to manage their healthcare needs.Growth in life insurance policies: In 2023 is the driving factor this market.
                • the Life Insurance Corporation of India (LIC) issued over 20.4 million new individual policies is the driving factor this market.
                • while private insurers issued approximately eight million. This resulted in a total of more than 28 million new individual policies in the country. The substantial increase in life insurance policies indicates a rising awareness and demand for financial protection among individuals. The digital transformation of the insurance sector has made it easier for consumers to access and purchase policies is the driving factor this market.
                • contributing to this growth.Digital platforms and accessibility: The adoption of digital platforms has revolutionized the insurance industry is the driving factor this market.
                • making it more accessible and user-friendly. Online portals and mobile applications enable consumers to easily compare is the driving factor this market.
                • purchase is the driving factor this market.
                • and manage insurance policies. This convenience has led to an increase in the number of policies being issued is the driving factor this market.
                • as more people can now access insurance services from the comfort of their homes.In conclusion is the driving factor this market.
                • the rise in the number of insurance policies is a key driver in the global digital insurance market. This trend is fueled by demographic changes is the driving factor this market.
                • increased accessibility through digital platforms is the driving factor this market.
                • and a growing awareness of the importance of financial protection. As the industry continues to evolve is the driving factor this market.
                • the focus on expanding coverage and improving customer experiences will remain paramount is the driving factor this market.
                • which will fuel market growth during the forecast period. is the driving factor this market.

                The Digital Insurance market vendors should focus on grabbing business opportunities from the Direct sales segment as it accounted for the largest market share in the base year.