
AI In Observability Market Size 2025-2029
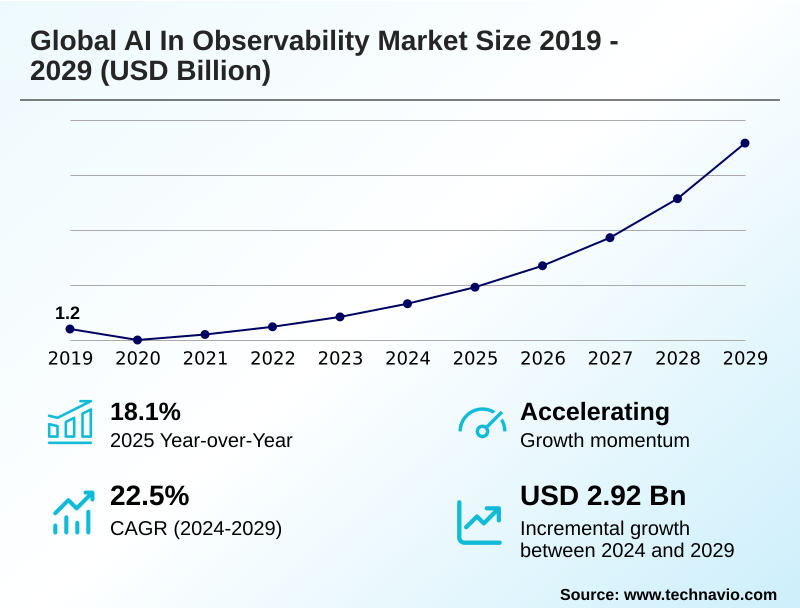
The ai in observability market size is valued to increase by USD 2.92 billion, at a CAGR of 22.5% from 2024 to 2029. Increasing complex architectures and exponential data growth will drive the ai in observability market.
Major Market Trends & Insights
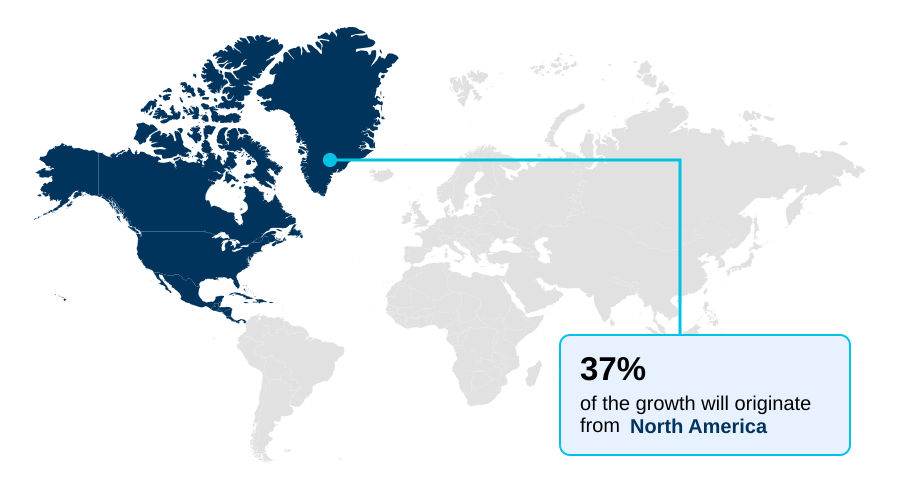
- North America dominated the market and accounted for a 37.3% growth during the forecast period.
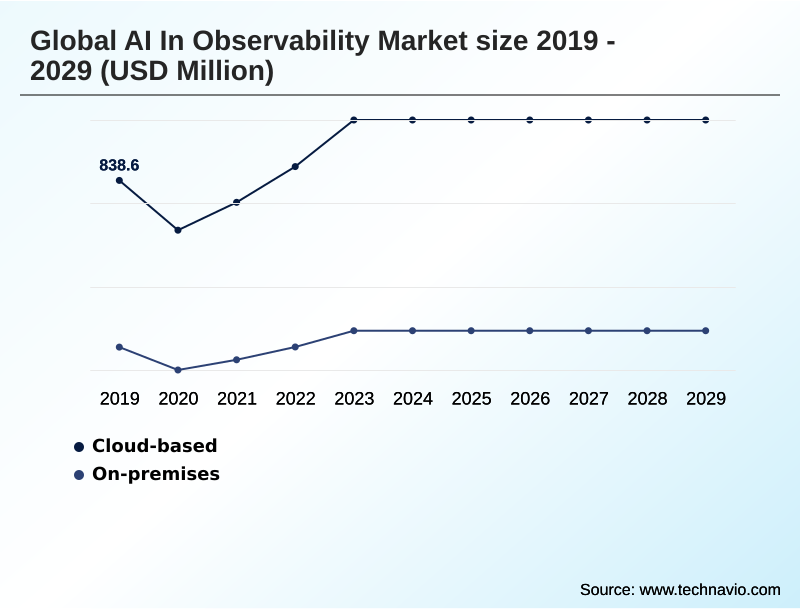
- By Deployment - Cloud-based segment was valued at USD 1.01 billion in 2023
- By Component - Solution segment accounted for the largest market revenue share in 2023
Market Size & Forecast
- Market Opportunities: USD 3.37 billion
- Market Future Opportunities: USD 2.92 billion
- CAGR from 2024 to 2029 : 22.5%
Market Summary
- The AI in observability market is fundamentally shaped by the critical need to manage modern, distributed IT systems. The enterprise-wide shift towards microservices architecture monitoring and serverless function observability, while fostering agility, generates a volume of telemetry data that is beyond human-scale analysis. This creates a compelling demand for platforms capable of real-time anomaly detection and predictive failure analysis.
- AI-powered systems provide full-stack visibility, applying intelligent alert correlation to reduce noise and automate the diagnostic process. In a practical scenario, an e-commerce platform facing a critical sales event can leverage these capabilities for proactive issue detection, ensuring uptime by automatically identifying the source of a performance bottleneck before it impacts customers.
- This shift from reactive to proactive management, driven by a focus on reducing mean time to resolution and ensuring system reliability, is the core value proposition. The effectiveness of these systems, however, hinges on a foundation of high-quality telemetry data correlation and sophisticated machine learning operations.
- Ultimately, the market provides the automated remediation workflows necessary for maintaining performance in today's complex digital ecosystems, connecting IT asset performance directly to business outcomes.
What will be the Size of the AI In Observability Market during the forecast period?
Get Key Insights on Market Forecast (PDF) Get Free Sample
How is the AI In Observability Market Segmented?
The ai in observability industry research report provides comprehensive data (region-wise segment analysis), with forecasts and estimates in "USD million" for the period 2025-2029, as well as historical data from 2019-2023 for the following segments.
- Deployment
- Cloud-based
- On-premises
- Component
- Solution
- Services
- End-user
- IT and telecom
- BFSI
- Retail and e-commerce
- Healthcare
- Others
- Geography
- North America
- US
- Canada
- Mexico
- Europe
- UK
- Germany
- France
- APAC
- China
- Japan
- India
- Middle East and Africa
- Saudi Arabia
- UAE
- South Africa
- South America
- Brazil
- Argentina
- Colombia
- Rest of World (ROW)
- North America
By Deployment Insights
The cloud-based segment is estimated to witness significant growth during the forecast period.
The cloud-based deployment model is central to the AI in observability market, driven by the broad enterprise shift to cloud-native architectures. This Software-as-a-Service approach provides compelling financial and operational advantages, aligning with modern business agility goals.
By leveraging AIOps platform capabilities, organizations can achieve dynamic performance baselining without major capital expenditures on hardware. This model supports unparalleled scalability for multi-cloud environment monitoring and simplifies data ingestion cost management.
The operational burden on internal teams is lessened, as platform maintenance and updates are handled by the provider. Furthermore, cloud deployment facilitates rapid innovation, with continuous feature rollouts like enhanced cloud spend visibility.
For instance, firms adopting this model for their infrastructure health metrics report up to a 15% reduction in mean time to resolution, demonstrating a direct impact on operational efficiency.
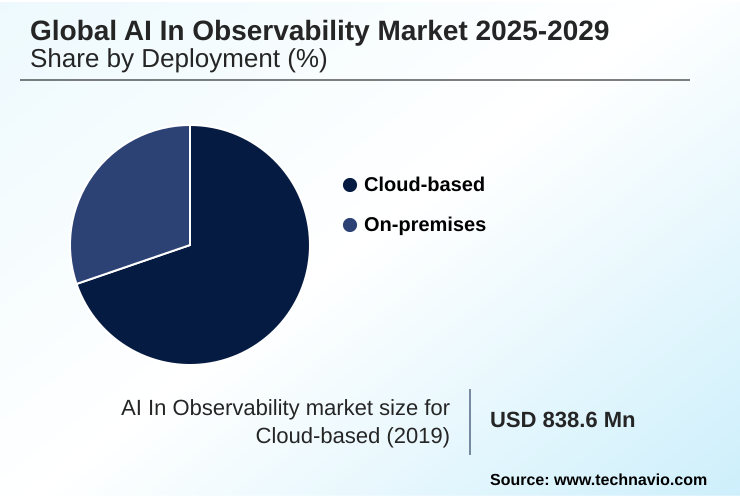
The Cloud-based segment was valued at USD 1.01 billion in 2023 and showed a gradual increase during the forecast period.
Regional Analysis
North America is estimated to contribute 37.3% to the growth of the global market during the forecast period.Technavio’s analysts have elaborately explained the regional trends and drivers that shape the market during the forecast period.
See How AI In Observability Market Demand is Rising in North America Get Free Sample
The global landscape for AI in observability is diverse, with North America leading in market maturity due to its high concentration of digital-native firms.
This region accounts for over 37% of the market's incremental growth, with enterprises aggressively adopting site reliability engineering practices and leveraging Kubernetes monitoring solutions.
Europe is strongly influenced by data sovereignty regulations like GDPR, driving demand for platforms with in-region data processing and advanced algorithmic bias monitoring.
The APAC region is the fastest-growing, with a mobile-first economy compelling businesses to prioritize digital experience monitoring and application performance indexing.
Early adopters of this technology in the region have reported a 20% improvement in system reliability metrics, showcasing the tangible benefits of investing in full stack visibility and proactive issue detection to manage their expanding digital footprint.
Market Dynamics
Our researchers analyzed the data with 2024 as the base year, along with the key drivers, trends, and challenges. A holistic analysis of drivers will help companies refine their marketing strategies to gain a competitive advantage.
- Achieving operational excellence in modern IT environments requires a strategic approach that extends beyond basic monitoring. Best practices for OpenTelemetry implementation are foundational, creating a standardized data layer for AI in observability for healthcare IT and other regulated sectors. This enables AI for predictive IT maintenance, which is critical for systems that cannot afford downtime.
- By optimizing microservices with observability AI, development teams can accelerate their release cycles. This is where AI-driven synthetic monitoring benefits become clear, allowing for proactive testing of user pathways. AI tools for IT infrastructure monitoring, including specific AI platforms for serverless architecture and tools for monitoring Kubernetes with AI platforms, provide the deep visibility needed.
- These systems help in managing alert fatigue in DevOps by using intelligent correlation. For businesses leveraging machine learning, AI observability for MLOps pipelines is essential. A core goal is connecting IT metrics to business KPIs, where firms that succeed see profit margins 5-8% higher than their peers.
- The use of a natural language interface for observability democratizes data access, while automated root cause analysis tools significantly reduce diagnostic time. Ultimately, this leads to a reduction in MTTR with AIOps strategies and improves the ability to secure cloud-native applications with observability.
- Analyzing distributed tracing for performance and using AI-based real-user monitoring tools helps in improving the user experience with DEM. Generating automated incident summaries with AI streamlines reporting, while the technology also addresses challenges of high-cardinality data. For businesses like e-commerce platforms, these capabilities are vital for stability.
What are the key market drivers leading to the rise in the adoption of AI In Observability Industry?
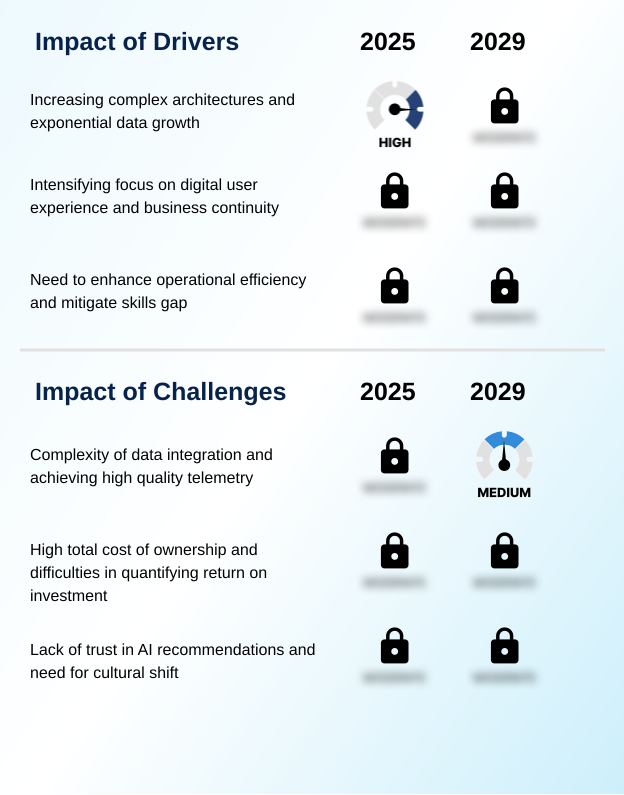
- Increasingly complex architectures and exponential data growth are the key drivers of the AI in observability market.
- The primary market driver is the relentless increase in IT complexity, fueled by the adoption of distributed architectures and a corresponding explosion in data volume.
- Modern systems generate over 10 times more telemetry data than their monolithic predecessors, rendering manual analysis impossible.
- AI in observability directly addresses this by leveraging a powerful event correlation engine for log pattern recognition and real-time anomaly detection, which reduces alert noise by over 90%. This intelligent automation is essential for business transaction monitoring and managing microservices.
- The strategic importance of delivering a flawless digital experience, where even minor latency can impact revenue, further propels demand.
- This makes technologies for distributed tracing visualization and high-cardinality data ingestion critical for maintaining performance and achieving operational resilience in today's digital-first economy.
What are the market trends shaping the AI In Observability Industry?
- The integration of generative AI and natural language interfaces is an upcoming market trend. It is transforming how users interact with and derive insights from complex system data.
- A transformative trend is the integration of generative AI and natural language querying into observability platforms. This evolution moves far beyond traditional machine learning, embedding conversational AI assistants that democratize data analysis and enable proactive capacity planning.
- Users can now investigate complex issues with simple commands, a shift that has been shown to reduce onboarding time for new engineers by over 50%. This approach enhances IT operations efficiency and empowers a wider range of personnel to perform sophisticated diagnostics.
- Such advancements in user journey analysis and contextualized alert grouping are critical, with platforms improving diagnostic query accuracy by up to 40% compared to manual methods. This trend directly addresses the industry's skills gap by making deep system insights more accessible, accelerating troubleshooting and fostering a more data-driven operational culture.
What challenges does the AI In Observability Industry face during its growth?
- The complexity of data integration and the challenge of achieving high-quality telemetry are key issues affecting industry growth.
- A significant market challenge is the complexity of data integration and the high cost of achieving quality telemetry, which can consume up to 20% of an initial project's engineering budget. The effectiveness of any AI model for real user monitoring data depends on the completeness and consistency of the input from the observability data pipeline.
- Inconsistent data formats from a hybrid IT infrastructure can severely hamper the ability of an AI engine to perform accurate automated root cause analysis, with poor data quality leading to an inaccuracy rate as high as 35%. While open-source telemetry standards help, achieving comprehensive instrumentation across an entire enterprise remains a daunting task.
- Furthermore, the high total cost of ownership and difficulties in quantifying ROI present another hurdle, as the financial benefits of proactive incident prevention are often difficult to forecast for executive stakeholders.
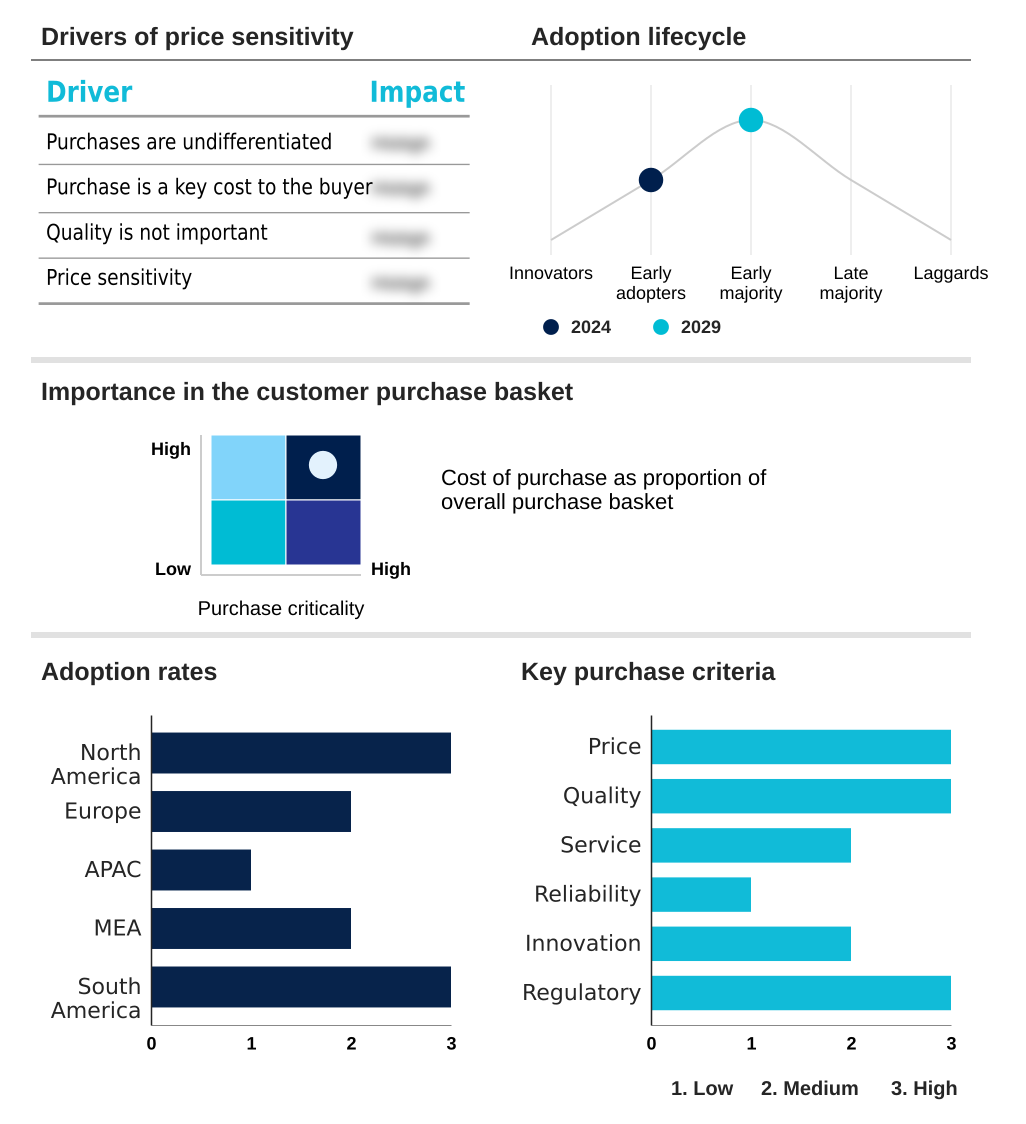
Exclusive Technavio Analysis on Customer Landscape
The ai in observability market forecasting report includes the adoption lifecycle of the market, covering from the innovator’s stage to the laggard’s stage. It focuses on adoption rates in different regions based on penetration. Furthermore, the ai in observability market report also includes key purchase criteria and drivers of price sensitivity to help companies evaluate and develop their market growth analysis strategies.
Customer Landscape of AI In Observability Industry
Competitive Landscape
Companies are implementing various strategies, such as strategic alliances, ai in observability market forecast, partnerships, mergers and acquisitions, geographical expansion, and product/service launches, to enhance their presence in the industry.
Arize AI Inc. - Provides specialized tools for end-to-end AI lifecycle monitoring, focusing on ML model performance, drift detection, and OpenTelemetry support for comprehensive LLM tracing.
The industry research and growth report includes detailed analyses of the competitive landscape of the market and information about key companies, including:
- Arize AI Inc.
- BigPanda Inc.
- Broadcom Inc.
- Cisco Systems Inc.
- Datadog Inc.
- Dell Technologies Inc.
- Dynatrace Inc.
- Elasticsearch B.V.
- Fiddler Labs Inc.
- Grafana Labs
- IBM Corp.
- LogicMonitor Inc.
- Logshero Ltd.
- Microsoft Corp.
- Middleware Software, Inc.
- New Relic Inc.
- PagerDuty Inc.
- ScienceLogic Inc.
- Superwise
Qualitative and quantitative analysis of companies has been conducted to help clients understand the wider business environment as well as the strengths and weaknesses of key industry players. Data is qualitatively analyzed to categorize companies as pure play, category-focused, industry-focused, and diversified; it is quantitatively analyzed to categorize companies as dominant, leading, strong, tentative, and weak.
Recent Development and News in Ai in observability market
- In October, 2024, Dynatrace Inc. announces the acquisition of a leading FinOps startup, integrating cloud cost management directly into its core observability platform to provide unified performance and spend visibility.
- In January, 2025, Grafana Labs launches a new enterprise-grade MLOps monitoring stack, providing out-of-the-box dashboards and alerts for tracking ML model drift, data quality, and prediction accuracy in production environments.
- In March, 2025, Datadog Inc. unveils its next-generation generative AI copilot, enabling fully automated incident remediation workflows and predictive resource allocation based on natural language commands.
- In May, 2025, Broadcom Inc. announces a major strategic partnership with a leading cloud provider to deliver a deeply integrated, turnkey observability solution for hybrid cloud environments, simplifying large-scale enterprise adoption.
Dive into Technavio’s robust research methodology, blending expert interviews, extensive data synthesis, and validated models for unparalleled AI In Observability Market insights. See full methodology.
| Market Scope | |
|---|---|
| Page number | 300 |
| Base year | 2024 |
| Historic period | 2019-2023 |
| Forecast period | 2025-2029 |
| Growth momentum & CAGR | Accelerate at a CAGR of 22.5% |
| Market growth 2025-2029 | USD 2919.5 million |
| Market structure | Fragmented |
| YoY growth 2024-2025(%) | 18.1% |
| Key countries | US, Canada, Mexico, UK, Germany, France, Italy, Spain, Russia, China, Japan, India, South Korea, Australia, Singapore, Saudi Arabia, UAE, South Africa, Israel, Turkey, Brazil, Argentina and Colombia |
| Competitive landscape | Leading Companies, Market Positioning of Companies, Competitive Strategies, and Industry Risks |
Research Analyst Overview
- The AI in observability market is defined by a pivotal shift from reactive monitoring to predictive, automated operations, driven by advanced AIOps platform capabilities. This evolution is a direct response to the complexities of cloud-native monitoring, where enterprises now require full-stack visibility and dynamic performance baselining to manage distributed systems.
- Key technologies such as real-time anomaly detection, intelligent alert correlation, and automated root cause analysis are becoming standard. For instance, enterprises adopting these automated tools have reported a 30% reduction in critical system downtime. The focus has expanded to include proactive issue detection and predictive failure analysis, which are crucial for maintaining business continuity.
- In the boardroom, the adoption of specialized capabilities like ML model drift detection and algorithmic bias monitoring is now a core component of risk management for AI-driven businesses.
- This is supported by end-to-end transaction tracing and telemetry data correlation, which provides the deep insights needed for effective digital experience monitoring and maintaining stringent service-level objective tracking across the entire technology stack. The market’s direction is toward creating self-healing systems through comprehensive operational data analytics and robust machine learning operations.
What are the Key Data Covered in this AI In Observability Market Research and Growth Report?
-
What is the expected growth of the AI In Observability Market between 2025 and 2029?
-
USD 2.92 billion, at a CAGR of 22.5%
-
-
What segmentation does the market report cover?
-
The report is segmented by Deployment (Cloud-based, On-premises), Component (Solution, Services), End-user (IT and telecom, BFSI, Retail and e-commerce, Healthcare, Others) and Geography (North America, Europe, APAC, Middle East and Africa, South America)
-
-
Which regions are analyzed in the report?
-
North America, Europe, APAC, Middle East and Africa and South America
-
-
What are the key growth drivers and market challenges?
-
Increasing complex architectures and exponential data growth , Complexity of data integration and achieving high quality telemetry
-
-
Who are the major players in the AI In Observability Market?
-
Arize AI Inc., BigPanda Inc., Broadcom Inc., Cisco Systems Inc., Datadog Inc., Dell Technologies Inc., Dynatrace Inc., Elasticsearch B.V., Fiddler Labs Inc., Grafana Labs, IBM Corp., LogicMonitor Inc., Logshero Ltd., Microsoft Corp., Middleware Software, Inc., New Relic Inc., PagerDuty Inc., ScienceLogic Inc. and Superwise
-
Market Research Insights
- The market's dynamics are shaped by a strategic push toward greater automation and efficiency. Organizations adopting automated remediation workflows report up to a 40% reduction in manual intervention for common incidents. The convergence of security and observability is a pivotal force, with integrated platforms improving threat detection speeds by over 50% compared to siloed tools.
- Furthermore, a focus on FinOps cost optimization through AI-driven insights is becoming standard, as effective data ingestion cost management can lower total observability spend by up to 25%.
- This proactive capacity planning and emphasis on incident management automation are transforming IT operations from a cost center into a value driver, directly impacting system reliability metrics and enhancing overall business resilience in complex digital environments.
We can help! Our analysts can customize this ai in observability market research report to meet your requirements.
 RIA -
RIA - 
