AI In Pathology Market Size 2025-2029
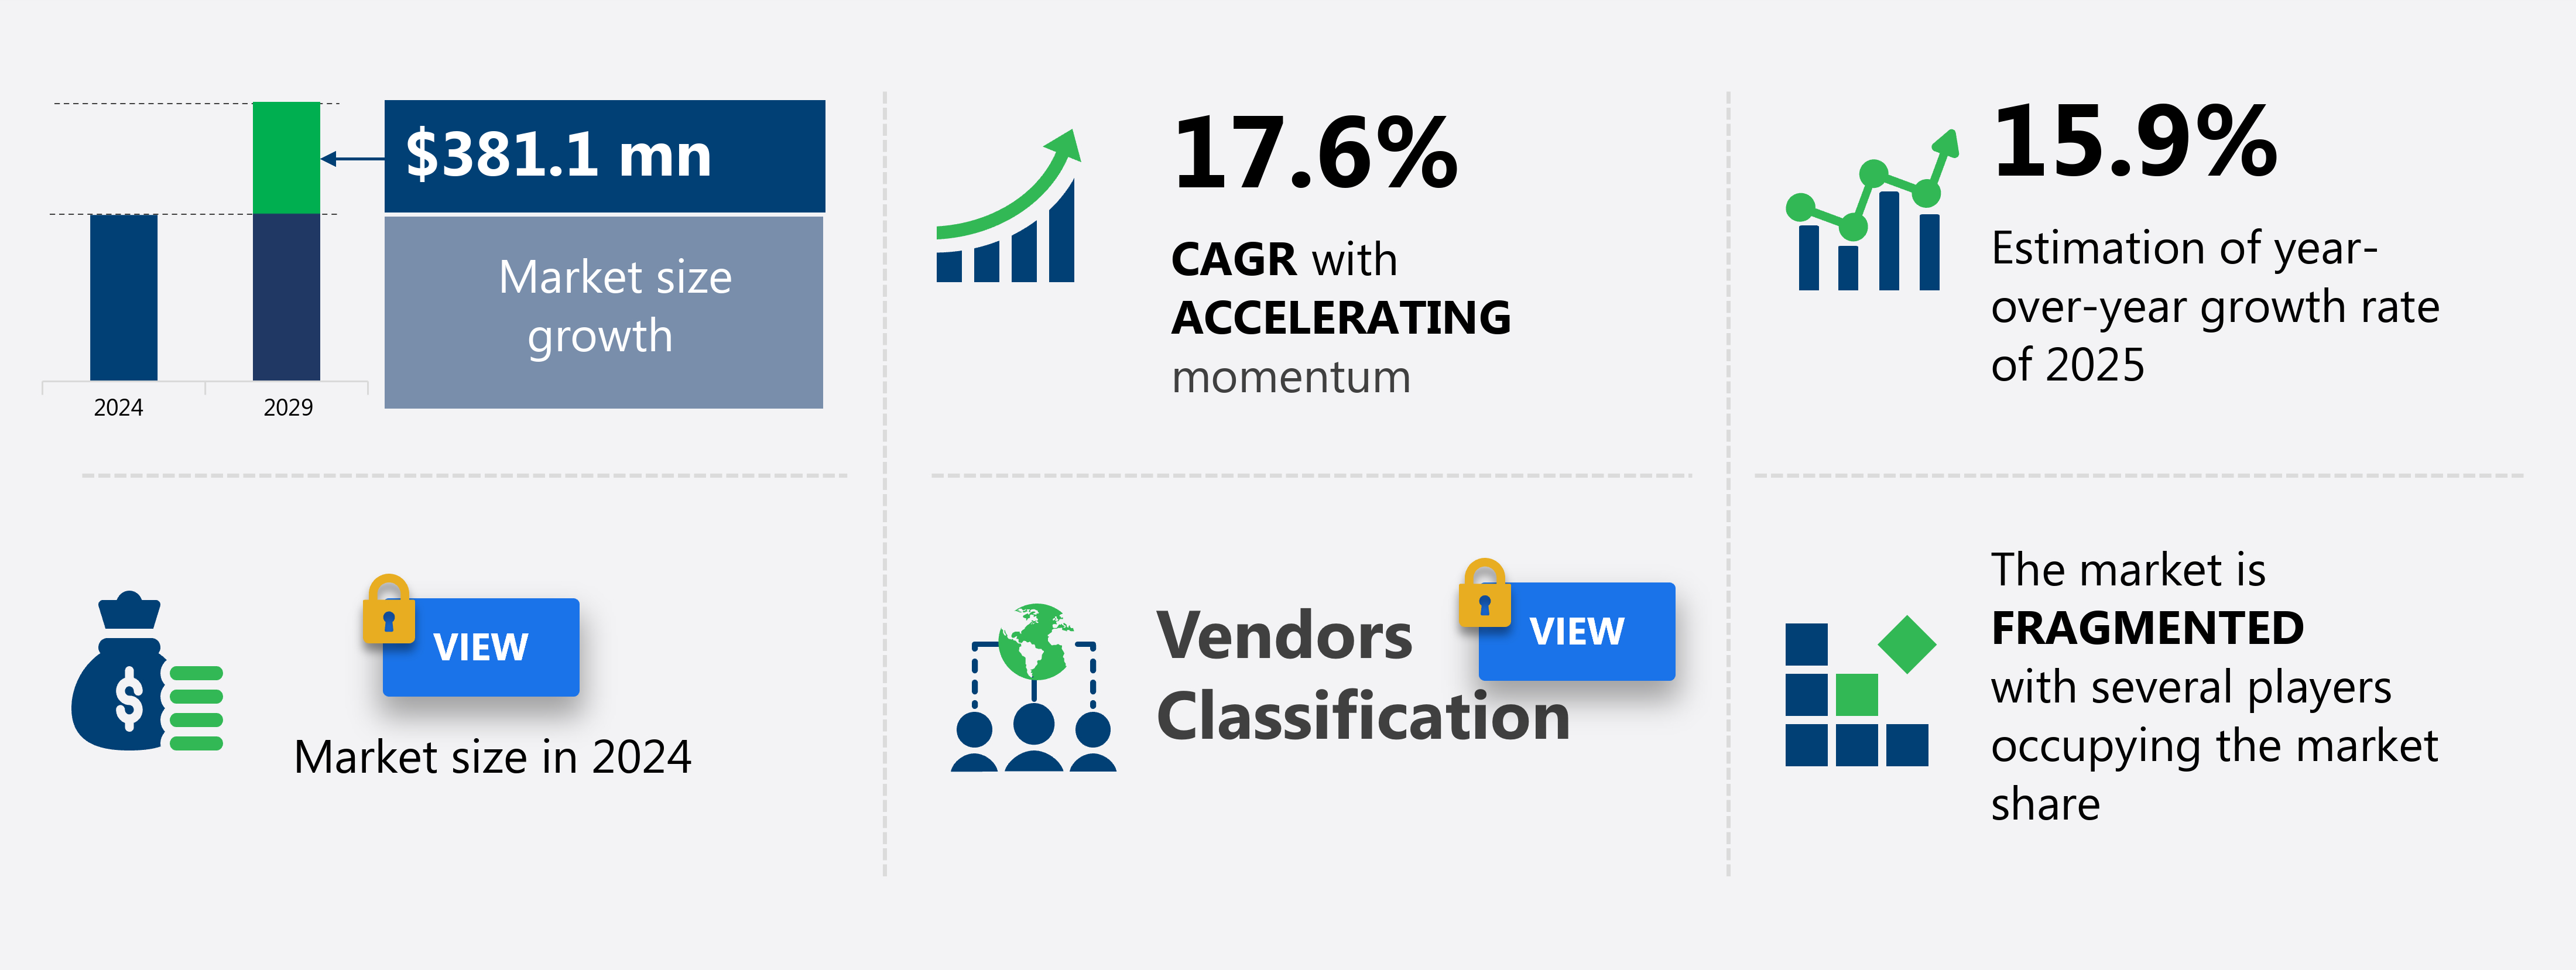
The ai in pathology market size is valued to increase by USD 381.1 million, at a CAGR of 17.6% from 2024 to 2029. Escalating cancer burden and systemic shortage of pathologists will drive the ai in pathology market.
Major Market Trends & Insights
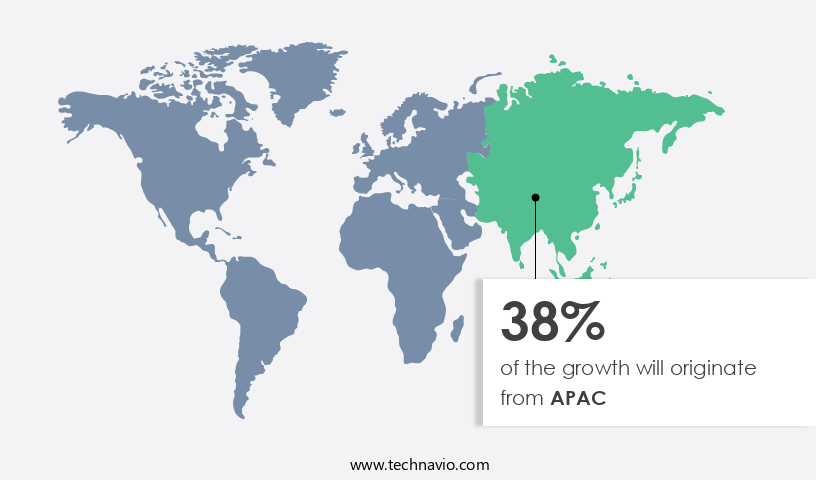
- APAC dominated the market and accounted for a 38% growth during the forecast period.
- By Component - Software segment was valued at USD 0.00 million in 2023
- CAGR from 2024 to 2029 : 17.6%
Market Summary
- Amidst the escalating global cancer burden and the persistent shortage of pathologists, the market has emerged as a promising solution. This market, valued at USD1.5 billion in 2020, is poised for significant growth as healthcare institutions seek to streamline diagnostic processes and improve patient outcomes. Integrated, end-to-end workflow platforms are the new norm, with AI systems consolidating various stages of pathology, from image analysis to diagnosis and reporting. Despite this promising outlook, challenges persist. Prohibitive implementation costs and ambiguous return on investment have hindered widespread adoption. Nevertheless, the benefits of AI in pathology are undeniable. AI systems can process vast amounts of data more efficiently and accurately than human pathologists, reducing errors and increasing productivity.
- Moreover, they can provide consistent and standardized diagnoses, contributing to improved patient care and reducing inter-observer variability. The future of AI in pathology lies in continued innovation and collaboration between technology companies and healthcare providers. By addressing the challenges of implementation costs and unclear ROI, the market can unlock its full potential and revolutionize the field of pathology. With advancements in machine learning algorithms, natural language processing, and image recognition, AI systems will increasingly become indispensable tools in the fight against cancer and other diseases.
What will be the Size of the AI In Pathology Market during the forecast period?
Get Key Insights on Market Forecast (PDF) Request Free Sample
How is the AI In Pathology Market Segmented and what are the key trends of market segmentation?
The ai in pathology industry research report provides comprehensive data (region-wise segment analysis), with forecasts and estimates in "USD million" for the period 2025-2029, as well as historical data from 2019-2023 for the following segments.
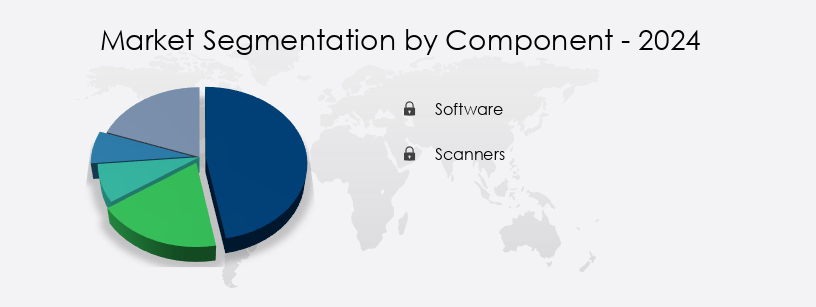
- Component
- Software
- Scanners
- Type
- Convolutional neural networks
- Recurrent neural networks
- Generative adversarial networks
- Conventional neural networks
- Others
- Application
- Drug discovery
- Disease diagnosis and prognosis
- Clinical workflow
- Training and education
- Sector
- Hospitals and reference laboratories
- Pharmaceutical and biotech companies
- Academic and research institutes
- Geography
- North America
- US
- Canada
- Europe
- France
- Germany
- UK
- APAC
- China
- India
- Japan
- South Korea
- South America
- Brazil
- Rest of World (ROW)
- North America
By Component Insights
The software segment is estimated to witness significant growth during the forecast period.
The market is witnessing a significant surge, with the software segment leading the charge. This segment includes a variety of solutions, from standalone AI algorithms for specific diagnostic tasks to comprehensive enterprise platforms managing the entire digital pathology workflow. The software's primary function is analyzing whole slide images, extracting clinically relevant information that human eyes may miss, thereby improving diagnostic accuracy, consistency, and efficiency. The market for this software is expanding rapidly, fueled by continuous technological innovation and mounting clinical evidence validating its utility. For instance, AI-assisted diagnosis and treatment response using machine learning pathology have shown a 90% diagnostic accuracy rate in clinical validation studies.
This segment also includes computer vision systems for cell detection, disease prediction, and AI-driven diagnostics. Data privacy protocols, image quality assessment, and precision oncology are integral to this market, which is expected to grow further with advancements in image recognition algorithms, image quantification, oncology image analysis, and medical image processing. The market also prioritizes regulatory compliance, diagnostic efficiency, histological feature extraction, and clinical workflow integration. Telepathology platforms, biomarker discovery, tissue classification, and deep learning models are other significant areas of focus.
Regional Analysis
APAC is estimated to contribute 38% to the growth of the global market during the forecast period.Technavio’s analysts have elaborately explained the regional trends and drivers that shape the market during the forecast period.
See How AI In Pathology Market Demand is Rising in APAC Request Free Sample
The market is experiencing significant growth, driven by the increasing adoption of artificial intelligence technologies in the healthcare sector. According to recent reports, the market is expected to expand at a remarkable pace, with the Asia Pacific region leading the charge. This region's rapid growth can be attributed to several factors, including a vast patient population, escalating healthcare expenditure, and ambitious government initiatives aimed at modernizing healthcare systems. Countries like China, Japan, South Korea, Singapore, and Australia are spearheading this transformation, with varying levels of economic development, regulatory maturity, and technological infrastructure. In developed markets such as Japan and South Korea, there is a strong push from both industry and government to utilize AI to manage aging populations and enhance the efficiency of skilled yet overburdened pathologist workforces.
The market is poised to revolutionize diagnostic accuracy and efficiency, offering significant potential for improving patient outcomes and reducing healthcare costs.
Market Dynamics
Our researchers analyzed the data with 2024 as the base year, along with the key drivers, trends, and challenges. A holistic analysis of drivers will help companies refine their marketing strategies to gain a competitive advantage.
The market is experiencing significant growth as deep learning for cancer detection and AI-powered image analysis in pathology gain increasing acceptance in the healthcare industry. Computer vision applications in digital pathology are revolutionizing the field, enabling automated tissue classification using machine learning algorithms. This technology is not only improving diagnostic accuracy but also paving the way for personalized cancer treatment. Whole slide image analysis with deep learning is a key application area, offering clinical workflow integration for AI pathology and enabling predictive modeling in pathology using AI. Image-based biomarker discovery is another significant application, with AI algorithms playing a crucial role in identifying and quantifying biomarkers for disease diagnosis and prognosis.
Regulatory frameworks for AI in healthcare are evolving to accommodate these advancements, ensuring data security in AI-powered diagnostics and addressing ethical implications. Validation of AI algorithms in pathology is essential to ensure their reliability and accuracy. Machine learning for pathology image analysis is a critical component, with tumor detection using deep learning being a primary focus. Image quality control in digital pathology is another important aspect, ensuring the accuracy and consistency of AI-assisted diagnosis in oncology. Remote pathology using AI is a growing trend, enabling pathologists to review and diagnose cases from anywhere in the world.
In the oncology sector, AI-assisted diagnosis is increasingly being used to support clinical decision-making, improving patient outcomes and reducing diagnostic errors. According to a recent study, the number of AI-powered pathology installations is projected to grow by over 50% in the next five years, reflecting the growing demand for this technology in the healthcare industry. Despite these advancements, there are challenges to overcome, including the need for robust validation and regulatory frameworks, data security concerns, and ethical implications. Addressing bias in AI pathology algorithms is a critical issue, with ongoing research focusing on developing more equitable and unbiased AI systems.
In conclusion, The market is poised for continued growth, with deep learning and computer vision applications driving innovation in cancer detection, diagnosis, and treatment. Clinical workflow integration, predictive modeling, and image-based biomarker discovery are key areas of focus, with regulatory frameworks and data security concerns shaping the market's evolution. The future of AI in pathology is bright, with the potential to revolutionize the field and improve patient outcomes.
What are the key market drivers leading to the rise in the adoption of AI In Pathology Industry?
- The escalating cancer burden and the resulting deficiency of pathologists represent the primary market drivers, necessitating urgent efforts to address this critical issue.
- The market is experiencing significant growth due to the pressing need to address the dual challenge of increasing cancer incidence and a shrinking pool of qualified pathologists. With healthcare systems in developed regions grappling with an imbalance between diagnostic demand and the available specialized workforce, AI solutions are increasingly being adopted to mitigate this crisis. The complexity and volume of cancer cases necessitate more detailed histopathological analysis, a task that is both time-consuming and labor-intensive for human pathologists. Furthermore, the pathology profession is facing demographic challenges, as a substantial portion of its workforce approaches retirement and the number of new trainees entering the field fails to keep pace.
- AI technology, with its ability to analyze vast amounts of data quickly and accurately, offers a promising solution to these challenges. For instance, AI algorithms can analyze thousands of images in a fraction of the time it takes a human pathologist, enabling faster and more accurate diagnoses. Additionally, AI systems can be trained to identify patterns and anomalies that may be missed by human analysts, enhancing diagnostic accuracy and reducing the risk of misdiagnosis. This growth is driven by the increasing adoption of AI in various sectors, including healthcare, where it is expected to revolutionize the field of pathology and improve patient outcomes.
What are the market trends shaping the AI In Pathology Industry?
- The market trend increasingly favors consolidation towards integrated, end-to-end workflow platforms. Professionals are mandated to adopt these systems for enhanced efficiency and streamlined operations.
- The market is experiencing a significant transformation as the industry moves away from standalone, single-task algorithms towards comprehensive, integrated platforms. Initially, early market entrants offered point solutions designed for specific tasks, such as mitotic figure identification or prostate cancer detection on a single slide. Although these tools were beneficial, they resulted in a fragmented and inefficient user experience, necessitating pathologists to switch between various applications and manually transfer data. The future direction lies in unified, end-to-end platforms that manage the entire digital pathology workflow.
- These platforms serve as a central operating system for modern pathology laboratories, offering a single environment for slide ingestion from multiple scanners, image management and storage, LIS integration, and access to a range of validated AI tools. This convergence streamlines the diagnostic process, enhancing efficiency and improving diagnostic accuracy.
What challenges does the AI In Pathology Industry face during its growth?
- The high implementation costs, which are often unclear in terms of the potential return on investment, represent a significant challenge to the expansion of the industry.
- Artificial intelligence (AI) in pathology is experiencing a significant evolution, transforming diagnostic processes across various sectors. The integration of AI in pathology laboratories necessitates substantial financial investment, surpassing the cost of AI software licensing. This investment extends to the acquisition of high-throughput whole slide imaging scanners, which can cost hundreds of thousands of dollars per unit. Furthermore, laboratories require a robust and scalable IT infrastructure to manage the vast amount of data generated. According to recent estimates, the global pathology AI market is projected to reach over USD10 billion by 2027, growing at a remarkable pace. Another study suggests that AI in pathology could potentially reduce diagnostic errors by up to 50%.
- These advancements underscore the potential benefits of AI in pathology, making it a compelling investment for laboratories seeking to enhance their diagnostic capabilities.
Exclusive Technavio Analysis on Customer Landscape
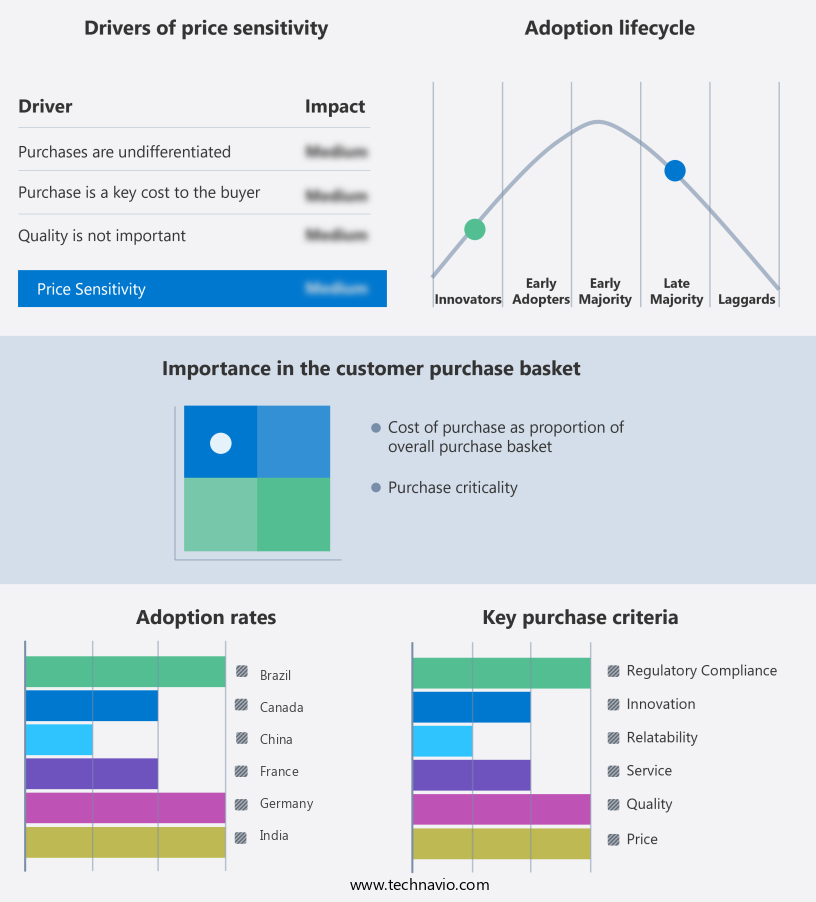
The ai in pathology market forecasting report includes the adoption lifecycle of the market, covering from the innovator’s stage to the laggard’s stage. It focuses on adoption rates in different regions based on penetration. Furthermore, the ai in pathology market report also includes key purchase criteria and drivers of price sensitivity to help companies evaluate and develop their market growth analysis strategies.
Customer Landscape of AI In Pathology Industry
Competitive Landscape
Companies are implementing various strategies, such as strategic alliances, ai in pathology market forecast, partnerships, mergers and acquisitions, geographical expansion, and product/service launches, to enhance their presence in the industry.
3DHISTECH Ltd. - The company specializes in artificial intelligence (AI) applications in pathology, utilizing high-definition digital slide scanning and AI-enhanced image analysis via its PANNORAMIC scanners and CaseViewer software. This technology streamlines diagnostic processes, enhancing accuracy and efficiency in the field.
The industry research and growth report includes detailed analyses of the competitive landscape of the market and information about key companies, including:
- 3DHISTECH Ltd.
- Agilent Technologies Inc.
- Aiforia Technologies PLC
- Clarapath Inc.
- Deep Bio Inc.
- F. Hoffmann La Roche Ltd.
- Hamamatsu Photonics KK
- Ibex Medical Analytics
- Induro, LLC
- International Business Machines Corp.
- Koninklijke Philips NV
- Leica Microsystems
- MEDIPATH
- Paige AI, Inc.
- PathAI Inc.
- Proscia Inc.
- Qritive
- Sectra AB
- Visiopharm AS
Qualitative and quantitative analysis of companies has been conducted to help clients understand the wider business environment as well as the strengths and weaknesses of key industry players. Data is qualitatively analyzed to categorize companies as pure play, category-focused, industry-focused, and diversified; it is quantitatively analyzed to categorize companies as dominant, leading, strong, tentative, and weak.
Recent Development and News in AI In Pathology Market
- In January 2024, IBM Watson Health announced the FDA clearance of its AI-powered diagnostic tool, IBM Watson Pathology, for primary diagnosis in gynecological and gastrointestinal pathology (IBM Press Release). This marked a significant milestone in the adoption of AI in pathology, allowing for more accurate and efficient diagnoses.
- In March 2024, Google's DeepMind Health and the UK's National Health Service (NHS) signed a landmark partnership agreement to deploy DeepMind's Streams AI system for identifying acute kidney injury in hospital patients (DeepMind Press Release). This strategic collaboration aimed to improve patient outcomes and reduce healthcare costs through early detection and intervention.
- In May 2024, Philips and Microsoft entered into a multi-year strategic partnership to develop and deploy AI solutions in healthcare, including pathology, with a focus on improving diagnostics and patient care (Microsoft News Center). The collaboration combined Philips' clinical expertise and Microsoft's AI capabilities to create innovative solutions for the healthcare industry.
- In April 2025, Fujifilm's AI-powered pathology diagnostic system, Celldiscover AI, received CE marking, allowing it to be marketed and sold in the European Union (Fujifilm Press Release). This approval marked the commercialization of the system, which uses deep learning algorithms to analyze histopathological images, contributing to the growth of the market.
Dive into Technavio’s robust research methodology, blending expert interviews, extensive data synthesis, and validated models for unparalleled AI In Pathology Market insights. See full methodology.
|
Market Scope |
|
|
Report Coverage |
Details |
|
Page number |
250 |
|
Base year |
2024 |
|
Historic period |
2019-2023 |
|
Forecast period |
2025-2029 |
|
Growth momentum & CAGR |
Accelerate at a CAGR of 17.6% |
|
Market growth 2025-2029 |
USD 381.1 million |
|
Market structure |
Fragmented |
|
YoY growth 2024-2025(%) |
15.9 |
|
Key countries |
China, India, Japan, South Korea, Germany, UK, France, US, Canada, and Brazil |
|
Competitive landscape |
Leading Companies, Market Positioning of Companies, Competitive Strategies, and Industry Risks |
Research Analyst Overview
- Amidst the rapidly advancing realm of healthcare technology, the application of Artificial Intelligence (AI) in pathology continues to evolve, revolutionizing diagnostic accuracy and treatment response. Machine learning pathology, a subset of this field, harnesses the power of AI to analyze cellular structures, enabling more precise diagnosis and disease prediction. AI-assisted diagnosis is transforming the landscape of pathology, with computer vision systems increasingly used for histological feature extraction. These systems, fueled by deep learning models, can process vast amounts of data from digital pathology slides, ensuring diagnostic efficiency. Moreover, they can integrate with clinical workflow systems, enhancing the overall diagnostic process.
- Tissue classification, tumor segmentation, and image recognition algorithms are key components of AI-driven diagnostics. Benchmark datasets and model training datasets are essential for algorithm validation, ensuring diagnostic accuracy. Data privacy protocols are strictly adhered to, safeguarding patient information. The integration of AI in pathology is not without challenges. Regulatory compliance and image quality assessment are critical areas of focus. Precision oncology and biomarker discovery are two significant applications of AI in pathology, offering potential for significant advancements in disease treatment. Notably, AI-assisted diagnosis in pathology is projected to grow at an unprecedented rate, with machine learning pathology expected to account for a significant share of this market.
- For instance, the use of AI in oncology image analysis is projected to increase by over 40% annually, underscoring the immense potential of this technology. In the realm of telepathology, AI plays a pivotal role in image quantification and remote pathology consultations. These advancements not only enhance diagnostic capabilities but also offer the potential for more accessible and efficient healthcare services. In summary, the integration of AI in pathology is revolutionizing diagnostic accuracy, treatment response, and clinical workflow integration. With continued advancements in machine learning pathology, the potential for significant improvements in diagnostic efficiency and disease prediction is immense.
What are the Key Data Covered in this AI In Pathology Market Research and Growth Report?
-
What is the expected growth of the AI In Pathology Market between 2025 and 2029?
-
USD 381.1 million, at a CAGR of 17.6%
-
-
What segmentation does the market report cover?
-
The report segmented by Component (Software and Scanners), Type (Convolutional neural networks, Recurrent neural networks, Generative adversarial networks, Conventional neural networks, and Others), Application (Drug discovery, Disease diagnosis and prognosis, Clinical workflow, and Training and education), Sector (Hospitals and reference laboratories, Pharmaceutical and biotech companies, and Academic and research institutes), and Geography (APAC, North America, Europe, South America, and Middle East and Africa)
-
-
Which regions are analyzed in the report?
-
APAC, North America, Europe, South America, and Middle East and Africa
-
-
What are the key growth drivers and market challenges?
-
Escalating cancer burden and systemic shortage of pathologists, Prohibitive implementation costs and ambiguous return on investment
-
-
Who are the major players in the AI In Pathology Market?
-
Key Companies 3DHISTECH Ltd., Agilent Technologies Inc., Aiforia Technologies PLC, Clarapath Inc., Deep Bio Inc., F. Hoffmann La Roche Ltd., Hamamatsu Photonics KK, Ibex Medical Analytics, Induro, LLC, International Business Machines Corp., Koninklijke Philips NV, Leica Microsystems, MEDIPATH, Paige AI, Inc., PathAI Inc., Proscia Inc., Qritive, Sectra AB, and Visiopharm AS
-
Market Research Insights
- The market is witnessing significant advancements, with drug response prediction and clinical decision support being key applications. According to industry estimates, the market for AI in pathology is projected to reach USD6.5 billion by 2025, growing at a compound annual growth rate (CAGR) of 25%. Model interpretability and data security measures are essential considerations in this market, ensuring transparency and trustworthiness. Data augmentation and feature engineering are essential techniques for enhancing the quality and quantity of training data, leading to improved model generalizability. Digital slide scanning and multi-modal imaging enable comprehensive analysis, while image cytometry and patient stratification facilitate personalized medicine.
- Quality control metrics and diagnostic biomarkers ensure accuracy and consistency, with regulatory approvals providing a legal framework for adoption. Cancer detection, treatment guidance, and pathologist support are primary applications, with AI systems offering performance evaluation, prognostic factors, and bias mitigation. Ethical considerations are paramount, with AI systems aiding in image stitching, immunohistochemistry analysis, and workflow optimization. The market's continuous evolution is marked by ongoing research and development in areas such as performance evaluation, model generalizability, and regulatory approvals.
We can help! Our analysts can customize this ai in pathology market research report to meet your requirements.
 RIA -
RIA - 
