AI In Supply Chain Optimization Market Analysis, Size, and Forecast 2025-2029: North America (US, Canada, and Mexico), Europe (Germany, UK, and France), APAC (China, India, and Japan), Middle East and Africa (UAE, Saudi Arabia, and South Africa), South America (Brazil, Argentina, and Colombia), and Rest of World (ROW)

AI In Supply Chain Optimization Market Analysis, Size, and Forecast 2025-2029:
North America (US, Canada, and Mexico), Europe (Germany, UK, and France), APAC (China, India, and Japan), Middle East and Africa (UAE, Saudi Arabia, and South Africa), South America (Brazil, Argentina, and Colombia), and Rest of World (ROW)

Published: Dec 2025 309 Pages SKU: IRTNTR81101

Market Overview at a Glance

$15.89 B
Market Opportunity
28.5%
CAGR 2024 - 2029
34.6%
North America Growth
$3.08 B
Software segment 2023

AI In Supply Chain Optimization Market Size 2025-2029

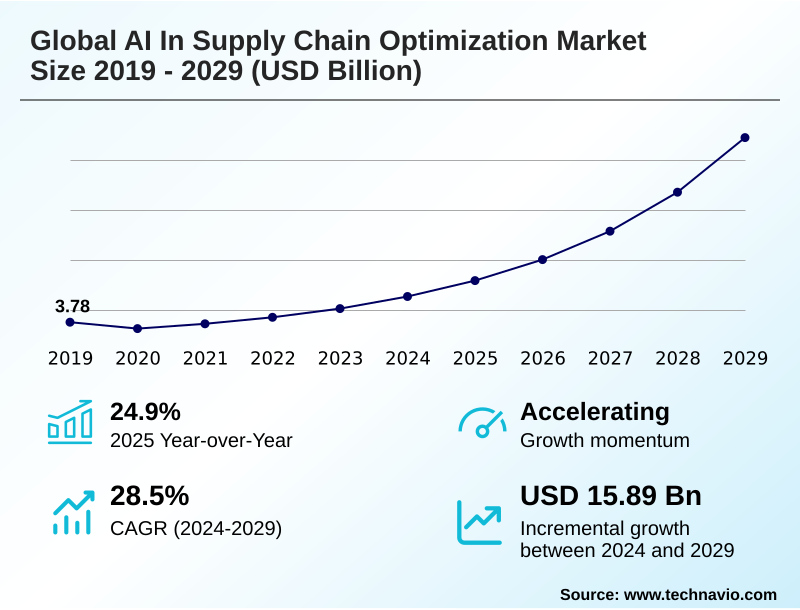
The ai in supply chain optimization market size is valued to increase by USD 15.89 billion, at a CAGR of 28.5% from 2024 to 2029. Increasing demand for enhanced supply chain visibility and agility will drive the ai in supply chain optimization market.

Major Market Trends & Insights

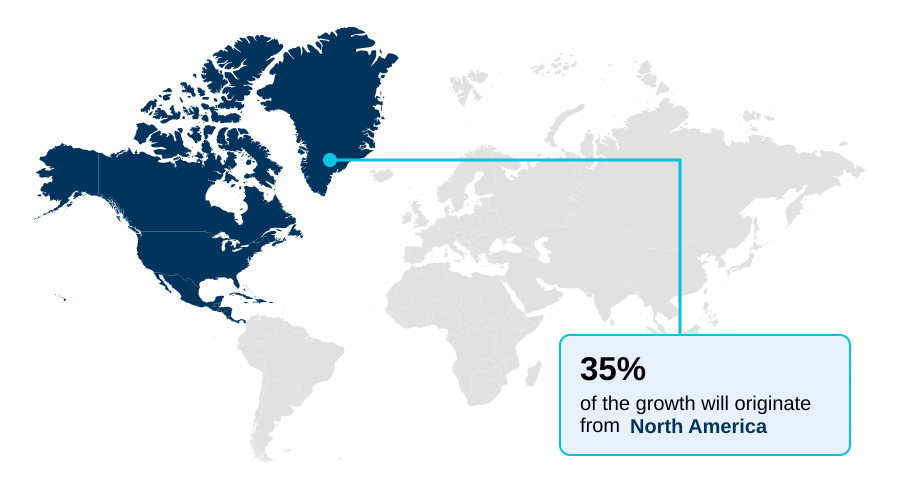
  • North America dominated the market and accounted for a 34.6% growth during the forecast period.
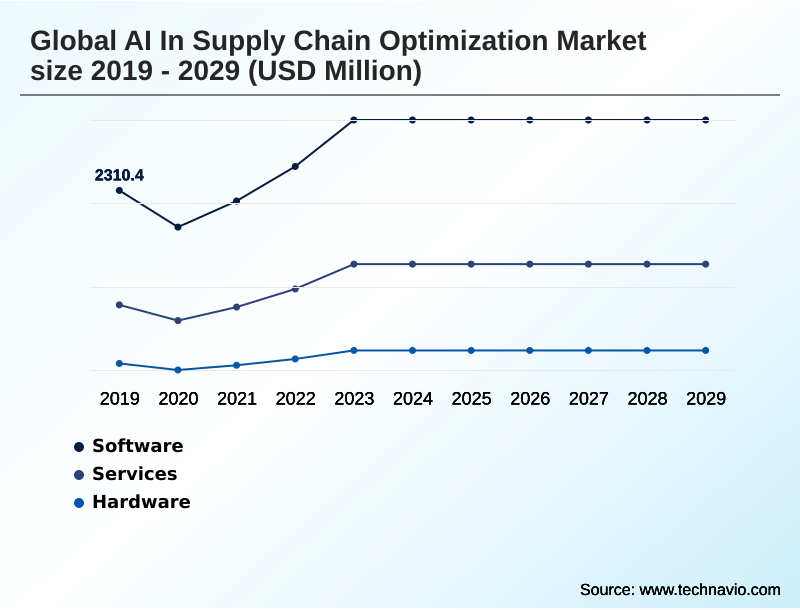
  • By Component - Software segment was valued at USD 3.08 billion in 2023
  • By Technology - Machine learning segment accounted for the largest market revenue share in 2023

Market Size & Forecast

  • Market Opportunities: USD 18.46 billion
  • Market Future Opportunities: USD 15.89 billion
  • CAGR from 2024 to 2029 : 28.5%

Market Summary

  • The AI in supply chain optimization market is defined by the strategic application of advanced computational technologies to enhance operational efficiency and resilience. Key drivers include the pressing need for greater supply chain visibility and agility in navigating global disruptions, alongside the imperative to reduce operational costs.
  • AI-powered forecasting models and machine learning models are central to this transformation, enabling more accurate demand forecasting and predictive maintenance scheduling. For example, a manufacturer can utilize real-time data analytics from IoT sensor data integration to anticipate equipment failures, scheduling maintenance proactively to avoid costly production stoppages.
  • However, significant challenges persist, including complexities in data quality, integration with legacy systems, and a pervasive shortage of specialized talent. Trends such as the rise of AI-powered digital twins and generative AI for creating supply chain network designs are shaping the future, offering unprecedented levels of end-to-end supply chain visibility and proactive risk mitigation.
  • These intelligent workflow automation tools are moving organizations from reactive problem-solving to a state of autonomous planning and dynamic operational control.

What will be the Size of the AI In Supply Chain Optimization Market during the forecast period?

Get Key Insights on Market Forecast (PDF) Request Free Sample

How is the AI In Supply Chain Optimization Market Segmented?

The ai in supply chain optimization industry research report provides comprehensive data (region-wise segment analysis), with forecasts and estimates in "USD million" for the period 2025-2029, as well as historical data from 2019-2023 for the following segments.

  • Component
    • Software
    • Services
    • Hardware
  • Technology
    • Machine learning
    • Computer vision
    • NLP
    • Others
  • End-user
    • Retail and e-commerce
    • Manufacturing
    • Automotive
    • Healthcare
    • Others
  • Geography
    • North America
      • US
      • Canada
      • Mexico
    • Europe
      • Germany
      • UK
      • France
    • APAC
      • China
      • India
      • Japan
    • Middle East and Africa
      • UAE
      • Saudi Arabia
      • South Africa
    • South America
      • Brazil
      • Argentina
      • Colombia
    • Rest of World (ROW)

By Component Insights

The software segment is estimated to witness significant growth during the forecast period.

The software segment is fundamental to the AI in supply chain optimization market, providing the intelligence for data-driven decision making. These AI-powered logistics platforms are vital for addressing operational challenges, from predictive demand planning to logistics network optimization.

Innovations in machine learning models are producing more sophisticated tools, enabling AI-powered forecasting models to analyze historical sales data alongside market trends for enhanced demand forecasting accuracy.

For instance, some AI-driven fleet management solutions have demonstrated the ability to reduce millions of miles in delivery routes through dynamic route optimization.

The adoption of AI for inventory control and intelligent workflow automation allows businesses to maintain optimal stock levels, which is crucial for minimizing carrying costs and preventing stockouts, showcasing the power of prescriptive analytics recommendations.

Request Free Sample

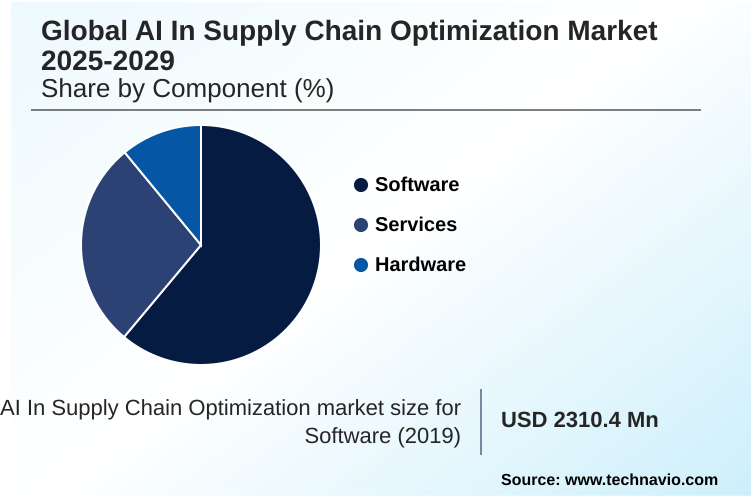
The Software segment was valued at USD 3.08 billion in 2023 and showed a gradual increase during the forecast period.

Request Free Sample

Regional Analysis

North America is estimated to contribute 34.6% to the growth of the global market during the forecast period.Technavio’s analysts have elaborately explained the regional trends and drivers that shape the market during the forecast period.

See How AI In Supply Chain Optimization Market Demand is Rising in North America Request Free Sample

The geographic landscape of the market is characterized by varied adoption rates and strategic priorities.

North America currently accounts for the largest market share at over 34%, driven by mature technology infrastructure and a focus on AI-driven supplier collaboration and last-mile delivery optimization.

In Europe, the emphasis is on sustainability and efficiency, with initiatives like carbon footprint modeling and circular economy initiatives gaining traction.

Ports in the region have seen vessel turnaround times fall by over 20% after implementing AI-powered logistics platforms for intelligent route planning and operations management.

Meanwhile, the APAC region is the fastest-growing market, leveraging smart factory AI integration and real-time data analytics to manage its vast manufacturing and logistics hubs.

AI in production planning and AI for returns management are key applications driving growth and efficiency gains across these diverse regions.

Market Dynamics

Our researchers analyzed the data with 2024 as the base year, along with the key drivers, trends, and challenges. A holistic analysis of drivers will help companies refine their marketing strategies to gain a competitive advantage.

  • Achieving superior performance in the AI in supply chain optimization market requires moving beyond generic applications to address specific operational pain points. A key focus is using AI to reduce the bullwhip effect, where advanced algorithms for route optimization and more accurate forecasting stabilize inventory levels across tiers.
  • For instance, AI-based demand forecasting for retail has shown it can improve accuracy from 70% with traditional methods to over 90%, directly enabling AI-powered inventory stock level optimization. Another critical area is generative AI for supplier onboarding automation, which streamlines validation processes.
  • Companies are also building autonomous and self-correcting supply chains by integrating AI with legacy ERP systems, a complex but highly valuable endeavor. This involves leveraging natural language processing for shipping documents to accelerate data extraction and reduce errors. Furthermore, firms are utilizing digital twin simulations for cost reduction and AI-powered risk modeling for supply chains to test resilience.
  • AI-powered tools for supply chain resilience and AI for managing volatile material supplies are becoming standard for proactive management. The scope extends to using AI for carbon footprint modeling, improving last-mile delivery efficiency with AI, and AI-driven quality inspection in manufacturing.
  • Even warehousing is being transformed by optimizing warehouse layouts with generative AI and implementing AI for predictive maintenance in logistics, all tracked via real-time tracking with AI platforms.

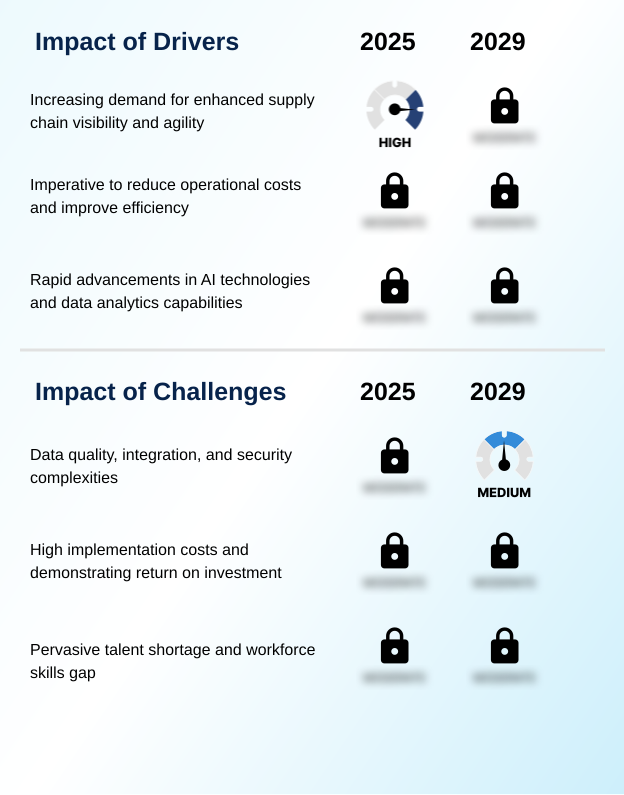
What are the key market drivers leading to the rise in the adoption of AI In Supply Chain Optimization Industry?

  • The increasing demand for enhanced supply chain visibility and agility stands as a key driver for market growth.

  • Market growth is significantly driven by the imperative for reducing operational expenditures and the rapid evolution of AI technologies.
  • AI algorithms are instrumental in optimizing transportation routes in real time by analyzing variables like traffic, weather, and fuel costs, leading to substantial fuel savings and enhanced efficiency.
  • Some companies have saved up to 10,000 hours of manual work annually by deploying AI-powered platforms. In warehouse automation systems, AI-powered robots handle picking and sorting with greater speed and accuracy, directly cutting labor costs and error rates.
  • The convergence of powerful machine learning models and rich data sources from IoT sensor data integration creates a virtuous cycle, where more data improves AI for logistics optimization and demand forecasting AI tools.
  • This dynamic is a powerful catalyst, driving further AI for resource allocation and procurement automation with AI to gain a competitive edge.

What are the market trends shaping the AI In Supply Chain Optimization Industry?

  • The proliferation of generative AI in supply chain operations is emerging as a significant market trend. This technology is enabling more proactive and creative approaches to logistics and operational problem-solving.

  • Key market trends are centered on leveraging advanced AI for proactive and intelligent operations. The adoption of AI-powered digital twins provides a dynamic, virtual replica of physical assets, allowing for comprehensive end-to-end supply chain visibility and data-driven decision making. The use of a digital twin for supply chain can lead to significant savings by simulating various sourcing and transport strategies.
  • Another major trend is the use of predictive analytics for disruptions, where AI-driven platforms analyze millions of data points to flag potential risks, from geopolitical instability to natural disasters, before they escalate. This proactive approach is critical for improving supply chain resilience.
  • Furthermore, the proliferation of generative AI in operations is reshaping core functions by creating novel content, such as optimized supply chain network designs, and automating sophisticated decision-making, which is particularly useful for AI-based risk modeling and AI-driven procurement.

What challenges does the AI In Supply Chain Optimization Industry face during its growth?

  • Complexities related to data quality, integration, and security present a key challenge affecting industry growth.

  • Significant challenges hinder the widespread adoption of AI, primarily stemming from data and talent issues. The pervasive talent shortage, with 66% of executives rating their teams' AI proficiency as medium to low, creates a major bottleneck in implementation.
  • This pervasive talent shortage and workforce skills gap necessitates aggressive reskilling, with high-performing firms being three times more likely to retrain over 30% of their workforce due to AI adoption.
  • Concurrently, data quality, integration, and security complexities are a primary cause of failure, with some research attributing up to 73% of unsuccessful AI projects to incomplete data visibility rather than flawed algorithms.
  • The challenge of data integration for AI is compounded by the difficulty of merging legacy systems with modern AI-powered logistics platforms, which obstructs efforts in AI-driven supplier collaboration and creating intelligent fleet management systems.

Exclusive Technavio Analysis on Customer Landscape

The ai in supply chain optimization market forecasting report includes the adoption lifecycle of the market, covering from the innovator’s stage to the laggard’s stage. It focuses on adoption rates in different regions based on penetration. Furthermore, the ai in supply chain optimization market report also includes key purchase criteria and drivers of price sensitivity to help companies evaluate and develop their market growth analysis strategies.

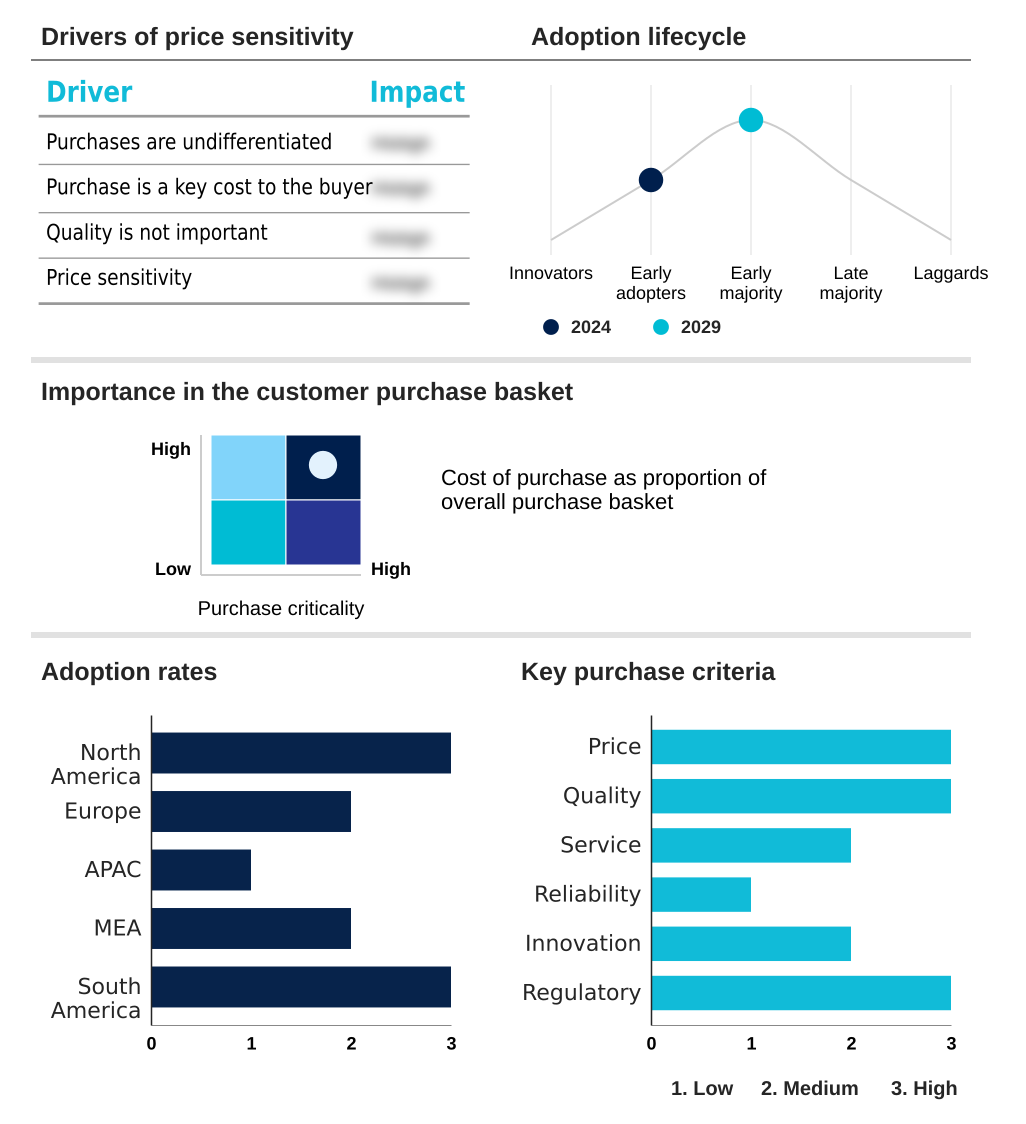
Customer Landscape of AI In Supply Chain Optimization Industry

Competitive Landscape

Companies are implementing various strategies, such as strategic alliances, ai in supply chain optimization market forecast, partnerships, mergers and acquisitions, geographical expansion, and product/service launches, to enhance their presence in the industry.

Amazon Web Services Inc. - Offers a cloud infrastructure platform leveraging machine learning services to automate procurement, logistics planning, and invoice processing for enhanced supply chain optimization.

The industry research and growth report includes detailed analyses of the competitive landscape of the market and information about key companies, including:

  • Amazon Web Services Inc.
  • Blue Yonder Group Inc.
  • Celonis SE
  • Coupa Software Inc.
  • Descartes Systems Group Inc.
  • Fourkites Inc.
  • Google LLC
  • Honeywell International Inc.
  • Infor Inc.
  • IBM Corp.
  • Kinaxis Inc.
  • Manhattan Associates Inc.
  • Microsoft Corp.
  • Oracle Corp.
  • PTC Inc.
  • SAP SE
  • Zebra Technologies Corp.

Qualitative and quantitative analysis of companies has been conducted to help clients understand the wider business environment as well as the strengths and weaknesses of key industry players. Data is qualitatively analyzed to categorize companies as pure play, category-focused, industry-focused, and diversified; it is quantitatively analyzed to categorize companies as dominant, leading, strong, tentative, and weak.

Recent Development and News in Ai in supply chain optimization market

  • In August 2025, United Parcel Service announced the launch of an AI-driven predictive maintenance system for its trucking fleet, designed to minimize vehicle downtime and reduce operational expenditures.
  • In September 2025, FedEx implemented an AI-powered route optimization solution across its North American operations, leading to tangible reductions in delivery times and fuel consumption.
  • In September 2025, IBM Japan launched its Supply Chain Ensemble, an AI-powered solution that leverages the Watsonx platform to analyze data from sales, demand, production, procurement, and logistics.
  • In September 2025, Avetta announced an expansion of its AI-powered capabilities, including a generative AI risk assistant that provides instant, context-aware answers to compliance and safety questions.

Dive into Technavio’s robust research methodology, blending expert interviews, extensive data synthesis, and validated models for unparalleled AI In Supply Chain Optimization Market insights. See full methodology.

Market Scope
Page number 309
Base year 2024
Historic period 2019-2023
Forecast period 2025-2029
Growth momentum & CAGR Accelerate at a CAGR of 28.5%
Market growth 2025-2029 USD 15885.1 million
Market structure Fragmented
YoY growth 2024-2025(%) 24.9%
Key countries US, Canada, Mexico, Germany, UK, France, Italy, The Netherlands, Spain, China, India, Japan, Australia, South Korea, Indonesia, UAE, Saudi Arabia, South Africa, Turkey, Israel, Brazil, Argentina and Colombia
Competitive landscape Leading Companies, Market Positioning of Companies, Competitive Strategies, and Industry Risks

Request Free Sample

Research Analyst Overview

  • The AI in supply chain optimization market is fundamentally reshaping enterprise operations by embedding intelligence into core processes. The adoption of technologies like machine learning models and computer vision systems is enabling unprecedented levels of warehouse automation systems and automated sorting systems. This shift facilitates proactive risk mitigation and dynamic route optimization, moving beyond static planning.
  • A critical boardroom consideration is the impact of generative AI on operational strategy, particularly regarding workforce allocation optimization and the need for new skills in human-robot collaboration. The technology is enabling functions like automated data extraction, with some logistics firms processing orders six times faster. The integration of predictive maintenance scheduling and AI-powered forecasting models delivers tangible efficiency gains.
  • Firms are creating cognitive supply chains through end-to-end supply chain visibility and real-time disruption response. This is achieved through AI-powered digital twins and logistics network optimization, all driven by real-time data analytics and autonomous planning capabilities. Ultimately, the focus is on creating resilient, agile, and cost-effective supply networks.

What are the Key Data Covered in this AI In Supply Chain Optimization Market Research and Growth Report?

  • What is the expected growth of the AI In Supply Chain Optimization Market between 2025 and 2029?

    • USD 15.89 billion, at a CAGR of 28.5%

  • What segmentation does the market report cover?

    • The report is segmented by Component (Software, Services, and Hardware), Technology (Machine learning, Computer vision, NLP, and Others), End-user (Retail and e-commerce, Manufacturing, Automotive, Healthcare, and Others) and Geography (North America, Europe, APAC, Middle East and Africa, South America)

  • Which regions are analyzed in the report?

    • North America, Europe, APAC, Middle East and Africa and South America

  • What are the key growth drivers and market challenges?

    • Increasing demand for enhanced supply chain visibility and agility, Data quality, integration, and security complexities

  • Who are the major players in the AI In Supply Chain Optimization Market?

    • Amazon Web Services Inc., Blue Yonder Group Inc., Celonis SE, Coupa Software Inc., Descartes Systems Group Inc., Fourkites Inc., Google LLC, Honeywell International Inc., Infor Inc., IBM Corp., Kinaxis Inc., Manhattan Associates Inc., Microsoft Corp., Oracle Corp., PTC Inc., SAP SE and Zebra Technologies Corp.

Market Research Insights

  • Market dynamics are increasingly shaped by the pursuit of tangible business outcomes through technology adoption. Organizations implementing predictive analytics for disruptions report up to 40% faster recovery times during crises compared to traditional methods. Similarly, the use of demand forecasting AI tools has led to improvements in forecasting accuracy of up to 87%, directly impacting inventory costs and service levels.
  • The strategic focus on improving supply chain resilience and reducing operational expenditures is evident, with some AI-driven initiatives demonstrating a potential 20% reduction in logistics costs.
  • This push for efficiency extends to workforce upskilling for AI, as companies recognize that realizing the full value of AI in warehouse management and procurement automation with AI depends on aligning human capital with new technological capabilities. The development of a supply chain control tower is also becoming a priority.

We can help! Our analysts can customize this ai in supply chain optimization market research report to meet your requirements.

Get in touch

1. Executive Summary

1.1 Market overview

Executive Summary - Chart on Market Overview
Executive Summary - Data Table on Market Overview
Executive Summary - Chart on Global Market Characteristics
Executive Summary - Chart on Market by Geography
Executive Summary - Chart on Market Segmentation by Component
Executive Summary - Chart on Market Segmentation by Technology
Executive Summary - Chart on Market Segmentation by End-user
Executive Summary - Chart on Incremental Growth
Executive Summary - Data Table on Incremental Growth
Executive Summary - Chart on Company Market Positioning

2. Technavio Analysis

2.1 Analysis of price sensitivity, lifecycle, customer purchase basket, adoption rates, and purchase criteria

2.2 Criticality of inputs and Factors of differentiation

Chart on Overview on criticality of inputs and factors of differentiation

2.3 Factors of disruption

Chart on Overview on factors of disruption

2.4 Impact of drivers and challenges

Chart on Impact of drivers and challenges in 2024 and 2029

3. Market Landscape

3.1 Market ecosystem

Chart on Parent Market
Data Table on - Parent Market

3.2 Market characteristics

Chart on Market characteristics analysis

3.3 Value chain analysis

Chart on Value chain analysis

4. Market Sizing

4.1 Market definition

Data Table on Offerings of companies included in the market definition

4.2 Market segment analysis

Market segments

4.3 Market size 2024

4.4 Market outlook: Forecast for 2024-2029

Chart on Global - Market size and forecast 2024-2029 ($ million)
Data Table on Global - Market size and forecast 2024-2029 ($ million)
Chart on Global Market: Year-over-year growth 2024-2029 (%)
Data Table on Global Market: Year-over-year growth 2024-2029 (%)

5. Historic Market Size

5.1 Global AI In Supply Chain Optimization Market 2019 - 2023

Historic Market Size - Data Table on Global AI In Supply Chain Optimization Market 2019 - 2023 ($ million)

5.2 Component segment analysis 2019 - 2023

Historic Market Size - Component Segment 2019 - 2023 ($ million)

5.3 Technology segment analysis 2019 - 2023

Historic Market Size - Technology Segment 2019 - 2023 ($ million)

5.4 End-user segment analysis 2019 - 2023

Historic Market Size - End-user Segment 2019 - 2023 ($ million)

5.5 Geography segment analysis 2019 - 2023

Historic Market Size - Geography Segment 2019 - 2023 ($ million)

5.6 Country segment analysis 2019 - 2023

Historic Market Size - Country Segment 2019 - 2023 ($ million)

6. Five Forces Analysis

6.1 Five forces summary

Five forces analysis - Comparison between 2024 and 2029

6.2 Bargaining power of buyers

Bargaining power of buyers - Impact of key factors 2024 and 2029

6.3 Bargaining power of suppliers

Bargaining power of suppliers - Impact of key factors in 2024 and 2029

6.4 Threat of new entrants

Threat of new entrants - Impact of key factors in 2024 and 2029

6.5 Threat of substitutes

Threat of substitutes - Impact of key factors in 2024 and 2029

6.6 Threat of rivalry

Threat of rivalry - Impact of key factors in 2024 and 2029

6.7 Market condition

Chart on Market condition - Five forces 2024 and 2029

7. Market Segmentation by Component

7.1 Market segments

Chart on Component - Market share 2024-2029 (%)
Data Table on Component - Market share 2024-2029 (%)

7.2 Comparison by Component

Chart on Comparison by Component
Data Table on Comparison by Component

7.3 Software - Market size and forecast 2024-2029

Chart on Software - Market size and forecast 2024-2029 ($ million)
Data Table on Software - Market size and forecast 2024-2029 ($ million)
Chart on Software - Year-over-year growth 2024-2029 (%)
Data Table on Software - Year-over-year growth 2024-2029 (%)

7.4 Services - Market size and forecast 2024-2029

Chart on Services - Market size and forecast 2024-2029 ($ million)
Data Table on Services - Market size and forecast 2024-2029 ($ million)
Chart on Services - Year-over-year growth 2024-2029 (%)
Data Table on Services - Year-over-year growth 2024-2029 (%)

7.5 Hardware - Market size and forecast 2024-2029

Chart on Hardware - Market size and forecast 2024-2029 ($ million)
Data Table on Hardware - Market size and forecast 2024-2029 ($ million)
Chart on Hardware - Year-over-year growth 2024-2029 (%)
Data Table on Hardware - Year-over-year growth 2024-2029 (%)

7.6 Market opportunity by Component

Market opportunity by Component ($ million)
Data Table on Market opportunity by Component ($ million)

8. Market Segmentation by Technology

8.1 Market segments

Chart on Technology - Market share 2024-2029 (%)
Data Table on Technology - Market share 2024-2029 (%)

8.2 Comparison by Technology

Chart on Comparison by Technology
Data Table on Comparison by Technology

8.3 Machine learning - Market size and forecast 2024-2029

Chart on Machine learning - Market size and forecast 2024-2029 ($ million)
Data Table on Machine learning - Market size and forecast 2024-2029 ($ million)
Chart on Machine learning - Year-over-year growth 2024-2029 (%)
Data Table on Machine learning - Year-over-year growth 2024-2029 (%)

8.4 Computer vision - Market size and forecast 2024-2029

Chart on Computer vision - Market size and forecast 2024-2029 ($ million)
Data Table on Computer vision - Market size and forecast 2024-2029 ($ million)
Chart on Computer vision - Year-over-year growth 2024-2029 (%)
Data Table on Computer vision - Year-over-year growth 2024-2029 (%)

8.5 NLP - Market size and forecast 2024-2029

Chart on NLP - Market size and forecast 2024-2029 ($ million)
Data Table on NLP - Market size and forecast 2024-2029 ($ million)
Chart on NLP - Year-over-year growth 2024-2029 (%)
Data Table on NLP - Year-over-year growth 2024-2029 (%)

8.6 Others - Market size and forecast 2024-2029

Chart on Others - Market size and forecast 2024-2029 ($ million)
Data Table on Others - Market size and forecast 2024-2029 ($ million)
Chart on Others - Year-over-year growth 2024-2029 (%)
Data Table on Others - Year-over-year growth 2024-2029 (%)

8.7 Market opportunity by Technology

Market opportunity by Technology ($ million)
Data Table on Market opportunity by Technology ($ million)

9. Market Segmentation by End-user

9.1 Market segments

Chart on End-user - Market share 2024-2029 (%)
Data Table on End-user - Market share 2024-2029 (%)

9.2 Comparison by End-user

Chart on Comparison by End-user
Data Table on Comparison by End-user

9.3 Retail and e-commerce - Market size and forecast 2024-2029

Chart on Retail and e-commerce - Market size and forecast 2024-2029 ($ million)
Data Table on Retail and e-commerce - Market size and forecast 2024-2029 ($ million)
Chart on Retail and e-commerce - Year-over-year growth 2024-2029 (%)
Data Table on Retail and e-commerce - Year-over-year growth 2024-2029 (%)

9.4 Manufacturing - Market size and forecast 2024-2029

Chart on Manufacturing - Market size and forecast 2024-2029 ($ million)
Data Table on Manufacturing - Market size and forecast 2024-2029 ($ million)
Chart on Manufacturing - Year-over-year growth 2024-2029 (%)
Data Table on Manufacturing - Year-over-year growth 2024-2029 (%)

9.5 Automotive - Market size and forecast 2024-2029

Chart on Automotive - Market size and forecast 2024-2029 ($ million)
Data Table on Automotive - Market size and forecast 2024-2029 ($ million)
Chart on Automotive - Year-over-year growth 2024-2029 (%)
Data Table on Automotive - Year-over-year growth 2024-2029 (%)

9.6 Healthcare - Market size and forecast 2024-2029

Chart on Healthcare - Market size and forecast 2024-2029 ($ million)
Data Table on Healthcare - Market size and forecast 2024-2029 ($ million)
Chart on Healthcare - Year-over-year growth 2024-2029 (%)
Data Table on Healthcare - Year-over-year growth 2024-2029 (%)

9.7 Others - Market size and forecast 2024-2029

Chart on Others - Market size and forecast 2024-2029 ($ million)
Data Table on Others - Market size and forecast 2024-2029 ($ million)
Chart on Others - Year-over-year growth 2024-2029 (%)
Data Table on Others - Year-over-year growth 2024-2029 (%)

9.8 Market opportunity by End-user

Market opportunity by End-user ($ million)
Data Table on Market opportunity by End-user ($ million)

10. Customer Landscape

10.1 Customer landscape overview

Analysis of price sensitivity, lifecycle, customer purchase basket, adoption rates, and purchase criteria

11. Geographic Landscape

11.1 Geographic segmentation

Chart on Market share by geography 2024-2029 (%)
Data Table on Market share by geography 2024-2029 (%)

11.2 Geographic comparison

Chart on Geographic comparison
Data Table on Geographic comparison

11.3 North America - Market size and forecast 2024-2029

Chart on North America - Market size and forecast 2024-2029 ($ million)
Data Table on North America - Market size and forecast 2024-2029 ($ million)
Chart on North America - Year-over-year growth 2024-2029 (%)
Data Table on North America - Year-over-year growth 2024-2029 (%)
Chart on Regional Comparison - North America
Data Table on Regional Comparison - North America

11.3.1 US - Market size and forecast 2024-2029

Chart on US - Market size and forecast 2024-2029 ($ million)
Data Table on US - Market size and forecast 2024-2029 ($ million)
Chart on US - Year-over-year growth 2024-2029 (%)
Data Table on US - Year-over-year growth 2024-2029 (%)

11.3.2 Canada - Market size and forecast 2024-2029

Chart on Canada - Market size and forecast 2024-2029 ($ million)
Data Table on Canada - Market size and forecast 2024-2029 ($ million)
Chart on Canada - Year-over-year growth 2024-2029 (%)
Data Table on Canada - Year-over-year growth 2024-2029 (%)

11.3.3 Mexico - Market size and forecast 2024-2029

Chart on Mexico - Market size and forecast 2024-2029 ($ million)
Data Table on Mexico - Market size and forecast 2024-2029 ($ million)
Chart on Mexico - Year-over-year growth 2024-2029 (%)
Data Table on Mexico - Year-over-year growth 2024-2029 (%)

11.4 Europe - Market size and forecast 2024-2029

Chart on Europe - Market size and forecast 2024-2029 ($ million)
Data Table on Europe - Market size and forecast 2024-2029 ($ million)
Chart on Europe - Year-over-year growth 2024-2029 (%)
Data Table on Europe - Year-over-year growth 2024-2029 (%)
Chart on Regional Comparison - Europe
Data Table on Regional Comparison - Europe

11.4.1 Germany - Market size and forecast 2024-2029

Chart on Germany - Market size and forecast 2024-2029 ($ million)
Data Table on Germany - Market size and forecast 2024-2029 ($ million)
Chart on Germany - Year-over-year growth 2024-2029 (%)
Data Table on Germany - Year-over-year growth 2024-2029 (%)

11.4.2 UK - Market size and forecast 2024-2029

Chart on UK - Market size and forecast 2024-2029 ($ million)
Data Table on UK - Market size and forecast 2024-2029 ($ million)
Chart on UK - Year-over-year growth 2024-2029 (%)
Data Table on UK - Year-over-year growth 2024-2029 (%)

11.4.3 France - Market size and forecast 2024-2029

Chart on France - Market size and forecast 2024-2029 ($ million)
Data Table on France - Market size and forecast 2024-2029 ($ million)
Chart on France - Year-over-year growth 2024-2029 (%)
Data Table on France - Year-over-year growth 2024-2029 (%)

11.4.4 Italy - Market size and forecast 2024-2029

Chart on Italy - Market size and forecast 2024-2029 ($ million)
Data Table on Italy - Market size and forecast 2024-2029 ($ million)
Chart on Italy - Year-over-year growth 2024-2029 (%)
Data Table on Italy - Year-over-year growth 2024-2029 (%)

11.4.5 The Netherlands - Market size and forecast 2024-2029

Chart on The Netherlands - Market size and forecast 2024-2029 ($ million)
Data Table on The Netherlands - Market size and forecast 2024-2029 ($ million)
Chart on The Netherlands - Year-over-year growth 2024-2029 (%)
Data Table on The Netherlands - Year-over-year growth 2024-2029 (%)

11.4.6 Spain - Market size and forecast 2024-2029

Chart on Spain - Market size and forecast 2024-2029 ($ million)
Data Table on Spain - Market size and forecast 2024-2029 ($ million)
Chart on Spain - Year-over-year growth 2024-2029 (%)
Data Table on Spain - Year-over-year growth 2024-2029 (%)

11.5 APAC - Market size and forecast 2024-2029

Chart on APAC - Market size and forecast 2024-2029 ($ million)
Data Table on APAC - Market size and forecast 2024-2029 ($ million)
Chart on APAC - Year-over-year growth 2024-2029 (%)
Data Table on APAC - Year-over-year growth 2024-2029 (%)
Chart on Regional Comparison - APAC
Data Table on Regional Comparison - APAC

11.5.1 China - Market size and forecast 2024-2029

Chart on China - Market size and forecast 2024-2029 ($ million)
Data Table on China - Market size and forecast 2024-2029 ($ million)
Chart on China - Year-over-year growth 2024-2029 (%)
Data Table on China - Year-over-year growth 2024-2029 (%)

11.5.2 India - Market size and forecast 2024-2029

Chart on India - Market size and forecast 2024-2029 ($ million)
Data Table on India - Market size and forecast 2024-2029 ($ million)
Chart on India - Year-over-year growth 2024-2029 (%)
Data Table on India - Year-over-year growth 2024-2029 (%)

11.5.3 Japan - Market size and forecast 2024-2029

Chart on Japan - Market size and forecast 2024-2029 ($ million)
Data Table on Japan - Market size and forecast 2024-2029 ($ million)
Chart on Japan - Year-over-year growth 2024-2029 (%)
Data Table on Japan - Year-over-year growth 2024-2029 (%)

11.5.4 Australia - Market size and forecast 2024-2029

Chart on Australia - Market size and forecast 2024-2029 ($ million)
Data Table on Australia - Market size and forecast 2024-2029 ($ million)
Chart on Australia - Year-over-year growth 2024-2029 (%)
Data Table on Australia - Year-over-year growth 2024-2029 (%)

11.5.5 South Korea - Market size and forecast 2024-2029

Chart on South Korea - Market size and forecast 2024-2029 ($ million)
Data Table on South Korea - Market size and forecast 2024-2029 ($ million)
Chart on South Korea - Year-over-year growth 2024-2029 (%)
Data Table on South Korea - Year-over-year growth 2024-2029 (%)

11.5.6 Indonesia - Market size and forecast 2024-2029

Chart on Indonesia - Market size and forecast 2024-2029 ($ million)
Data Table on Indonesia - Market size and forecast 2024-2029 ($ million)
Chart on Indonesia - Year-over-year growth 2024-2029 (%)
Data Table on Indonesia - Year-over-year growth 2024-2029 (%)

11.6 Middle East and Africa - Market size and forecast 2024-2029

Chart on Middle East and Africa - Market size and forecast 2024-2029 ($ million)
Data Table on Middle East and Africa - Market size and forecast 2024-2029 ($ million)
Chart on Middle East and Africa - Year-over-year growth 2024-2029 (%)
Data Table on Middle East and Africa - Year-over-year growth 2024-2029 (%)
Chart on Regional Comparison - Middle East and Africa
Data Table on Regional Comparison - Middle East and Africa

11.6.1 UAE - Market size and forecast 2024-2029

Chart on UAE - Market size and forecast 2024-2029 ($ million)
Data Table on UAE - Market size and forecast 2024-2029 ($ million)
Chart on UAE - Year-over-year growth 2024-2029 (%)
Data Table on UAE - Year-over-year growth 2024-2029 (%)

11.6.2 Saudi Arabia - Market size and forecast 2024-2029

Chart on Saudi Arabia - Market size and forecast 2024-2029 ($ million)
Data Table on Saudi Arabia - Market size and forecast 2024-2029 ($ million)
Chart on Saudi Arabia - Year-over-year growth 2024-2029 (%)
Data Table on Saudi Arabia - Year-over-year growth 2024-2029 (%)

11.6.3 South Africa - Market size and forecast 2024-2029

Chart on South Africa - Market size and forecast 2024-2029 ($ million)
Data Table on South Africa - Market size and forecast 2024-2029 ($ million)
Chart on South Africa - Year-over-year growth 2024-2029 (%)
Data Table on South Africa - Year-over-year growth 2024-2029 (%)

11.6.4 Turkey - Market size and forecast 2024-2029

Chart on Turkey - Market size and forecast 2024-2029 ($ million)
Data Table on Turkey - Market size and forecast 2024-2029 ($ million)
Chart on Turkey - Year-over-year growth 2024-2029 (%)
Data Table on Turkey - Year-over-year growth 2024-2029 (%)

11.6.5 Israel - Market size and forecast 2024-2029

Chart on Israel - Market size and forecast 2024-2029 ($ million)
Data Table on Israel - Market size and forecast 2024-2029 ($ million)
Chart on Israel - Year-over-year growth 2024-2029 (%)
Data Table on Israel - Year-over-year growth 2024-2029 (%)

11.7 South America - Market size and forecast 2024-2029

Chart on South America - Market size and forecast 2024-2029 ($ million)
Data Table on South America - Market size and forecast 2024-2029 ($ million)
Chart on South America - Year-over-year growth 2024-2029 (%)
Data Table on South America - Year-over-year growth 2024-2029 (%)
Chart on Regional Comparison - South America
Data Table on Regional Comparison - South America

11.7.1 Brazil - Market size and forecast 2024-2029

Chart on Brazil - Market size and forecast 2024-2029 ($ million)
Data Table on Brazil - Market size and forecast 2024-2029 ($ million)
Chart on Brazil - Year-over-year growth 2024-2029 (%)
Data Table on Brazil - Year-over-year growth 2024-2029 (%)

11.7.2 Argentina - Market size and forecast 2024-2029

Chart on Argentina - Market size and forecast 2024-2029 ($ million)
Data Table on Argentina - Market size and forecast 2024-2029 ($ million)
Chart on Argentina - Year-over-year growth 2024-2029 (%)
Data Table on Argentina - Year-over-year growth 2024-2029 (%)

11.7.3 Colombia - Market size and forecast 2024-2029

Chart on Colombia - Market size and forecast 2024-2029 ($ million)
Data Table on Colombia - Market size and forecast 2024-2029 ($ million)
Chart on Colombia - Year-over-year growth 2024-2029 (%)
Data Table on Colombia - Year-over-year growth 2024-2029 (%)

11.8 Market opportunity by geography

Market opportunity by geography ($ million)
Data Tables on Market opportunity by geography ($ million)

12. Drivers, Challenges, and Opportunity

12.1 Market drivers

Increasing demand for enhanced supply chain visibility and agility
Imperative to reduce operational costs and improve efficiency
Rapid advancements in AI technologies and data analytics capabilities

12.2 Market challenges

Data quality, integration, and security complexities
High implementation costs and demonstrating return on investment
Pervasive talent shortage and workforce skills gap

12.3 Impact of drivers and challenges

Impact of drivers and challenges in 2024 and 2029

12.4 Market opportunities

Proliferation of generative AI in supply chain operations
Advanced predictive analytics for enhanced supply chain resilience
Rise of AI-powered digital twins for end-to-end visibility

13. Competitive Landscape

13.1 Overview

13.2

Overview on criticality of inputs and factors of differentiation

13.3 Landscape disruption

Overview on factors of disruption

13.4 Industry risks

Impact of key risks on business

14. Competitive Analysis

14.1 Companies profiled

Companies covered

14.2 Company ranking index

14.3 Market positioning of companies

Matrix on companies position and classification

14.4 Amazon Web Services Inc.

Amazon Web Services Inc. - Overview
Amazon Web Services Inc. - Product / Service
Amazon Web Services Inc. - Key news
Amazon Web Services Inc. - Key offerings
SWOT

14.5 Blue Yonder Group Inc.

Blue Yonder Group Inc. - Overview
Blue Yonder Group Inc. - Product / Service
Blue Yonder Group Inc. - Key offerings
SWOT

14.6 Celonis SE

Celonis SE - Overview
Celonis SE - Product / Service
Celonis SE - Key offerings
SWOT

14.7 Coupa Software Inc.

Coupa Software Inc. - Overview
Coupa Software Inc. - Product / Service
Coupa Software Inc. - Key offerings
SWOT

14.8 Descartes Systems Group Inc.

Descartes Systems Group Inc. - Overview
Descartes Systems Group Inc. - Product / Service
Descartes Systems Group Inc. - Key offerings
SWOT

14.9 Google LLC

Google LLC - Overview
Google LLC - Product / Service
Google LLC - Key offerings
SWOT

14.10 Honeywell International Inc.

Honeywell International Inc. - Overview
Honeywell International Inc. - Business segments
Honeywell International Inc. - Key news
Honeywell International Inc. - Key offerings
Honeywell International Inc. - Segment focus
SWOT

14.11 Infor Inc.

Infor Inc. - Overview
Infor Inc. - Product / Service
Infor Inc. - Key news
Infor Inc. - Key offerings
SWOT

14.12 IBM Corp.

IBM Corp. - Overview
IBM Corp. - Business segments
IBM Corp. - Key news
IBM Corp. - Key offerings
IBM Corp. - Segment focus
SWOT

14.13 Kinaxis Inc.

Kinaxis Inc. - Overview
Kinaxis Inc. - Product / Service
Kinaxis Inc. - Key news
Kinaxis Inc. - Key offerings
SWOT

14.14 Manhattan Associates Inc.

Manhattan Associates Inc. - Overview
Manhattan Associates Inc. - Business segments
Manhattan Associates Inc. - Key news
Manhattan Associates Inc. - Key offerings
Manhattan Associates Inc. - Segment focus
SWOT

14.15 Microsoft Corp.

Microsoft Corp. - Overview
Microsoft Corp. - Business segments
Microsoft Corp. - Key news
Microsoft Corp. - Key offerings
Microsoft Corp. - Segment focus
SWOT

14.16 Oracle Corp.

Oracle Corp. - Overview
Oracle Corp. - Business segments
Oracle Corp. - Key news
Oracle Corp. - Key offerings
Oracle Corp. - Segment focus
SWOT

14.17 SAP SE

SAP SE - Overview
SAP SE - Business segments
SAP SE - Key news
SAP SE - Key offerings
SAP SE - Segment focus
SWOT

14.18 Zebra Technologies Corp.

Zebra Technologies Corp. - Overview
Zebra Technologies Corp. - Business segments
Zebra Technologies Corp. - Key news
Zebra Technologies Corp. - Key offerings
Zebra Technologies Corp. - Segment focus
SWOT

15. Appendix

15.1 Scope of the report

Market definition
Objectives
Notes and caveats

15.2 Inclusions and exclusions checklist

Inclusions checklist
Exclusions checklist

15.3 Currency conversion rates for US$

15.4 Research methodology

15.5 Data procurement

Information sources

15.6 Data validation

15.7 Validation techniques employed for market sizing

15.8 Data synthesis

15.9 360 degree market analysis

15.10 List of abbreviations

Research Methodology

Technavio presents a detailed picture of the market by way of study, synthesis, and summation of data from multiple sources. The analysts have presented the various facets of the market with a particular focus on identifying the key industry influencers. The data thus presented is comprehensive, reliable, and the result of extensive research, both primary and secondary.

INFORMATION SOURCES

Primary sources

  • Manufacturers and suppliers
  • Channel partners
  • Industry experts
  • Strategic decision makers

Secondary sources

  • Industry journals and periodicals
  • Government data
  • Financial reports of key industry players
  • Historical data
  • Press releases

DATA ANALYSIS

Data Synthesis

  • Collation of data
  • Estimation of key figures
  • Analysis of derived insights

Data Validation

  • Triangulation with data models
  • Reference against proprietary databases
  • Corroboration with industry experts

REPORT WRITING

Qualitative

  • Market drivers
  • Market challenges
  • Market trends
  • Five forces analysis

Quantitative

  • Market size and forecast
  • Market segmentation
  • Geographical insights
  • Competitive landscape

Interested in this report?

Get your sample now to see our research methodology and insights!

Download Now

Frequently Asked Questions

AI In Supply Chain Optimization market growth will increase by USD 15885.1 million during 2025-2029.

The AI In Supply Chain Optimization market is expected to grow at a CAGR of 28.5% during 2025-2029.

AI In Supply Chain Optimization market is segmented by Component (Software, Services, Hardware) Technology (Machine learning, Computer vision, NLP, Others) End-user (Retail and e-commerce, Manufacturing, Automotive, Healthcare, Others)

Amazon Web Services Inc., Blue Yonder Group Inc., Celonis SE, Coupa Software Inc., Descartes Systems Group Inc., Fourkites Inc., Google LLC, Honeywell International Inc., Infor Inc., IBM Corp., Kinaxis Inc., Manhattan Associates Inc., Microsoft Corp., Oracle Corp., PTC Inc., SAP SE, Zebra Technologies Corp. are a few of the key vendors in the AI In Supply Chain Optimization market.

North America will register the highest growth rate of 34.6% among the other regions. Therefore, the AI In Supply Chain Optimization market in North America is expected to garner significant business opportunities for the vendors during the forecast period.

US, Canada, Mexico, Germany, UK, France, Italy, The Netherlands, Spain, China, India, Japan, Australia, South Korea, Indonesia, UAE, Saudi Arabia, South Africa, Turkey, Israel, Brazil, Argentina, Colombia

  • Increasing demand for enhanced supply chain visibility and agility is the driving factor this market.

The AI In Supply Chain Optimization market vendors should focus on grabbing business opportunities from the Component segment as it accounted for the largest market share in the base year.