AI Inference Hardware Market Analysis, Size, and Forecast 2026-2030: North America (US, Canada, and Mexico), Europe (Germany, UK, and France), APAC (China, Japan, and India), Middle East and Africa (UAE, Saudi Arabia, and Israel), South America (Brazil, Argentina, and Chile), and Rest of World (ROW)

AI Inference Hardware Market Analysis, Size, and Forecast 2026-2030:
North America (US, Canada, and Mexico), Europe (Germany, UK, and France), APAC (China, Japan, and India), Middle East and Africa (UAE, Saudi Arabia, and Israel), South America (Brazil, Argentina, and Chile), and Rest of World (ROW)

Published: May 2026 314 Pages SKU: IRTNTR81376

Market Overview at a Glance

$106.25 B
Market Opportunity
20.8%
CAGR 2025 - 2030
39.8%
North America Growth
$30.79 B
GPU segment 2024

Ai Inference Hardware Market Size and Growth Forecast 2026-2030

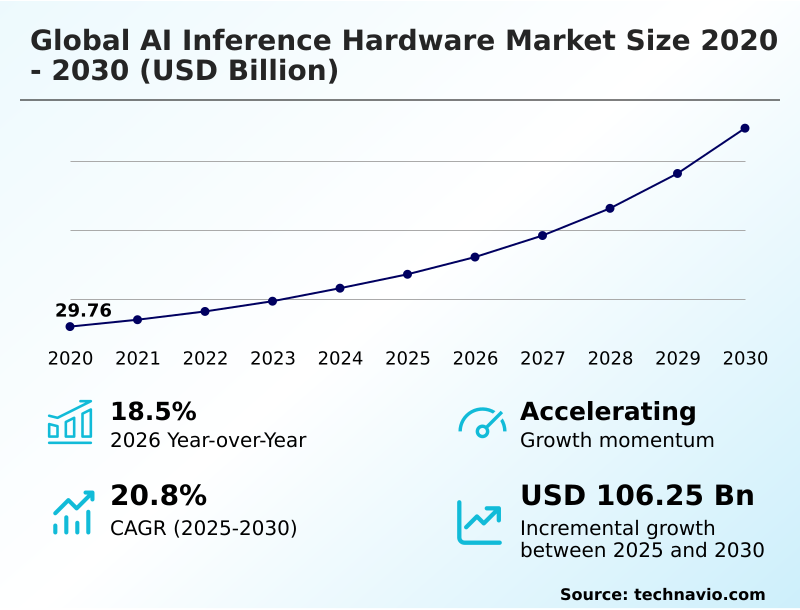
The Ai Inference Hardware Market size was valued at USD 67.80 billion in 2025 growing at a CAGR of 20.8% during the forecast period 2026-2030.

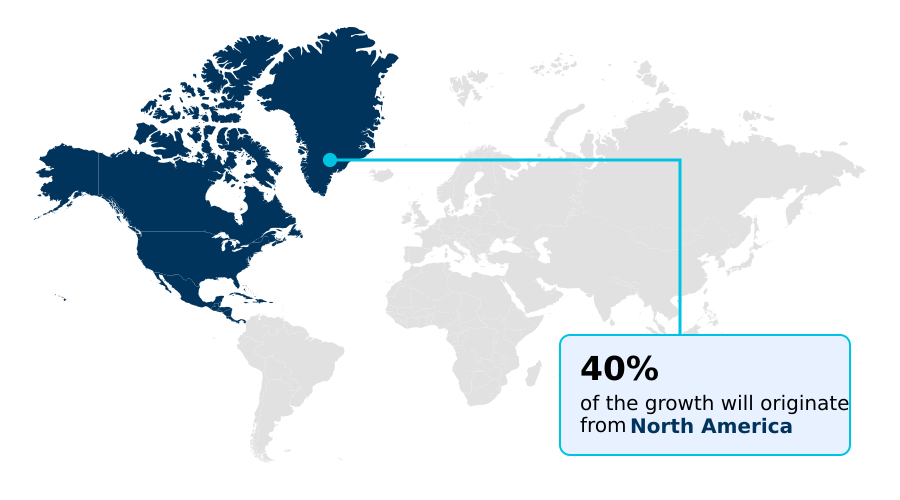
North America accounts for 39.8% of incremental growth during the forecast period. The GPU segment by Type was valued at USD 30.79 billion in 2024, while the Cloud inference segment holds the largest revenue share by Deployment.

The market is projected to grow by USD 144.29 billion from 2020 to 2030, with USD 106.25 billion of the growth expected during the forecast period of 2025 to 2030.

Get Key Insights on Market Forecast (PDF) Request Free Sample

Ai Inference Hardware Market Overview

The AI inference hardware market is defined by the escalating need for specialized processors that can execute complex machine learning models with high efficiency and low latency. This demand is driven by the proliferation of applications requiring real-time data analysis, from industrial automation to autonomous systems. In a typical smart factory deployment, for instance, computer vision systems powered by edge AI processor designs are used for in-line quality inspection, where low-latency inference solutions are critical for identifying defects on a high-speed production line without causing bottlenecks. This shift toward localized processing is a global phenomenon, with North America contributing to nearly 39.8% of the market's incremental growth, largely due to investments by hyperscale data centers and technology leaders in custom silicon for AI. The development of power-efficient AI chips and advancements in AI hardware acceleration are crucial for supporting these deployments, enabling organizations to scale their AI capabilities from the cloud to the edge while managing operational costs and energy consumption.

Drivers, Trends, and Challenges in the Ai Inference Hardware Market

Strategic decisions regarding AI infrastructure are increasingly centered on balancing the total cost of AI inference hardware against performance and future-proofing against algorithmic shifts. For data center operators, evaluating the energy consumption of AI hardware is a critical step toward achieving compliance with energy management standards like ISO 50001 and developing sustainable AI computing hardware.

The choice between on-premises vs cloud AI inference often dictates the hardware selection process, where factors like the impact of the memory wall on AI and the need for AI hardware for real-time applications come into play.

A typical evaluation in a financial services firm might compare deploying Intel Gaudi for enterprise AI against a custom on-premises cluster using FPGA for low-latency AI tasks to process real-time transaction data.

This decision is complicated by challenges in AI hardware design, as the debate of NVIDIA vs AMD for AI inference is now broadened by the rise of specialized solutions. Companies are now exploring chiplet architectures for AI processors and the potential of silicon photonics in AI hardware to overcome performance bottlenecks.

Optimizing ASICs for neural networks remains a viable strategy for large-scale, static workloads, but it represents a significant upfront investment and risk if the underlying models evolve.

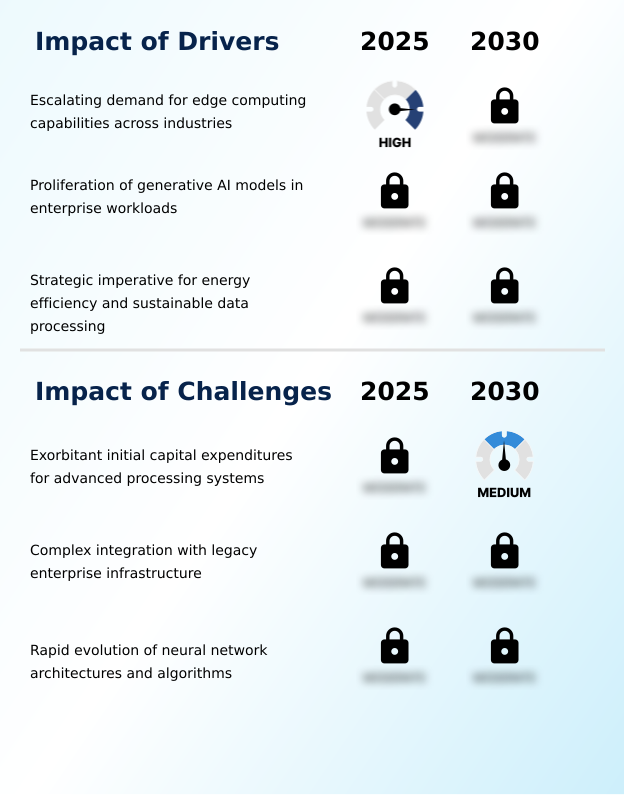
Primary Growth Driver: The escalating demand for edge computing capabilities across various industries serves as a key driver for the market's expansion.

The market's robust 18.5% year-over-year growth is propelled by three primary forces. First, the escalating demand for edge computing is pushing processing capabilities closer to data sources to enable low-latency applications in sectors like industrial automation and autonomous systems.

This requires a new class of low-power AI vision and processing hardware. Second, the widespread integration of generative AI into enterprise workflows has created an insatiable demand for high-throughput inference servers capable of running large language models efficiently.

Finally, a strategic imperative for sustainability is forcing a transition toward more power-efficient AI chips and data center AI hardware, as organizations seek to reduce the spiraling energy costs and environmental impact associated with large-scale AI deployments.

Emerging Market Trend: A primary market trend is the accelerated shift toward application-specific integrated circuits, which are increasingly favored for their efficiency in dedicated inference workloads.

Key market trends are centered on achieving greater efficiency and modularity in AI hardware design. The accelerated shift toward application specific integrated circuits continues as organizations prioritize performance-per-watt for large-scale inference deployments.

This is complemented by the growing adoption of chiplet based architectures, which allows for more flexible and cost-effective silicon design by combining different process nodes in a single package. This move towards heterogeneous computing for AI is crucial for optimizing performance for specific tasks.

Furthermore, to address the persistent data transfer limitations known as the memory wall, the industry is increasingly integrating silicon photonics and co-packaged optics. This technology uses light to transmit data, enabling significantly higher bandwidth and lower power consumption, which is critical for scaling high-performance AI workloads in data centers.

Key Industry Challenge: Exorbitant initial capital expenditures required for procuring advanced processing systems present a key challenge affecting industry-wide adoption and growth.

Significant challenges constrain market growth, beginning with the high initial cost of AI inference hardware, which is a major barrier for many enterprises, as reflected by the high criticality of R&D and Capex in the industry. Beyond procurement, the complex process of AI hardware and software co-design and integration into legacy IT environments creates significant operational friction.

The AI hardware supply chain also presents risks related to component availability and geopolitical factors. Perhaps the most persistent challenge is the rapid evolution of AI processor architecture. The constant emergence of new neural network models creates a risk of hardware obsolescence, forcing a difficult balance between designing highly optimized, specialized chips and more flexible, future-proof platforms.

Explore Full Market Dynamics Analysis Request Free Sample

Ai Inference Hardware Market Segmentation

The ai inference hardware industry research report provides comprehensive data including region-wise segment analysis, with forecasts and analysis for the period 2026-2030, as well as historical data from 2020-2024 for the following segments.

Market Segment by Type
  • GPU
  • CPU
  • ASIC
  • FPGA
  • Others
Market Segment by Deployment
  • Cloud inference
  • Edge inference
  • On-premises
Market Segment by Application
  • Computer vision
  • Robotics
  • Generative AI
  • NLP
  • Others
Market Segment by Geography
North America
US, Canada, Mexico
Europe
Germany, UK, France, The Netherlands, Sweden, Spain
APAC
China, Japan, India, South Korea, Taiwan, Indonesia
Middle East and Africa
UAE, Saudi Arabia, Israel, South Africa, Qatar
South America
Brazil, Argentina, Chile

Type Segment Analysis

The gpu segment is estimated to witness significant growth during the forecast period.

Graphics processing units represent the foundational hardware for computational inference, with their highly parallel structure being ideal for deep learning inference.

These processors, featuring specialized tensor core GPUs and high bandwidth memory, are optimized for inference workloads by accelerating lower-precision mathematics. The mature software ecosystem surrounding these processors provides a significant competitive advantage, enabling rapid deployment from research to production.

Data centers rely on these accelerators to serve massive language models and complex computer vision systems. While procurement costs are high, the throughput for large batch sizes justifies the investment for hyperscale providers.

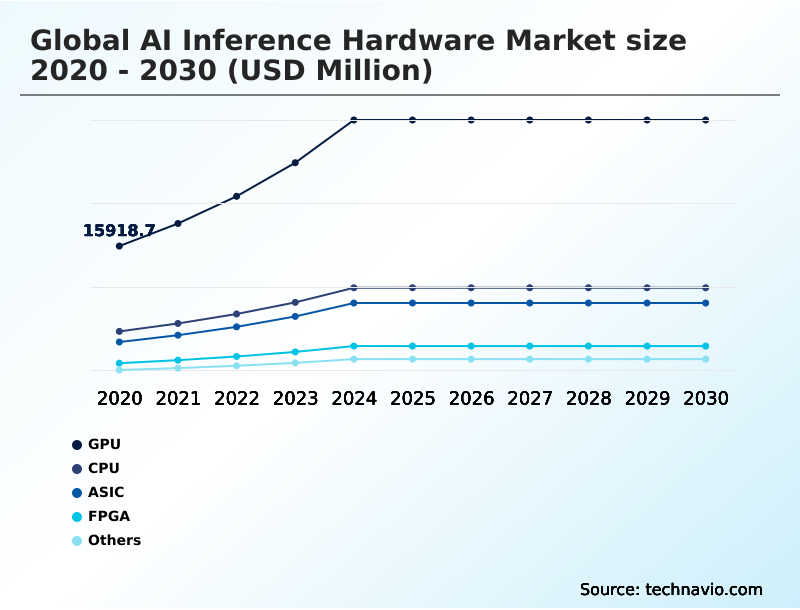
This segment's dominance is reflected in its market value, accounting for USD 25804.9 in 2025, underscoring its critical role in the AI hardware ecosystem.

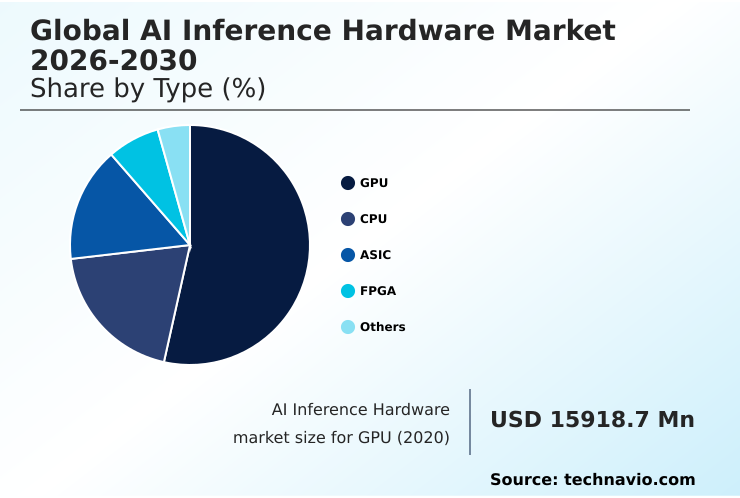
The GPU segment was valued at USD 30.79 billion in 2024 and showed a gradual increase during the forecast period.

Ai Inference Hardware Market by Region: North America Leads with 39.8% Growth Share

North America is estimated to contribute 39.8% to the growth of the global market during the forecast period.

The geographic landscape of the AI inference hardware market is characterized by distinct regional specializations and growth drivers.

North America currently leads, contributing 39.8% of the market's incremental growth, primarily fueled by massive investments in data center AI hardware by hyperscale cloud providers.

In contrast, the APAC region is projected to have the highest CAGR of 21.7%, driven by its dominance in semiconductor manufacturing and the widespread integration of AI in telecommunications and smart city infrastructure.

Meanwhile, Europe's market is heavily influenced by data privacy regulations such as GDPR, which promotes the adoption of on-device AI processing and localized compute solutions to ensure data sovereignty.

This regulatory pressure, combined with a strong industrial automation sector, fosters a growing demand for edge-focused hardware solutions across the continent.

Customer Landscape Analysis for the Ai Inference Hardware Market

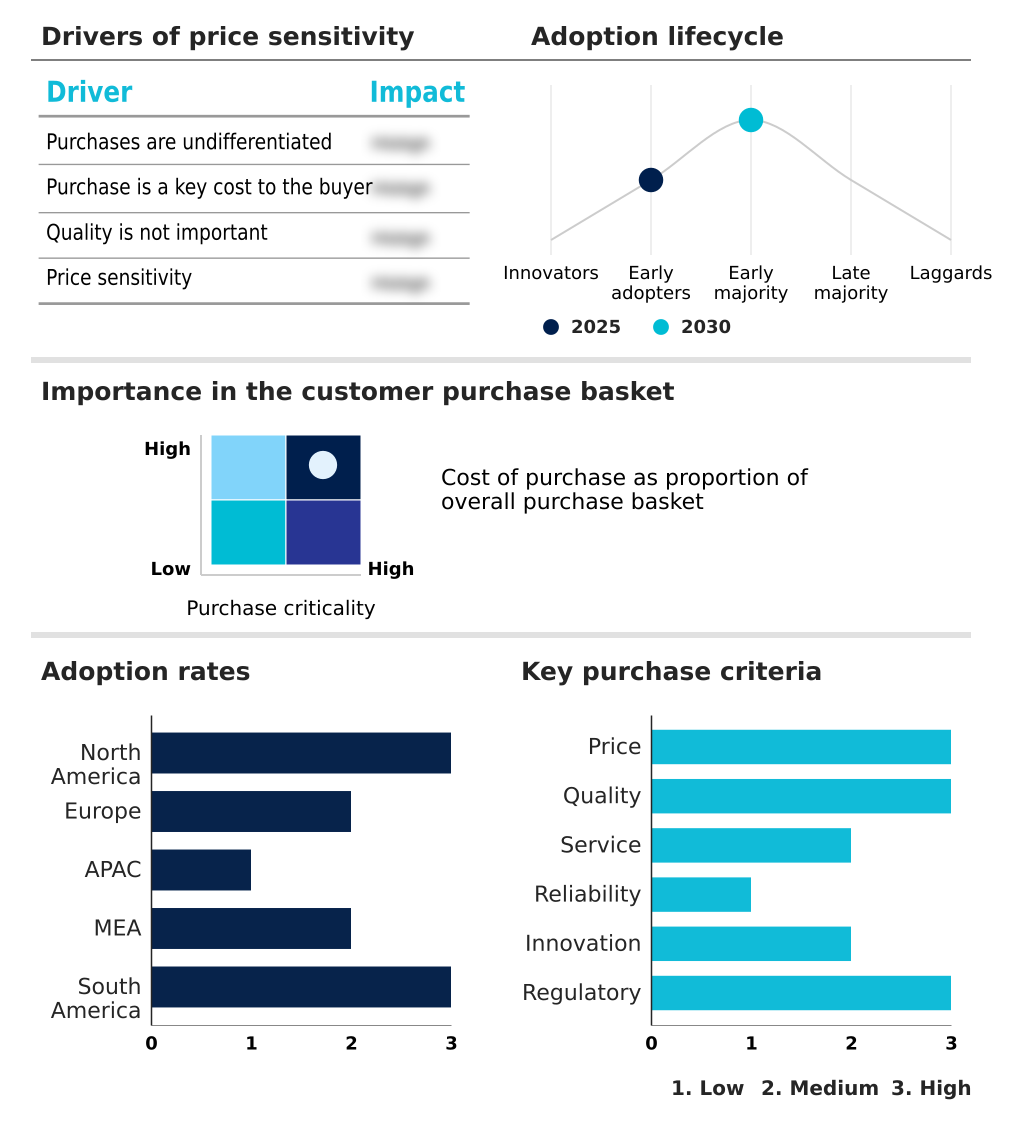
The ai inference hardware market forecasting report includes the adoption lifecycle of the market, covering from the innovator’s stage to the laggard’s stage. It focuses on adoption rates in different regions based on penetration. Furthermore, the ai inference hardware market report also includes key purchase criteria and drivers of price sensitivity to help companies evaluate and develop their market growth analysis strategies.

Competitive Landscape of the Ai Inference Hardware Market

Companies are implementing various strategies, such as strategic alliances, partnerships, mergers and acquisitions, geographical expansion, and product/service launches, to enhance their presence in the ai inference hardware market industry.

Advanced Micro Devices Inc. - The company's offerings include a range of AI inference hardware, from advanced accelerators and adaptive compute cards to specialized AI processors for diverse applications.

The industry research and growth report includes detailed analyses of the competitive landscape of the market and information about key companies, including:

  • Advanced Micro Devices Inc.
  • Amazon.com Inc.
  • Apple Inc.
  • Arm Ltd.
  • Cerebras
  • Google LLC
  • Groq Inc.
  • Hailo Technologies Ltd.
  • IBM Corp.
  • Intel Corp.
  • Kneron Inc.
  • MediaTek Inc.
  • NVIDIA Corp.
  • NXP Semiconductors NV
  • Qualcomm Inc.
  • SambaNova Systems Inc.
  • SiMa Technologies Inc.
  • STMicroelectronics NV
  • Syntiant Corp.
  • Tenstorrent Inc.

Qualitative and quantitative analysis of companies has been conducted to help clients understand the wider business environment as well as the strengths and weaknesses of key industry players. Data is qualitatively analyzed to categorize companies as pure play, category-focused, industry-focused, and diversified; it is quantitatively analyzed to categorize companies as dominant, leading, strong, tentative, and weak.

Recent Developments in the Ai Inference Hardware Market

  • In May 2025, AMD Inc. and OpenAI announced a strategic partnership aimed at significantly scaling AI infrastructure capacity through the deployment of up to 6 gigawatts of AMD GPU-based compute systems.
  • In April 2025, NVIDIA Corp. and Intel Corp. announced a strategic collaboration to co-develop multiple generations of custom data center and PC products designed to accelerate computing workloads across hyperscale, enterprise, and consumer markets.
  • In February 2025, Qualcomm Inc. announced the introduction of its next-generation AI inference-optimized solutions for data centers, including the Qualcomm AI200 and AI250 chip-based accelerator cards and rack-scale systems.
  • In January 2025, Dell Technologies introduced the PowerEdge XE8712 server, positioning it as a high-density AI infrastructure solution for complex workloads.

Research Analyst Overview: Ai Inference Hardware Market

The market is undergoing a fundamental transition away from reliance on general-purpose hardware toward a more fragmented and specialized landscape. Boardroom decisions now involve complex trade-offs between the flexibility of graphics processing units and the superior total cost of ownership offered by application specific integrated circuits for high-volume workloads.

This strategic calculus is further complicated by supply chain considerations influenced by trade policies governing advanced semiconductor exports. The adoption of chiplet based architectures and advanced packaging techniques is lowering the barrier to entry for custom silicon, enabling more companies to develop bespoke solutions.

As a result, the market is seeing a proliferation of novel designs, including reconfigurable dataflow units and RISC-V-based AI accelerators. This trend is happening alongside the development of next-generation technologies like co-packaged optics and neuromorphic computing, which promise to address long-term bottlenecks in data movement and power consumption.

While GPUs still dominate in terms of market value, the faster growth of custom and specialized hardware signals a clear directional shift for procurement strategies.

Dive into Technavio’s robust research methodology, blending expert interviews, extensive data synthesis, and validated models for unparalleled Ai Inference Hardware Market insights. See full methodology.

Request Free Sample

Market Scope
Page number 314
Base year 2025
Historic period 2020-2024
Forecast period 2026-2030
Growth momentum & CAGR Accelerate at a CAGR of 20.8%
Market growth 2026-2030 USD 106251.6 million
Market structure Fragmented
YoY growth 2025-2026(%) 18.5%
Key countries US, Canada, Mexico, Germany, UK, France, The Netherlands, Sweden, Spain, China, Japan, India, South Korea, Taiwan, Indonesia, UAE, Saudi Arabia, Israel, South Africa, Qatar, Brazil, Argentina and Chile
Competitive landscape Leading Companies, Market Positioning of Companies, Competitive Strategies, and Industry Risks

Ai Inference Hardware Market: Key Questions Answered in This Report

  • What is the expected growth of the Ai Inference Hardware Market between 2026 and 2030?

    • The Ai Inference Hardware Market is expected to grow by USD 106.25 billion during 2026-2030, registering a CAGR of 20.8%. Year-over-year growth in 2026 is estimated at 18.5%%. This acceleration is shaped by escalating demand for edge computing capabilities across industries, which is intensifying demand across multiple end-use verticals covered in the report.

  • What segmentation does the market report cover?

    • The report is segmented by Type (GPU, CPU, ASIC, FPGA, and Others), Deployment (Cloud inference, Edge inference, and On-premises), Application (Computer vision, Robotics, Generative AI, NLP, and Others) and Geography (North America, Europe, APAC, Middle East and Africa, South America). Among these, the GPU segment is estimated to witness significant growth during the forecast period, driven by rising adoption across key application areas. Each segment includes detailed qualitative and quantitative analysis, along with historical data from 2020-2024 and forecasts through 2030 with year-over-year growth rates.

  • Which regions are analyzed in the report?

    • The report covers North America, Europe, APAC, Middle East and Africa and South America. North America is estimated to contribute 39.8% to market growth during the forecast period. Country-level analysis includes US, Canada, Mexico, Germany, UK, France, The Netherlands, Sweden, Spain, China, Japan, India, South Korea, Taiwan, Indonesia, UAE, Saudi Arabia, Israel, South Africa, Qatar, Brazil, Argentina and Chile, with dedicated market size tables and year-over-year growth for each.

  • What are the key growth drivers and market challenges?

    • The primary driver is escalating demand for edge computing capabilities across industries, which is accelerating investment and industry demand. The main challenge is exorbitant initial capital expenditures for advanced processing systems , creating operational barriers for key market participants. The report quantifies the impact of each driver and challenge across 2026 and 2030 with comparative analysis.

  • Who are the major players in the Ai Inference Hardware Market?

    • Key vendors include Advanced Micro Devices Inc., Amazon.com Inc., Apple Inc., Arm Ltd., Cerebras, Google LLC, Groq Inc., Hailo Technologies Ltd., IBM Corp., Intel Corp., Kneron Inc., MediaTek Inc., NVIDIA Corp., NXP Semiconductors NV, Qualcomm Inc., SambaNova Systems Inc., SiMa Technologies Inc., STMicroelectronics NV, Syntiant Corp. and Tenstorrent Inc.. The report provides qualitative and quantitative analysis categorizing companies as dominant, leading, strong, tentative, and weak based on their market positioning. Company profiles include business segment analysis, SWOT assessment, key offerings, and recent strategic developments.

Ai Inference Hardware Market Research Insights

Market dynamics are increasingly shaped by the complex interplay between deployment strategies and the AI hardware supply chain. The necessity for data sovereignty, governed by frameworks like GDPR, is compelling enterprises to adopt on-premises and edge solutions over purely cloud-based inference as a service (IaaS).

This trend is particularly evident in the automotive sector, where AI hardware for automotive systems requires localized processing for safety-critical functions. This shift influences the demand for different types of semiconductor for AI, with the growth of ASICs outpacing GPUs, reflecting a move toward workload-specific optimization.

As a result, procurement decisions are becoming more nuanced, balancing the flexibility of general-purpose hardware against the superior performance-per-watt of custom-designed chips for specific, high-volume inference tasks.

We can help! Our analysts can customize this ai inference hardware market research report to meet your requirements.

Get in touch

1. Executive Summary

1.1 Market overview

Executive Summary - Chart on Market Overview
Executive Summary - Data Table on Market Overview
Executive Summary - Chart on Global Market Characteristics
Executive Summary - Chart on Market by Geography
Executive Summary - Chart on Market Segmentation by Type
Executive Summary - Chart on Market Segmentation by Deployment
Executive Summary - Chart on Market Segmentation by Application
Executive Summary - Chart on Incremental Growth
Executive Summary - Data Table on Incremental Growth
Executive Summary - Chart on Company Market Positioning

2. Technavio Analysis

2.1 Analysis of price sensitivity, lifecycle, customer purchase basket, adoption rates, and purchase criteria

2.2 Criticality of inputs and Factors of differentiation

Chart on Overview on criticality of inputs and factors of differentiation

2.3 Factors of disruption

Chart on Overview on factors of disruption

2.4 Impact of drivers and challenges

Chart on Impact of drivers and challenges in 2025 and 2030

3. Market Landscape

3.1 Market ecosystem

Chart on Parent Market
Data Table on - Parent Market

3.2 Market characteristics

Chart on Market characteristics analysis

3.3 Value chain analysis

Chart on Value chain analysis

4. Market Sizing

4.1 Market definition

Data Table on Offerings of companies included in the market definition

4.2 Market segment analysis

Market segments

4.3 Market size 2025

4.4 Market outlook: Forecast for 2025-2030

Chart on Global - Market size and forecast 2025-2030 ($ million)
Data Table on Global - Market size and forecast 2025-2030 ($ million)
Chart on Global Market: Year-over-year growth 2025-2030 (%)
Data Table on Global Market: Year-over-year growth 2025-2030 (%)

5. Historic Market Size

5.1 Global AI Inference Hardware Market 2020 - 2024

Historic Market Size - Data Table on Global AI Inference Hardware Market 2020 - 2024 ($ million)

5.2 Type segment analysis 2020 - 2024

Historic Market Size - Type Segment 2020 - 2024 ($ million)

5.3 Deployment segment analysis 2020 - 2024

Historic Market Size - Deployment Segment 2020 - 2024 ($ million)

5.4 Application segment analysis 2020 - 2024

Historic Market Size - Application Segment 2020 - 2024 ($ million)

5.5 Geography segment analysis 2020 - 2024

Historic Market Size - Geography Segment 2020 - 2024 ($ million)

5.6 Country segment analysis 2020 - 2024

Historic Market Size - Country Segment 2020 - 2024 ($ million)

6. Qualitative Analysis

6.1 Impact of Geopolitical Conflicts on Global AI inference hardware Market

7. Five Forces Analysis

7.1 Five forces summary

Five forces analysis - Comparison between 2025 and 2030

7.2 Bargaining power of buyers

Bargaining power of buyers - Impact of key factors 2025 and 2030

7.3 Bargaining power of suppliers

Bargaining power of suppliers - Impact of key factors in 2025 and 2030

7.4 Threat of new entrants

Threat of new entrants - Impact of key factors in 2025 and 2030

7.5 Threat of substitutes

Threat of substitutes - Impact of key factors in 2025 and 2030

7.6 Threat of rivalry

Threat of rivalry - Impact of key factors in 2025 and 2030

7.7 Market condition

Chart on Market condition - Five forces 2025 and 2030

8. Market Segmentation by Type

8.1 Market segments

Chart on Type - Market share 2025-2030 (%)
Data Table on Type - Market share 2025-2030 (%)

8.2 Comparison by Type

Chart on Comparison by Type
Data Table on Comparison by Type

8.3 GPU - Market size and forecast 2025-2030

Chart on GPU - Market size and forecast 2025-2030 ($ million)
Data Table on GPU - Market size and forecast 2025-2030 ($ million)
Chart on GPU - Year-over-year growth 2025-2030 (%)
Data Table on GPU - Year-over-year growth 2025-2030 (%)

8.4 CPU - Market size and forecast 2025-2030

Chart on CPU - Market size and forecast 2025-2030 ($ million)
Data Table on CPU - Market size and forecast 2025-2030 ($ million)
Chart on CPU - Year-over-year growth 2025-2030 (%)
Data Table on CPU - Year-over-year growth 2025-2030 (%)

8.5 ASIC - Market size and forecast 2025-2030

Chart on ASIC - Market size and forecast 2025-2030 ($ million)
Data Table on ASIC - Market size and forecast 2025-2030 ($ million)
Chart on ASIC - Year-over-year growth 2025-2030 (%)
Data Table on ASIC - Year-over-year growth 2025-2030 (%)

8.6 FPGA - Market size and forecast 2025-2030

Chart on FPGA - Market size and forecast 2025-2030 ($ million)
Data Table on FPGA - Market size and forecast 2025-2030 ($ million)
Chart on FPGA - Year-over-year growth 2025-2030 (%)
Data Table on FPGA - Year-over-year growth 2025-2030 (%)

8.7 Others - Market size and forecast 2025-2030

Chart on Others - Market size and forecast 2025-2030 ($ million)
Data Table on Others - Market size and forecast 2025-2030 ($ million)
Chart on Others - Year-over-year growth 2025-2030 (%)
Data Table on Others - Year-over-year growth 2025-2030 (%)

8.8 Market opportunity by Type

Market opportunity by Type ($ million)
Data Table on Market opportunity by Type ($ million)

9. Market Segmentation by Deployment

9.1 Market segments

Chart on Deployment - Market share 2025-2030 (%)
Data Table on Deployment - Market share 2025-2030 (%)

9.2 Comparison by Deployment

Chart on Comparison by Deployment
Data Table on Comparison by Deployment

9.3 Cloud inference - Market size and forecast 2025-2030

Chart on Cloud inference - Market size and forecast 2025-2030 ($ million)
Data Table on Cloud inference - Market size and forecast 2025-2030 ($ million)
Chart on Cloud inference - Year-over-year growth 2025-2030 (%)
Data Table on Cloud inference - Year-over-year growth 2025-2030 (%)

9.4 Edge inference - Market size and forecast 2025-2030

Chart on Edge inference - Market size and forecast 2025-2030 ($ million)
Data Table on Edge inference - Market size and forecast 2025-2030 ($ million)
Chart on Edge inference - Year-over-year growth 2025-2030 (%)
Data Table on Edge inference - Year-over-year growth 2025-2030 (%)

9.5 On-premises - Market size and forecast 2025-2030

Chart on On-premises - Market size and forecast 2025-2030 ($ million)
Data Table on On-premises - Market size and forecast 2025-2030 ($ million)
Chart on On-premises - Year-over-year growth 2025-2030 (%)
Data Table on On-premises - Year-over-year growth 2025-2030 (%)

9.6 Market opportunity by Deployment

Market opportunity by Deployment ($ million)
Data Table on Market opportunity by Deployment ($ million)

10. Market Segmentation by Application

10.1 Market segments

Chart on Application - Market share 2025-2030 (%)
Data Table on Application - Market share 2025-2030 (%)

10.2 Comparison by Application

Chart on Comparison by Application
Data Table on Comparison by Application

10.3 Computer vision - Market size and forecast 2025-2030

Chart on Computer vision - Market size and forecast 2025-2030 ($ million)
Data Table on Computer vision - Market size and forecast 2025-2030 ($ million)
Chart on Computer vision - Year-over-year growth 2025-2030 (%)
Data Table on Computer vision - Year-over-year growth 2025-2030 (%)

10.4 Robotics - Market size and forecast 2025-2030

Chart on Robotics - Market size and forecast 2025-2030 ($ million)
Data Table on Robotics - Market size and forecast 2025-2030 ($ million)
Chart on Robotics - Year-over-year growth 2025-2030 (%)
Data Table on Robotics - Year-over-year growth 2025-2030 (%)

10.5 Generative AI - Market size and forecast 2025-2030

Chart on Generative AI - Market size and forecast 2025-2030 ($ million)
Data Table on Generative AI - Market size and forecast 2025-2030 ($ million)
Chart on Generative AI - Year-over-year growth 2025-2030 (%)
Data Table on Generative AI - Year-over-year growth 2025-2030 (%)

10.6 NLP - Market size and forecast 2025-2030

Chart on NLP - Market size and forecast 2025-2030 ($ million)
Data Table on NLP - Market size and forecast 2025-2030 ($ million)
Chart on NLP - Year-over-year growth 2025-2030 (%)
Data Table on NLP - Year-over-year growth 2025-2030 (%)

10.7 Others - Market size and forecast 2025-2030

Chart on Others - Market size and forecast 2025-2030 ($ million)
Data Table on Others - Market size and forecast 2025-2030 ($ million)
Chart on Others - Year-over-year growth 2025-2030 (%)
Data Table on Others - Year-over-year growth 2025-2030 (%)

10.8 Market opportunity by Application

Market opportunity by Application ($ million)
Data Table on Market opportunity by Application ($ million)

11. Customer Landscape

11.1 Customer landscape overview

Analysis of price sensitivity, lifecycle, customer purchase basket, adoption rates, and purchase criteria

12. Geographic Landscape

12.1 Geographic segmentation

Chart on Market share by geography 2025-2030 (%)
Data Table on Market share by geography 2025-2030 (%)

12.2 Geographic comparison

Chart on Geographic comparison
Data Table on Geographic comparison

12.3 North America - Market size and forecast 2025-2030

Chart on North America - Market size and forecast 2025-2030 ($ million)
Data Table on North America - Market size and forecast 2025-2030 ($ million)
Chart on North America - Year-over-year growth 2025-2030 (%)
Data Table on North America - Year-over-year growth 2025-2030 (%)
Chart on Regional Comparison - North America
Data Table on Regional Comparison - North America

12.3.1 US - Market size and forecast 2025-2030

Chart on US - Market size and forecast 2025-2030 ($ million)
Data Table on US - Market size and forecast 2025-2030 ($ million)
Chart on US - Year-over-year growth 2025-2030 (%)
Data Table on US - Year-over-year growth 2025-2030 (%)

12.3.2 Canada - Market size and forecast 2025-2030

Chart on Canada - Market size and forecast 2025-2030 ($ million)
Data Table on Canada - Market size and forecast 2025-2030 ($ million)
Chart on Canada - Year-over-year growth 2025-2030 (%)
Data Table on Canada - Year-over-year growth 2025-2030 (%)

12.3.3 Mexico - Market size and forecast 2025-2030

Chart on Mexico - Market size and forecast 2025-2030 ($ million)
Data Table on Mexico - Market size and forecast 2025-2030 ($ million)
Chart on Mexico - Year-over-year growth 2025-2030 (%)
Data Table on Mexico - Year-over-year growth 2025-2030 (%)

12.4 Europe - Market size and forecast 2025-2030

Chart on Europe - Market size and forecast 2025-2030 ($ million)
Data Table on Europe - Market size and forecast 2025-2030 ($ million)
Chart on Europe - Year-over-year growth 2025-2030 (%)
Data Table on Europe - Year-over-year growth 2025-2030 (%)
Chart on Regional Comparison - Europe
Data Table on Regional Comparison - Europe

12.4.1 Germany - Market size and forecast 2025-2030

Chart on Germany - Market size and forecast 2025-2030 ($ million)
Data Table on Germany - Market size and forecast 2025-2030 ($ million)
Chart on Germany - Year-over-year growth 2025-2030 (%)
Data Table on Germany - Year-over-year growth 2025-2030 (%)

12.4.2 UK - Market size and forecast 2025-2030

Chart on UK - Market size and forecast 2025-2030 ($ million)
Data Table on UK - Market size and forecast 2025-2030 ($ million)
Chart on UK - Year-over-year growth 2025-2030 (%)
Data Table on UK - Year-over-year growth 2025-2030 (%)

12.4.3 France - Market size and forecast 2025-2030

Chart on France - Market size and forecast 2025-2030 ($ million)
Data Table on France - Market size and forecast 2025-2030 ($ million)
Chart on France - Year-over-year growth 2025-2030 (%)
Data Table on France - Year-over-year growth 2025-2030 (%)

12.4.4 The Netherlands - Market size and forecast 2025-2030

Chart on The Netherlands - Market size and forecast 2025-2030 ($ million)
Data Table on The Netherlands - Market size and forecast 2025-2030 ($ million)
Chart on The Netherlands - Year-over-year growth 2025-2030 (%)
Data Table on The Netherlands - Year-over-year growth 2025-2030 (%)

12.4.5 Sweden - Market size and forecast 2025-2030

Chart on Sweden - Market size and forecast 2025-2030 ($ million)
Data Table on Sweden - Market size and forecast 2025-2030 ($ million)
Chart on Sweden - Year-over-year growth 2025-2030 (%)
Data Table on Sweden - Year-over-year growth 2025-2030 (%)

12.4.6 Spain - Market size and forecast 2025-2030

Chart on Spain - Market size and forecast 2025-2030 ($ million)
Data Table on Spain - Market size and forecast 2025-2030 ($ million)
Chart on Spain - Year-over-year growth 2025-2030 (%)
Data Table on Spain - Year-over-year growth 2025-2030 (%)

12.5 APAC - Market size and forecast 2025-2030

Chart on APAC - Market size and forecast 2025-2030 ($ million)
Data Table on APAC - Market size and forecast 2025-2030 ($ million)
Chart on APAC - Year-over-year growth 2025-2030 (%)
Data Table on APAC - Year-over-year growth 2025-2030 (%)
Chart on Regional Comparison - APAC
Data Table on Regional Comparison - APAC

12.5.1 China - Market size and forecast 2025-2030

Chart on China - Market size and forecast 2025-2030 ($ million)
Data Table on China - Market size and forecast 2025-2030 ($ million)
Chart on China - Year-over-year growth 2025-2030 (%)
Data Table on China - Year-over-year growth 2025-2030 (%)

12.5.2 Japan - Market size and forecast 2025-2030

Chart on Japan - Market size and forecast 2025-2030 ($ million)
Data Table on Japan - Market size and forecast 2025-2030 ($ million)
Chart on Japan - Year-over-year growth 2025-2030 (%)
Data Table on Japan - Year-over-year growth 2025-2030 (%)

12.5.3 India - Market size and forecast 2025-2030

Chart on India - Market size and forecast 2025-2030 ($ million)
Data Table on India - Market size and forecast 2025-2030 ($ million)
Chart on India - Year-over-year growth 2025-2030 (%)
Data Table on India - Year-over-year growth 2025-2030 (%)

12.5.4 South Korea - Market size and forecast 2025-2030

Chart on South Korea - Market size and forecast 2025-2030 ($ million)
Data Table on South Korea - Market size and forecast 2025-2030 ($ million)
Chart on South Korea - Year-over-year growth 2025-2030 (%)
Data Table on South Korea - Year-over-year growth 2025-2030 (%)

12.5.5 Taiwan - Market size and forecast 2025-2030

Chart on Taiwan - Market size and forecast 2025-2030 ($ million)
Data Table on Taiwan - Market size and forecast 2025-2030 ($ million)
Chart on Taiwan - Year-over-year growth 2025-2030 (%)
Data Table on Taiwan - Year-over-year growth 2025-2030 (%)

12.5.6 Indonesia - Market size and forecast 2025-2030

Chart on Indonesia - Market size and forecast 2025-2030 ($ million)
Data Table on Indonesia - Market size and forecast 2025-2030 ($ million)
Chart on Indonesia - Year-over-year growth 2025-2030 (%)
Data Table on Indonesia - Year-over-year growth 2025-2030 (%)

12.6 Middle East and Africa - Market size and forecast 2025-2030

Chart on Middle East and Africa - Market size and forecast 2025-2030 ($ million)
Data Table on Middle East and Africa - Market size and forecast 2025-2030 ($ million)
Chart on Middle East and Africa - Year-over-year growth 2025-2030 (%)
Data Table on Middle East and Africa - Year-over-year growth 2025-2030 (%)
Chart on Regional Comparison - Middle East and Africa
Data Table on Regional Comparison - Middle East and Africa

12.6.1 UAE - Market size and forecast 2025-2030

Chart on UAE - Market size and forecast 2025-2030 ($ million)
Data Table on UAE - Market size and forecast 2025-2030 ($ million)
Chart on UAE - Year-over-year growth 2025-2030 (%)
Data Table on UAE - Year-over-year growth 2025-2030 (%)

12.6.2 Saudi Arabia - Market size and forecast 2025-2030

Chart on Saudi Arabia - Market size and forecast 2025-2030 ($ million)
Data Table on Saudi Arabia - Market size and forecast 2025-2030 ($ million)
Chart on Saudi Arabia - Year-over-year growth 2025-2030 (%)
Data Table on Saudi Arabia - Year-over-year growth 2025-2030 (%)

12.6.3 Israel - Market size and forecast 2025-2030

Chart on Israel - Market size and forecast 2025-2030 ($ million)
Data Table on Israel - Market size and forecast 2025-2030 ($ million)
Chart on Israel - Year-over-year growth 2025-2030 (%)
Data Table on Israel - Year-over-year growth 2025-2030 (%)

12.6.4 South Africa - Market size and forecast 2025-2030

Chart on South Africa - Market size and forecast 2025-2030 ($ million)
Data Table on South Africa - Market size and forecast 2025-2030 ($ million)
Chart on South Africa - Year-over-year growth 2025-2030 (%)
Data Table on South Africa - Year-over-year growth 2025-2030 (%)

12.6.5 Qatar - Market size and forecast 2025-2030

Chart on Qatar - Market size and forecast 2025-2030 ($ million)
Data Table on Qatar - Market size and forecast 2025-2030 ($ million)
Chart on Qatar - Year-over-year growth 2025-2030 (%)
Data Table on Qatar - Year-over-year growth 2025-2030 (%)

12.7 South America - Market size and forecast 2025-2030

Chart on South America - Market size and forecast 2025-2030 ($ million)
Data Table on South America - Market size and forecast 2025-2030 ($ million)
Chart on South America - Year-over-year growth 2025-2030 (%)
Data Table on South America - Year-over-year growth 2025-2030 (%)
Chart on Regional Comparison - South America
Data Table on Regional Comparison - South America

12.7.1 Brazil - Market size and forecast 2025-2030

Chart on Brazil - Market size and forecast 2025-2030 ($ million)
Data Table on Brazil - Market size and forecast 2025-2030 ($ million)
Chart on Brazil - Year-over-year growth 2025-2030 (%)
Data Table on Brazil - Year-over-year growth 2025-2030 (%)

12.7.2 Argentina - Market size and forecast 2025-2030

Chart on Argentina - Market size and forecast 2025-2030 ($ million)
Data Table on Argentina - Market size and forecast 2025-2030 ($ million)
Chart on Argentina - Year-over-year growth 2025-2030 (%)
Data Table on Argentina - Year-over-year growth 2025-2030 (%)

12.7.3 Chile - Market size and forecast 2025-2030

Chart on Chile - Market size and forecast 2025-2030 ($ million)
Data Table on Chile - Market size and forecast 2025-2030 ($ million)
Chart on Chile - Year-over-year growth 2025-2030 (%)
Data Table on Chile - Year-over-year growth 2025-2030 (%)

12.8 Market opportunity by geography

Market opportunity by geography ($ million)
Data Tables on Market opportunity by geography ($ million)

13. Drivers, Challenges, and Opportunity

13.1 Market drivers

Escalating demand for edge computing capabilities across industries
Proliferation of generative AI models in enterprise workloads
Strategic imperative for energy efficiency and sustainable data processing

13.2 Market challenges

Exorbitant initial capital expenditures for advanced processing systems
Complex integration with legacy enterprise infrastructure
Rapid evolution of neural network architectures and algorithms

13.3 Impact of drivers and challenges

Impact of drivers and challenges in 2025 and 2030

13.4 Market opportunities

Accelerated shift toward application specific integrated circuits
Emergence of chiplet based architectures for modular silicon design
Integration of silicon photonics to alleviate bandwidth bottlenecks

14. Competitive Landscape

14.1 Overview

14.2

Overview on criticality of inputs and factors of differentiation

14.3 Landscape disruption

Overview on factors of disruption

14.4 Industry risks

Impact of key risks on business

15. Competitive Analysis

15.1 Companies profiled

Companies covered

15.2 Company ranking index

15.3 Market positioning of companies

Matrix on companies position and classification

15.4 Advanced Micro Devices Inc.

Advanced Micro Devices Inc. - Overview
Advanced Micro Devices Inc. - Business segments
Advanced Micro Devices Inc. - Key news
Advanced Micro Devices Inc. - Key offerings
Advanced Micro Devices Inc. - Segment focus
SWOT

15.5 Amazon.com Inc.

Amazon.com Inc. - Overview
Amazon.com Inc. - Business segments
Amazon.com Inc. - Key news
Amazon.com Inc. - Key offerings
Amazon.com Inc. - Segment focus
SWOT

15.6 Apple Inc.

Apple Inc. - Overview
Apple Inc. - Business segments
Apple Inc. - Key news
Apple Inc. - Key offerings
Apple Inc. - Segment focus
SWOT

15.7 Arm Ltd.

Arm Ltd. - Overview
Arm Ltd. - Product / Service
Arm Ltd. - Key offerings
SWOT

15.8 Cerebras

Cerebras - Overview
Cerebras - Product / Service
Cerebras - Key offerings
SWOT

15.9 Google LLC

Google LLC - Overview
Google LLC - Product / Service
Google LLC - Key offerings
SWOT

15.10 Groq Inc.

Groq Inc. - Overview
Groq Inc. - Product / Service
Groq Inc. - Key offerings
SWOT

15.11 Intel Corp.

Intel Corp. - Overview
Intel Corp. - Business segments
Intel Corp. - Key offerings
Intel Corp. - Segment focus
SWOT

15.12 MediaTek Inc.

MediaTek Inc. - Overview
MediaTek Inc. - Business segments
MediaTek Inc. - Key news
MediaTek Inc. - Key offerings
MediaTek Inc. - Segment focus
SWOT

15.13 NVIDIA Corp.

NVIDIA Corp. - Overview
NVIDIA Corp. - Business segments
NVIDIA Corp. - Key news
NVIDIA Corp. - Key offerings
NVIDIA Corp. - Segment focus
SWOT

15.14 NXP Semiconductors NV

NXP Semiconductors NV - Overview
NXP Semiconductors NV - Business segments
NXP Semiconductors NV - Key news
NXP Semiconductors NV - Key offerings
NXP Semiconductors NV - Segment focus
SWOT

15.15 Qualcomm Inc.

Qualcomm Inc. - Overview
Qualcomm Inc. - Business segments
Qualcomm Inc. - Key news
Qualcomm Inc. - Key offerings
Qualcomm Inc. - Segment focus
SWOT

15.16 SambaNova Systems Inc.

SambaNova Systems Inc. - Overview
SambaNova Systems Inc. - Product / Service
SambaNova Systems Inc. - Key offerings
SWOT

15.17 STMicroelectronics NV

STMicroelectronics NV - Overview
STMicroelectronics NV - Business segments
STMicroelectronics NV - Key offerings
STMicroelectronics NV - Segment focus
SWOT

15.18 Tenstorrent Inc.

Tenstorrent Inc. - Overview
Tenstorrent Inc. - Product / Service
Tenstorrent Inc. - Key offerings
SWOT

16. Appendix

16.1 Scope of the report

Market definition
Objectives
Notes and caveats

16.2 Inclusions and exclusions checklist

Inclusions checklist
Exclusions checklist

16.3 Currency conversion rates for US$

16.4 Research methodology

16.5 Data procurement

Information sources

16.6 Data validation

16.7 Validation techniques employed for market sizing

16.8 Data synthesis

16.9 360 degree market analysis

16.10 List of abbreviations

Research Methodology

Technavio presents a detailed picture of the market by way of study, synthesis, and summation of data from multiple sources. The analysts have presented the various facets of the market with a particular focus on identifying the key industry influencers. The data thus presented is comprehensive, reliable, and the result of extensive research, both primary and secondary.

INFORMATION SOURCES

Primary sources

  • Manufacturers and suppliers
  • Channel partners
  • Industry experts
  • Strategic decision makers

Secondary sources

  • Industry journals and periodicals
  • Government data
  • Financial reports of key industry players
  • Historical data
  • Press releases

DATA ANALYSIS

Data Synthesis

  • Collation of data
  • Estimation of key figures
  • Analysis of derived insights

Data Validation

  • Triangulation with data models
  • Reference against proprietary databases
  • Corroboration with industry experts

REPORT WRITING

Qualitative

  • Market drivers
  • Market challenges
  • Market trends
  • Five forces analysis

Quantitative

  • Market size and forecast
  • Market segmentation
  • Geographical insights
  • Competitive landscape

Interested in this report?

Get your sample now to see our research methodology and insights!

Download Now

Frequently Asked Questions

Ai Inference Hardware market growth will increase by USD 106251.6 million during 2026-2030.

The Ai Inference Hardware market is expected to grow at a CAGR of 20.8% during 2026-2030.

Ai Inference Hardware market is segmented by Type (GPU, CPU, ASIC, FPGA, Others) Deployment (Cloud inference, Edge inference, On-premises) Application (Computer vision, Robotics, Generative AI, NLP, Others)

Advanced Micro Devices Inc., Amazon.com Inc., Apple Inc., Arm Ltd., Cerebras, Google LLC, Groq Inc., Hailo Technologies Ltd., IBM Corp., Intel Corp., Kneron Inc., MediaTek Inc., NVIDIA Corp., NXP Semiconductors NV, Qualcomm Inc., SambaNova Systems Inc., SiMa Technologies Inc., STMicroelectronics NV, Syntiant Corp., Tenstorrent Inc. are a few of the key vendors in the Ai Inference Hardware market.

North America will register the highest growth rate of 39.8% among the other regions. Therefore, the Ai Inference Hardware market in North America is expected to garner significant business opportunities for the vendors during the forecast period.

US, Canada, Mexico, Germany, UK, France, The Netherlands, Sweden, Spain, China, Japan, India, South Korea, Taiwan, Indonesia, UAE, Saudi Arabia, Israel, South Africa, Qatar, Brazil, Argentina, Chile

  • Escalating demand for edge computing capabilities across industries is the driving factor this market.

The Ai Inference Hardware market vendors should focus on grabbing business opportunities from the Type segment as it accounted for the largest market share in the base year.
RIA - Research AI Assistant
Ask RIA