AI IP And Licensing Market Analysis, Size, and Forecast 2026-2030: North America (US, Canada, and Mexico), Europe (Germany, UK, and France), APAC (China, Japan, and India), Middle East and Africa (UAE, Saudi Arabia, and Israel), South America (Brazil, Argentina, and Colombia), and Rest of World (ROW)

AI IP And Licensing Market Analysis, Size, and Forecast 2026-2030:
North America (US, Canada, and Mexico), Europe (Germany, UK, and France), APAC (China, Japan, and India), Middle East and Africa (UAE, Saudi Arabia, and Israel), South America (Brazil, Argentina, and Colombia), and Rest of World (ROW)

Published: May 2026 322 Pages SKU: IRTNTR80714

Market Overview at a Glance

$41.35 B
Market Opportunity
29.8%
CAGR 2025 - 2030
36.1%
North America Growth
$4.68 B
Patents segment 2024

AI IP And Licensing Market Size 2026-2030

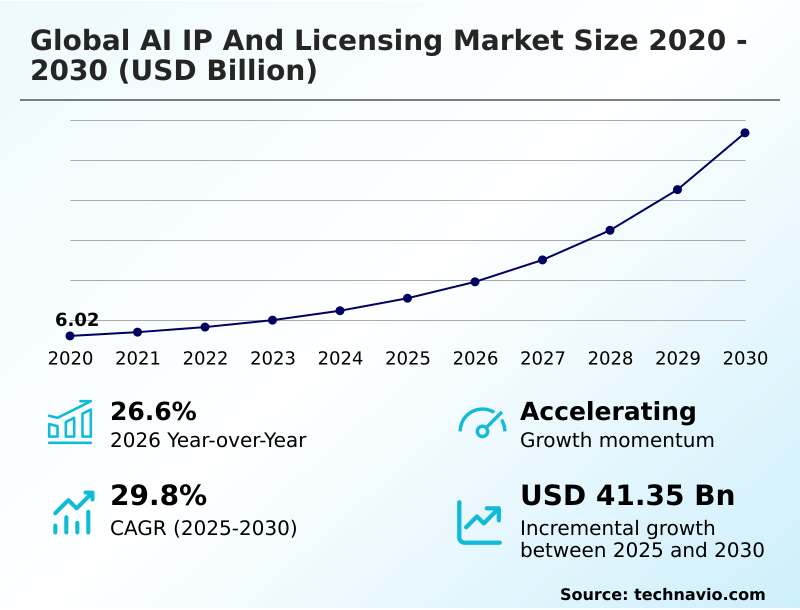
The AI IP And Licensing Market size was valued at USD 15.44 billion in 2025, growing at a CAGR of 29.8% during the forecast period 2026-2030.

Major Market Trends & Insights

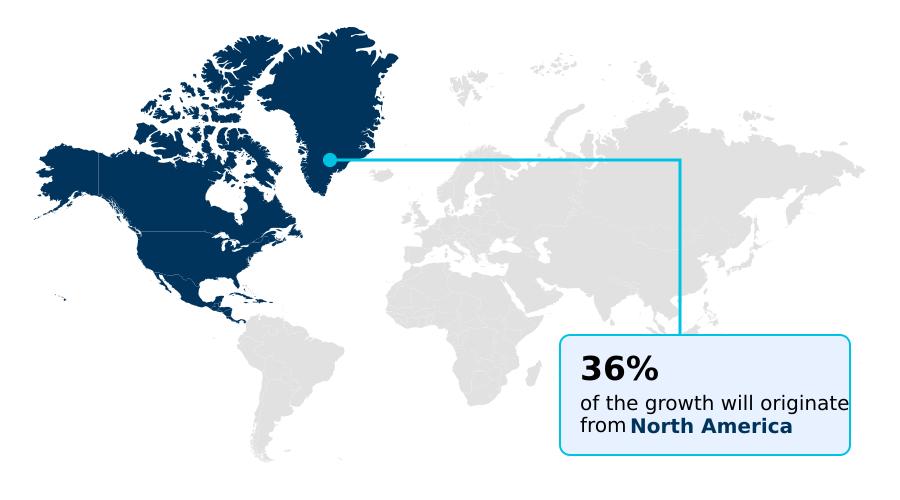
  • North America dominated the market and accounted for a 36.1% growth during the forecast period.
  • By Type - Patents segment was valued at USD 4.68 billion in 2024
  • By License Model - Proprietary licenses segment accounted for the largest market revenue share in 2024

Market Size & Forecast

  • Historic Market Opportunities 2020-2024: USD 50.76 billion
  • Market Future Opportunities 2025-2030: USD 41.35 billion
  • CAGR from 2025 to 2030 : 29.8%

Market Summary

  • The AI IP and licensing market is defined by rapid innovation cycles where over 70% of large enterprises now integrate some form of licensed AI, reflecting a critical shift from research concepts to essential business tools. A primary driver is the massive investment in generative AI infrastructure, which provides the necessary foundation for developing and deploying intellectual property.
  • For instance, a manufacturer licensing a predictive maintenance algorithm can reduce equipment downtime by up to 25%, directly improving operational efficiency. However, the market faces a significant challenge with the high procurement prices of computing resources, as the cost of a single high-end AI accelerator can exceed that of a small-scale pilot project, creating a barrier to entry.
  • This dynamic forces a strategic balance between leveraging cutting-edge, resource-intensive models and adopting more efficient, cost-effective algorithms. Consequently, licensing models are evolving to offer greater flexibility to accommodate a wider range of enterprise needs and budgets.

What will be the Size of the AI IP And Licensing Market during the forecast period?

Get Key Insights on Market Forecast (PDF) Request Free Sample

How is the AI IP And Licensing Market Segmented?

The ai ip and licensing industry research report provides comprehensive data (region-wise segment analysis), with forecasts and analysis for the period 2026-2030, as well as historical data from 2020-2024 for the following segments.

  • Type
    • Patents
    • Copyrights
    • Trade secrets
    • Trademarks
  • License model
    • Proprietary licenses
    • Subscription-based licenses
    • Open-source licenses
    • Hybrid licenses
    • Others
  • End-user
    • BFSI
    • Healthcare
    • Automotive
    • Retail and e-commerce
    • Others
  • Geography
    • North America
      • US
      • Canada
      • Mexico
    • Europe
      • Germany
      • UK
      • France
    • APAC
      • China
      • Japan
      • India
    • Middle East and Africa
      • UAE
      • Saudi Arabia
      • Israel
    • South America
      • Brazil
      • Argentina
      • Colombia
    • Rest of World (ROW)

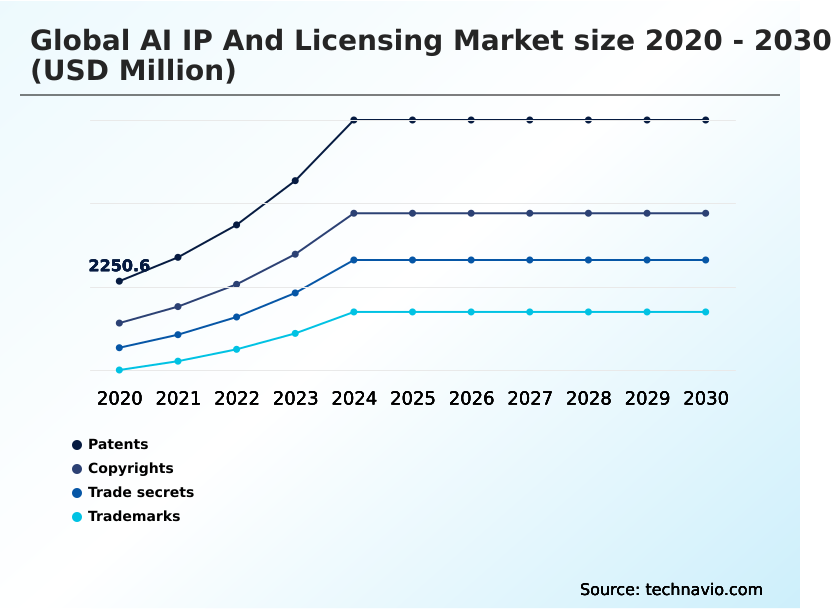
How is the AI IP And Licensing Market Segmented by Type?

The patents segment is estimated to witness significant growth during the forecast period.

The patents segment is expanding, with patent filings for generative models increasing by over 40% as companies seek to protect proprietary algorithms.

This growth is driven by the need to secure intellectual property for neural network architectures, where a 15% improvement in processing efficiency can create a significant competitive advantage.

As a result, businesses are intensifying their patent portfolio management to defend against patent litigation and to capitalize on licensing opportunities.

The surge in enterprise automation software adoption is also compelling organizations to secure patents for unique workflow innovations, solidifying their market position through legally protected technological differentiation.

Request Free Sample

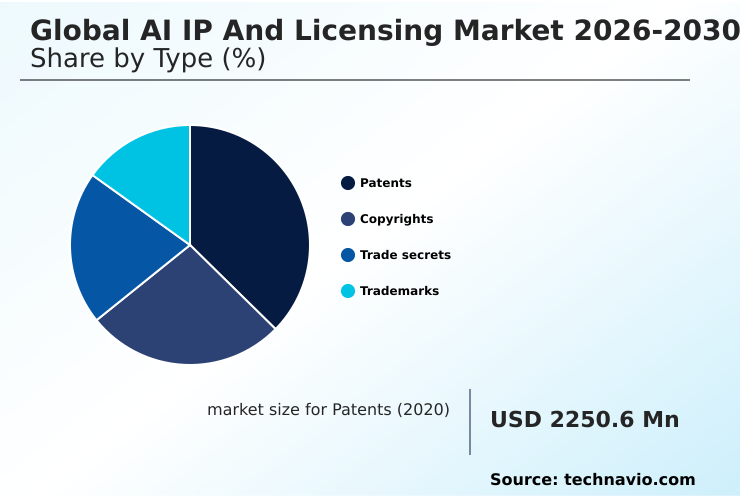
The Patents segment was valued at USD 4.68 billion in 2024 and showed a gradual increase during the forecast period.

Request Free Sample

How demand for the AI IP And Licensing market is rising in the leading region?

North America is estimated to contribute 36.1% to the growth of the global market during the forecast period.Technavio’s analysts have elaborately explained the regional trends and drivers that shape the market during the forecast period.

See How AI IP And Licensing Market demand is rising in North America Request Free Sample

The global AI IP and licensing market exhibits distinct regional dynamics, with North America leading, contributing to over 36% of the incremental growth, driven by its mature venture capital ecosystem.

The US, in particular, dominates the region, accounting for more than 80% of its market value due to the high concentration of major technology firms and research institutions.

In contrast, the APAC market, projected to grow at the fastest rate, is characterized by a focus on integrating AI into manufacturing and consumer electronics, where technology transfer agreements are common.

This regional difference in adoption—industrial automation in APAC versus foundational model development in North America—shapes licensing strategies.

For example, licensing explainable AI is a higher priority in Europe to meet regulatory demands, while APAC focuses on licensing for high-volume production, impacting everything from computer vision patents to natural language processing algorithms.

What are the key Drivers, Trends, and Challenges in the AI IP And Licensing Market?

Our researchers analyzed the data with 2025 as the base year, along with the key drivers, trends, and challenges. A holistic analysis of drivers will help companies refine their marketing strategies to gain a competitive advantage.

  • Enterprises evaluating AI model licensing agreement costs are navigating a complex market where value is tied to both technological sophistication and legal defensibility. The increasing adoption of federated learning IP protection strategies is a direct response to data privacy concerns, allowing companies to train models collaboratively without sharing sensitive raw data.
  • This approach has proven to be over 20% more effective in certain regulated industries compared to centralized data models. Concurrently, edge AI software patent trends show a definitive shift toward on-device processing to reduce latency and enhance user privacy, a critical factor in the consumer electronics sector.
  • However, this decentralized approach raises concerns about generative AI copyright infringement risks, as tracking the provenance of content created on millions of devices becomes a significant challenge. To mitigate these risks and ensure compliance, many organizations are adopting sovereign cloud data compliance for AI, which mandates that all data and processing adhere to the legal frameworks of a specific jurisdiction.
  • This strategy ensures data sovereignty but can increase operational complexity, requiring a careful balance between legal security and technological agility.

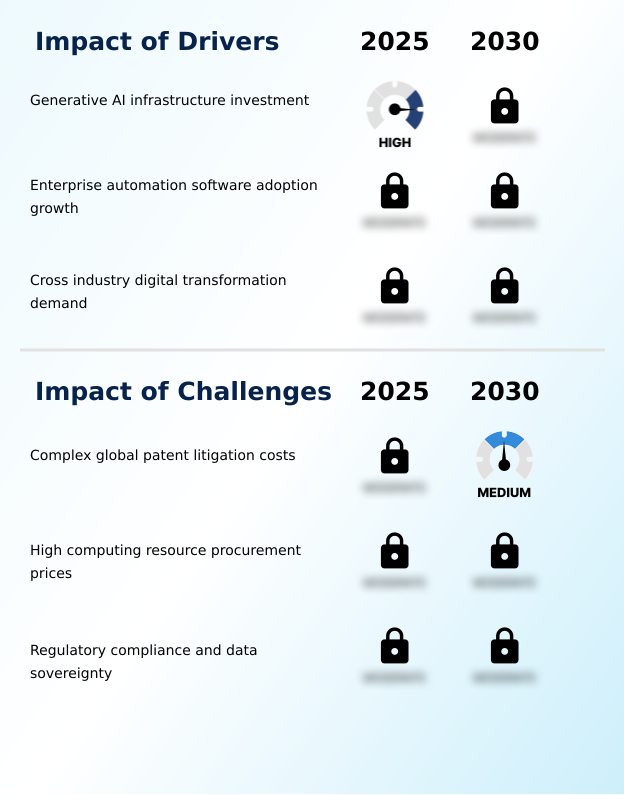
What are the key market drivers leading to the rise in the adoption of AI IP And Licensing Industry?

  • Substantial investment in generative AI infrastructure is the primary market driver, creating the foundational computational capacity needed for AI IP development and deployment.

  • The rapid adoption of enterprise automation software is a primary driver, with over 70% of large corporations now licensing some form of AI to improve operational efficiency.
  • This integration of autonomous agentic systems and intelligent document processing is delivering measurable returns, with some firms reporting a 30% reduction in operational expenses.
  • A correlated driver is the cross-industry demand for digital transformation, which fuels the market for data licensing marketplaces and proprietary algorithms. The development of large language models is also accelerating growth, supported by massive investments in high-performance computing clusters.
  • These models, which are often licensed, provide the foundation for a new generation of applications, from customer service bots to complex analytical tools, creating a self-reinforcing cycle of innovation and demand.

What are the market trends shaping the AI IP And Licensing Industry?

  • The market is observing a significant trend toward sovereign AI model licensing. This shift is driven by nations seeking technological autonomy and data security within their jurisdictions.

  • Sovereign AI models are becoming a dominant trend, with national governments driving demand for localized licensing frameworks to ensure data residency, reflecting a 30% increase in government-led AI initiatives. This shift necessitates the development of sovereign cloud infrastructures and the technology transfer of foundational architectures, allowing regional entities to customize models.
  • Another key trend is the optimization of intellectual property for edge computing, where model pruning and quantization techniques are reducing model sizes by up to 90% to enable on-device generative tasks. This move to the edge is creating new patent opportunities in federated learning and hardware-accelerated security, allowing for privacy-preserving innovation.
  • The adoption of digital watermarking is also growing as a method for tracking model weights and protecting intellectual property in decentralized environments.

What challenges does the AI IP And Licensing Industry face during its growth?

  • The considerable expense and intricacy of complex global patent litigation represent a key challenge, restraining market growth by consuming resources and creating legal uncertainty.

  • A primary challenge restraining the market is the high cost of AI accelerators and computing resources, which can represent over 50% of the total budget for developing a new large-scale model. This financial barrier limits entry for smaller firms and slows innovation.
  • Compounding this issue are the complexities of global data sovereignty regulations, which require companies to maintain separate, localized infrastructures, increasing operational overhead by as much as 25% in certain regions. Furthermore, the risk of complex global patent litigation and the difficulty of protecting trade secrets in a fast-paced environment create significant legal and financial uncertainty.
  • The lack of unified standards for copyright protection for AI-generated content adds another layer of legal ambiguity, deterring investment and complicating licensing negotiations.

Exclusive Technavio Analysis on Customer Landscape

The ai ip and licensing market forecasting report includes the adoption lifecycle of the market, covering from the innovator’s stage to the laggard’s stage. It focuses on adoption rates in different regions based on penetration. Furthermore, the ai ip and licensing market report also includes key purchase criteria and drivers of price sensitivity to help companies evaluate and develop their market growth analysis strategies.

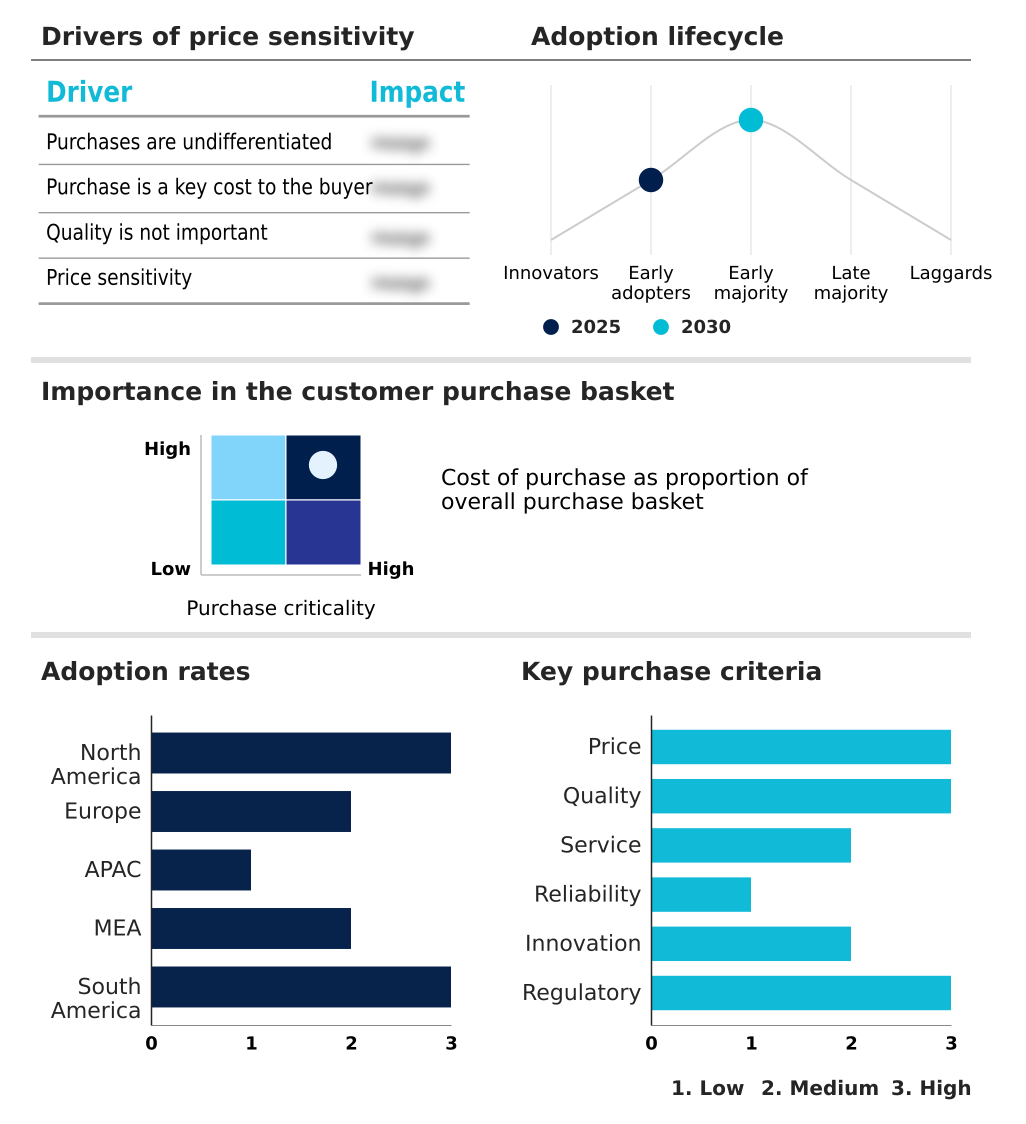
Customer Landscape of AI IP And Licensing Industry

Competitive Landscape

Companies are implementing various strategies, such as strategic alliances, ai ip and licensing market forecast, partnerships, mergers and acquisitions, geographical expansion, and product/service launches, to enhance their presence in the industry.

Accenture Plc - Key offerings include enterprise AI licensing, cloud-based AI services, and proprietary AI technologies embedded within devices and software frameworks.

The industry research and growth report includes detailed analyses of the competitive landscape of the market and information about key companies, including:

  • Accenture Plc
  • Alibaba Group Holding Ltd.
  • Amazon Web Services Inc.
  • Apple Inc.
  • Baidu Inc.
  • CEVA Inc.
  • Google LLC
  • IBM Corp.
  • Intel Corp.
  • InterDigital Inc.
  • Meta Platforms Inc.
  • Microsoft Corp.
  • NVIDIA Corp.
  • Oracle Corp.
  • Qualcomm Inc.
  • Salesforce Inc.
  • SAP SE
  • Siemens AG
  • SoftBank Group Corp.
  • Tata Consultancy Services

Qualitative and quantitative analysis of companies has been conducted to help clients understand the wider business environment as well as the strengths and weaknesses of key industry players. Data is qualitatively analyzed to categorize companies as pure play, category-focused, industry-focused, and diversified; it is quantitatively analyzed to categorize companies as dominant, leading, strong, tentative, and weak.

Market Intelligence Radar: High-Impact Developments & Growth Signals

  • In the Application Software industry, the widespread adoption of cloud-native and SaaS delivery models is compelling AI IP licensors to shift from perpetual licenses to flexible, subscription-based licensing frameworks to align with enterprise consumption patterns.
  • The increasing integration of low-code/no-code platforms within enterprise automation software is creating new demand for modular AI IP, requiring licensors to offer more granular and easily integrable proprietary algorithms.
  • Stricter data privacy regulations, such as GDPR and similar frameworks, are forcing application software developers to seek out AI IP with built-in compliance features, particularly for federated learning and sovereign AI models, impacting licensing agreements.
  • A significant push toward workflow interoperability in application software suites is driving demand for AI IP that supports open standards and APIs, facilitating easier integration of natural language processing algorithms into diverse enterprise ecosystems.

Dive into Technavio’s robust research methodology, blending expert interviews, extensive data synthesis, and validated models for unparalleled AI IP And Licensing Market insights. See full methodology.

Market Scope
Page number 322
Base year 2025
Historic period 2020-2024
Forecast period 2026-2030
Growth momentum & CAGR Accelerate at a CAGR of 29.8%
Market growth 2026-2030 USD 41349.0 million
Market structure Fragmented
YoY growth 2025-2026(%) 26.6%
Key countries US, Canada, Mexico, Germany, UK, France, Italy, Spain, Russia, China, Japan, India, South Korea, Australia, Singapore, UAE, Saudi Arabia, Israel, South Africa, Turkey, Brazil, Argentina and Colombia
Competitive landscape Leading Companies, Market Positioning of Companies, Competitive Strategies, and Industry Risks

Request Free Sample

Research Analyst Overview

  • The AI IP and licensing market ecosystem is a complex web of interdependent stakeholders, with technology suppliers providing the foundational AI accelerators and high-performance computing clusters that are essential for development. AI solution providers, ranging from large-cap tech firms to specialized startups, develop and license proprietary algorithms and neural network architectures.
  • These providers engage with end-users across diverse sectors through various licensing frameworks, including proprietary and subscription-based models. A key dynamic is the role of regulatory bodies, which enforce data sovereignty and copyright protection, influencing how intellectual property is created and managed. For instance, compliance with regional data mandates can increase development costs by 15-20%.
  • The value chain is completed by distribution channels, including cloud marketplaces and direct sales, which facilitate the commercialization of generative models and other AI assets, enabling widespread enterprise adoption.

What are the Key Data Covered in this AI IP And Licensing Market Research and Growth Report?

  • What is the expected growth of the AI IP And Licensing Market between 2026 and 2030?

    • The AI IP And Licensing Market is expected to grow by USD 41.35 billion during 2026-2030, registering a CAGR of 29.8%. Year-over-year growth in 2026 is estimated at 26.6%%. This acceleration is shaped by generative ai infrastructure investment, which is intensifying demand across multiple end-use verticals covered in the report.

  • What segmentation does the market report cover?

    • The report is segmented by Type (Patents, Copyrights, Trade secrets, and Trademarks), License Model (Proprietary licenses, Subscription-based licenses, Open-source licenses, Hybrid licenses, and Others), End-user (BFSI, Healthcare, Automotive, Retail and e-commerce, and Others) and Geography (North America, Europe, APAC, Middle East and Africa, South America). Among these, the Patents segment is estimated to witness significant growth during the forecast period, driven by rising adoption across key application areas. Each segment includes detailed qualitative and quantitative analysis, along with historical data from 2020-2024 and forecasts through 2030 with year-over-year growth rates.

  • Which regions are analyzed in the report?

    • The report covers North America, Europe, APAC, Middle East and Africa and South America. North America is estimated to contribute 36.1% to market growth during the forecast period. Country-level analysis includes US, Canada, Mexico, Germany, UK, France, Italy, Spain, Russia, China, Japan, India, South Korea, Australia, Singapore, UAE, Saudi Arabia, Israel, South Africa, Turkey, Brazil, Argentina and Colombia, with dedicated market size tables and year-over-year growth for each.

  • What are the key growth drivers and market challenges?

    • The primary driver is generative ai infrastructure investment, which is accelerating investment and industry demand. The main challenge is complex global patent litigation costs, creating operational barriers for key market participants. The report quantifies the impact of each driver and challenge across 2026 and 2030 with comparative analysis.

  • Who are the major players in the AI IP And Licensing Market?

    • Key vendors include Accenture Plc, Alibaba Group Holding Ltd., Amazon Web Services Inc., Apple Inc., Baidu Inc., CEVA Inc., Google LLC, IBM Corp., Intel Corp., InterDigital Inc., Meta Platforms Inc., Microsoft Corp., NVIDIA Corp., Oracle Corp., Qualcomm Inc., Salesforce Inc., SAP SE, Siemens AG, SoftBank Group Corp. and Tata Consultancy Services. The report provides qualitative and quantitative analysis categorizing companies as dominant, leading, strong, tentative, and weak based on their market positioning. Company profiles include business segment analysis, SWOT assessment, key offerings, and recent strategic developments.

Market Research Insights

  • The competitive landscape for AI IP and licensing is intensely active, with over 70% of large enterprises now integrating licensed AI into core workflows. Key vendors are shaping the market through strategic initiatives focused on accessibility and specialization.
  • For instance, a major cloud provider recently launched a marketplace for pre-trained machine learning models, lowering the barrier to entry for smaller firms. This move directly addresses the demand for scalable AI solutions. Concurrently, a leading semiconductor firm finalized licensing agreements for its on-device generative AI, enabling advanced processing on smartphones and other edge devices.
  • These actions reflect the broader industry trend of embedding AI capabilities across diverse hardware and software ecosystems. Companies are navigating the high costs of computing resources, which can account for up to 30% of an AI project's budget, by optimizing algorithms and exploring more efficient hardware.

We can help! Our analysts can customize this ai ip and licensing market research report to meet your requirements.

Get in touch

1. Executive Summary

1.1 Market overview

Executive Summary - Chart on Market Overview
Executive Summary - Data Table on Market Overview
Executive Summary - Chart on Global Market Characteristics
Executive Summary - Chart on Market by Geography
Executive Summary - Chart on Market Segmentation by Type
Executive Summary - Chart on Market Segmentation by License Model
Executive Summary - Chart on Market Segmentation by End-user
Executive Summary - Chart on Incremental Growth
Executive Summary - Data Table on Incremental Growth
Executive Summary - Chart on Company Market Positioning

2. Technavio Analysis

2.1 Analysis of price sensitivity, lifecycle, customer purchase basket, adoption rates, and purchase criteria

2.2 Criticality of inputs and Factors of differentiation

Chart on Overview on criticality of inputs and factors of differentiation

2.3 Factors of disruption

Chart on Overview on factors of disruption

2.4 Impact of drivers and challenges

Chart on Impact of drivers and challenges in 2025 and 2030

3. Market Landscape

3.1 Market ecosystem

Chart on Parent Market
Data Table on - Parent Market

3.2 Market characteristics

Chart on Market characteristics analysis

3.3 Value chain analysis

Chart on Value chain analysis

4. Market Sizing

4.1 Market definition

Data Table on Offerings of companies included in the market definition

4.2 Market segment analysis

Market segments

4.3 Market size 2025

4.4 Market outlook: Forecast for 2025-2030

Chart on Global - Market size and forecast 2025-2030 ($ million)
Data Table on Global - Market size and forecast 2025-2030 ($ million)
Chart on Global Market: Year-over-year growth 2025-2030 (%)
Data Table on Global Market: Year-over-year growth 2025-2030 (%)

5. Historic Market Size

5.1 Global AI IP And Licensing Market 2020 - 2024

Historic Market Size - Data Table on Global AI IP And Licensing Market 2020 - 2024 ($ million)

5.2 Type segment analysis 2020 - 2024

Historic Market Size - Type Segment 2020 - 2024 ($ million)

5.3 License Model segment analysis 2020 - 2024

Historic Market Size - License Model Segment 2020 - 2024 ($ million)

5.4 End-user segment analysis 2020 - 2024

Historic Market Size - End-user Segment 2020 - 2024 ($ million)

5.5 Geography segment analysis 2020 - 2024

Historic Market Size - Geography Segment 2020 - 2024 ($ million)

5.6 Country segment analysis 2020 - 2024

Historic Market Size - Country Segment 2020 - 2024 ($ million)

6. Qualitative Analysis

6.1 Impact of Geopolitical Conflicts on the Global AI IP and Licensing Market

7. Five Forces Analysis

7.1 Five forces summary

Five forces analysis - Comparison between 2025 and 2030

7.2 Bargaining power of buyers

Bargaining power of buyers - Impact of key factors 2025 and 2030

7.3 Bargaining power of suppliers

Bargaining power of suppliers - Impact of key factors in 2025 and 2030

7.4 Threat of new entrants

Threat of new entrants - Impact of key factors in 2025 and 2030

7.5 Threat of substitutes

Threat of substitutes - Impact of key factors in 2025 and 2030

7.6 Threat of rivalry

Threat of rivalry - Impact of key factors in 2025 and 2030

7.7 Market condition

Chart on Market condition - Five forces 2025 and 2030

8. Market Segmentation by Type

8.1 Market segments

Chart on Type - Market share 2025-2030 (%)
Data Table on Type - Market share 2025-2030 (%)

8.2 Comparison by Type

Chart on Comparison by Type
Data Table on Comparison by Type

8.3 Patents - Market size and forecast 2025-2030

Chart on Patents - Market size and forecast 2025-2030 ($ million)
Data Table on Patents - Market size and forecast 2025-2030 ($ million)
Chart on Patents - Year-over-year growth 2025-2030 (%)
Data Table on Patents - Year-over-year growth 2025-2030 (%)

8.4 Copyrights - Market size and forecast 2025-2030

Chart on Copyrights - Market size and forecast 2025-2030 ($ million)
Data Table on Copyrights - Market size and forecast 2025-2030 ($ million)
Chart on Copyrights - Year-over-year growth 2025-2030 (%)
Data Table on Copyrights - Year-over-year growth 2025-2030 (%)

8.5 Trade secrets - Market size and forecast 2025-2030

Chart on Trade secrets - Market size and forecast 2025-2030 ($ million)
Data Table on Trade secrets - Market size and forecast 2025-2030 ($ million)
Chart on Trade secrets - Year-over-year growth 2025-2030 (%)
Data Table on Trade secrets - Year-over-year growth 2025-2030 (%)

8.6 Trademarks - Market size and forecast 2025-2030

Chart on Trademarks - Market size and forecast 2025-2030 ($ million)
Data Table on Trademarks - Market size and forecast 2025-2030 ($ million)
Chart on Trademarks - Year-over-year growth 2025-2030 (%)
Data Table on Trademarks - Year-over-year growth 2025-2030 (%)

8.7 Market opportunity by Type

Market opportunity by Type ($ million)
Data Table on Market opportunity by Type ($ million)

9. Market Segmentation by License Model

9.1 Market segments

Chart on License Model - Market share 2025-2030 (%)
Data Table on License Model - Market share 2025-2030 (%)

9.2 Comparison by License Model

Chart on Comparison by License Model
Data Table on Comparison by License Model

9.3 Proprietary licenses - Market size and forecast 2025-2030

Chart on Proprietary licenses - Market size and forecast 2025-2030 ($ million)
Data Table on Proprietary licenses - Market size and forecast 2025-2030 ($ million)
Chart on Proprietary licenses - Year-over-year growth 2025-2030 (%)
Data Table on Proprietary licenses - Year-over-year growth 2025-2030 (%)

9.4 Subscription-based licenses - Market size and forecast 2025-2030

Chart on Subscription-based licenses - Market size and forecast 2025-2030 ($ million)
Data Table on Subscription-based licenses - Market size and forecast 2025-2030 ($ million)
Chart on Subscription-based licenses - Year-over-year growth 2025-2030 (%)
Data Table on Subscription-based licenses - Year-over-year growth 2025-2030 (%)

9.5 Open-source licenses - Market size and forecast 2025-2030

Chart on Open-source licenses - Market size and forecast 2025-2030 ($ million)
Data Table on Open-source licenses - Market size and forecast 2025-2030 ($ million)
Chart on Open-source licenses - Year-over-year growth 2025-2030 (%)
Data Table on Open-source licenses - Year-over-year growth 2025-2030 (%)

9.6 Hybrid licenses - Market size and forecast 2025-2030

Chart on Hybrid licenses - Market size and forecast 2025-2030 ($ million)
Data Table on Hybrid licenses - Market size and forecast 2025-2030 ($ million)
Chart on Hybrid licenses - Year-over-year growth 2025-2030 (%)
Data Table on Hybrid licenses - Year-over-year growth 2025-2030 (%)

9.7 Others - Market size and forecast 2025-2030

Chart on Others - Market size and forecast 2025-2030 ($ million)
Data Table on Others - Market size and forecast 2025-2030 ($ million)
Chart on Others - Year-over-year growth 2025-2030 (%)
Data Table on Others - Year-over-year growth 2025-2030 (%)

9.8 Market opportunity by License Model

Market opportunity by License Model ($ million)
Data Table on Market opportunity by License Model ($ million)

10. Market Segmentation by End-user

10.1 Market segments

Chart on End-user - Market share 2025-2030 (%)
Data Table on End-user - Market share 2025-2030 (%)

10.2 Comparison by End-user

Chart on Comparison by End-user
Data Table on Comparison by End-user

10.3 BFSI - Market size and forecast 2025-2030

Chart on BFSI - Market size and forecast 2025-2030 ($ million)
Data Table on BFSI - Market size and forecast 2025-2030 ($ million)
Chart on BFSI - Year-over-year growth 2025-2030 (%)
Data Table on BFSI - Year-over-year growth 2025-2030 (%)

10.4 Healthcare - Market size and forecast 2025-2030

Chart on Healthcare - Market size and forecast 2025-2030 ($ million)
Data Table on Healthcare - Market size and forecast 2025-2030 ($ million)
Chart on Healthcare - Year-over-year growth 2025-2030 (%)
Data Table on Healthcare - Year-over-year growth 2025-2030 (%)

10.5 Automotive - Market size and forecast 2025-2030

Chart on Automotive - Market size and forecast 2025-2030 ($ million)
Data Table on Automotive - Market size and forecast 2025-2030 ($ million)
Chart on Automotive - Year-over-year growth 2025-2030 (%)
Data Table on Automotive - Year-over-year growth 2025-2030 (%)

10.6 Retail and e-commerce - Market size and forecast 2025-2030

Chart on Retail and e-commerce - Market size and forecast 2025-2030 ($ million)
Data Table on Retail and e-commerce - Market size and forecast 2025-2030 ($ million)
Chart on Retail and e-commerce - Year-over-year growth 2025-2030 (%)
Data Table on Retail and e-commerce - Year-over-year growth 2025-2030 (%)

10.7 Others - Market size and forecast 2025-2030

Chart on Others - Market size and forecast 2025-2030 ($ million)
Data Table on Others - Market size and forecast 2025-2030 ($ million)
Chart on Others - Year-over-year growth 2025-2030 (%)
Data Table on Others - Year-over-year growth 2025-2030 (%)

10.8 Market opportunity by End-user

Market opportunity by End-user ($ million)
Data Table on Market opportunity by End-user ($ million)

11. Customer Landscape

11.1 Customer landscape overview

Analysis of price sensitivity, lifecycle, customer purchase basket, adoption rates, and purchase criteria

12. Geographic Landscape

12.1 Geographic segmentation

Chart on Market share by geography 2025-2030 (%)
Data Table on Market share by geography 2025-2030 (%)

12.2 Geographic comparison

Chart on Geographic comparison
Data Table on Geographic comparison

12.3 North America - Market size and forecast 2025-2030

Chart on North America - Market size and forecast 2025-2030 ($ million)
Data Table on North America - Market size and forecast 2025-2030 ($ million)
Chart on North America - Year-over-year growth 2025-2030 (%)
Data Table on North America - Year-over-year growth 2025-2030 (%)
Chart on Regional Comparison - North America
Data Table on Regional Comparison - North America

12.3.1 US - Market size and forecast 2025-2030

Chart on US - Market size and forecast 2025-2030 ($ million)
Data Table on US - Market size and forecast 2025-2030 ($ million)
Chart on US - Year-over-year growth 2025-2030 (%)
Data Table on US - Year-over-year growth 2025-2030 (%)

12.3.2 Canada - Market size and forecast 2025-2030

Chart on Canada - Market size and forecast 2025-2030 ($ million)
Data Table on Canada - Market size and forecast 2025-2030 ($ million)
Chart on Canada - Year-over-year growth 2025-2030 (%)
Data Table on Canada - Year-over-year growth 2025-2030 (%)

12.3.3 Mexico - Market size and forecast 2025-2030

Chart on Mexico - Market size and forecast 2025-2030 ($ million)
Data Table on Mexico - Market size and forecast 2025-2030 ($ million)
Chart on Mexico - Year-over-year growth 2025-2030 (%)
Data Table on Mexico - Year-over-year growth 2025-2030 (%)

12.4 Europe - Market size and forecast 2025-2030

Chart on Europe - Market size and forecast 2025-2030 ($ million)
Data Table on Europe - Market size and forecast 2025-2030 ($ million)
Chart on Europe - Year-over-year growth 2025-2030 (%)
Data Table on Europe - Year-over-year growth 2025-2030 (%)
Chart on Regional Comparison - Europe
Data Table on Regional Comparison - Europe

12.4.1 Germany - Market size and forecast 2025-2030

Chart on Germany - Market size and forecast 2025-2030 ($ million)
Data Table on Germany - Market size and forecast 2025-2030 ($ million)
Chart on Germany - Year-over-year growth 2025-2030 (%)
Data Table on Germany - Year-over-year growth 2025-2030 (%)

12.4.2 UK - Market size and forecast 2025-2030

Chart on UK - Market size and forecast 2025-2030 ($ million)
Data Table on UK - Market size and forecast 2025-2030 ($ million)
Chart on UK - Year-over-year growth 2025-2030 (%)
Data Table on UK - Year-over-year growth 2025-2030 (%)

12.4.3 France - Market size and forecast 2025-2030

Chart on France - Market size and forecast 2025-2030 ($ million)
Data Table on France - Market size and forecast 2025-2030 ($ million)
Chart on France - Year-over-year growth 2025-2030 (%)
Data Table on France - Year-over-year growth 2025-2030 (%)

12.4.4 Italy - Market size and forecast 2025-2030

Chart on Italy - Market size and forecast 2025-2030 ($ million)
Data Table on Italy - Market size and forecast 2025-2030 ($ million)
Chart on Italy - Year-over-year growth 2025-2030 (%)
Data Table on Italy - Year-over-year growth 2025-2030 (%)

12.4.5 Spain - Market size and forecast 2025-2030

Chart on Spain - Market size and forecast 2025-2030 ($ million)
Data Table on Spain - Market size and forecast 2025-2030 ($ million)
Chart on Spain - Year-over-year growth 2025-2030 (%)
Data Table on Spain - Year-over-year growth 2025-2030 (%)

12.4.6 Russia - Market size and forecast 2025-2030

Chart on Russia - Market size and forecast 2025-2030 ($ million)
Data Table on Russia - Market size and forecast 2025-2030 ($ million)
Chart on Russia - Year-over-year growth 2025-2030 (%)
Data Table on Russia - Year-over-year growth 2025-2030 (%)

12.5 APAC - Market size and forecast 2025-2030

Chart on APAC - Market size and forecast 2025-2030 ($ million)
Data Table on APAC - Market size and forecast 2025-2030 ($ million)
Chart on APAC - Year-over-year growth 2025-2030 (%)
Data Table on APAC - Year-over-year growth 2025-2030 (%)
Chart on Regional Comparison - APAC
Data Table on Regional Comparison - APAC

12.5.1 China - Market size and forecast 2025-2030

Chart on China - Market size and forecast 2025-2030 ($ million)
Data Table on China - Market size and forecast 2025-2030 ($ million)
Chart on China - Year-over-year growth 2025-2030 (%)
Data Table on China - Year-over-year growth 2025-2030 (%)

12.5.2 Japan - Market size and forecast 2025-2030

Chart on Japan - Market size and forecast 2025-2030 ($ million)
Data Table on Japan - Market size and forecast 2025-2030 ($ million)
Chart on Japan - Year-over-year growth 2025-2030 (%)
Data Table on Japan - Year-over-year growth 2025-2030 (%)

12.5.3 India - Market size and forecast 2025-2030

Chart on India - Market size and forecast 2025-2030 ($ million)
Data Table on India - Market size and forecast 2025-2030 ($ million)
Chart on India - Year-over-year growth 2025-2030 (%)
Data Table on India - Year-over-year growth 2025-2030 (%)

12.5.4 South Korea - Market size and forecast 2025-2030

Chart on South Korea - Market size and forecast 2025-2030 ($ million)
Data Table on South Korea - Market size and forecast 2025-2030 ($ million)
Chart on South Korea - Year-over-year growth 2025-2030 (%)
Data Table on South Korea - Year-over-year growth 2025-2030 (%)

12.5.5 Australia - Market size and forecast 2025-2030

Chart on Australia - Market size and forecast 2025-2030 ($ million)
Data Table on Australia - Market size and forecast 2025-2030 ($ million)
Chart on Australia - Year-over-year growth 2025-2030 (%)
Data Table on Australia - Year-over-year growth 2025-2030 (%)

12.5.6 Singapore - Market size and forecast 2025-2030

Chart on Singapore - Market size and forecast 2025-2030 ($ million)
Data Table on Singapore - Market size and forecast 2025-2030 ($ million)
Chart on Singapore - Year-over-year growth 2025-2030 (%)
Data Table on Singapore - Year-over-year growth 2025-2030 (%)

12.6 Middle East and Africa - Market size and forecast 2025-2030

Chart on Middle East and Africa - Market size and forecast 2025-2030 ($ million)
Data Table on Middle East and Africa - Market size and forecast 2025-2030 ($ million)
Chart on Middle East and Africa - Year-over-year growth 2025-2030 (%)
Data Table on Middle East and Africa - Year-over-year growth 2025-2030 (%)
Chart on Regional Comparison - Middle East and Africa
Data Table on Regional Comparison - Middle East and Africa

12.6.1 UAE - Market size and forecast 2025-2030

Chart on UAE - Market size and forecast 2025-2030 ($ million)
Data Table on UAE - Market size and forecast 2025-2030 ($ million)
Chart on UAE - Year-over-year growth 2025-2030 (%)
Data Table on UAE - Year-over-year growth 2025-2030 (%)

12.6.2 Saudi Arabia - Market size and forecast 2025-2030

Chart on Saudi Arabia - Market size and forecast 2025-2030 ($ million)
Data Table on Saudi Arabia - Market size and forecast 2025-2030 ($ million)
Chart on Saudi Arabia - Year-over-year growth 2025-2030 (%)
Data Table on Saudi Arabia - Year-over-year growth 2025-2030 (%)

12.6.3 Israel - Market size and forecast 2025-2030

Chart on Israel - Market size and forecast 2025-2030 ($ million)
Data Table on Israel - Market size and forecast 2025-2030 ($ million)
Chart on Israel - Year-over-year growth 2025-2030 (%)
Data Table on Israel - Year-over-year growth 2025-2030 (%)

12.6.4 South Africa - Market size and forecast 2025-2030

Chart on South Africa - Market size and forecast 2025-2030 ($ million)
Data Table on South Africa - Market size and forecast 2025-2030 ($ million)
Chart on South Africa - Year-over-year growth 2025-2030 (%)
Data Table on South Africa - Year-over-year growth 2025-2030 (%)

12.6.5 Turkey - Market size and forecast 2025-2030

Chart on Turkey - Market size and forecast 2025-2030 ($ million)
Data Table on Turkey - Market size and forecast 2025-2030 ($ million)
Chart on Turkey - Year-over-year growth 2025-2030 (%)
Data Table on Turkey - Year-over-year growth 2025-2030 (%)

12.7 South America - Market size and forecast 2025-2030

Chart on South America - Market size and forecast 2025-2030 ($ million)
Data Table on South America - Market size and forecast 2025-2030 ($ million)
Chart on South America - Year-over-year growth 2025-2030 (%)
Data Table on South America - Year-over-year growth 2025-2030 (%)
Chart on Regional Comparison - South America
Data Table on Regional Comparison - South America

12.7.1 Brazil - Market size and forecast 2025-2030

Chart on Brazil - Market size and forecast 2025-2030 ($ million)
Data Table on Brazil - Market size and forecast 2025-2030 ($ million)
Chart on Brazil - Year-over-year growth 2025-2030 (%)
Data Table on Brazil - Year-over-year growth 2025-2030 (%)

12.7.2 Argentina - Market size and forecast 2025-2030

Chart on Argentina - Market size and forecast 2025-2030 ($ million)
Data Table on Argentina - Market size and forecast 2025-2030 ($ million)
Chart on Argentina - Year-over-year growth 2025-2030 (%)
Data Table on Argentina - Year-over-year growth 2025-2030 (%)

12.7.3 Colombia - Market size and forecast 2025-2030

Chart on Colombia - Market size and forecast 2025-2030 ($ million)
Data Table on Colombia - Market size and forecast 2025-2030 ($ million)
Chart on Colombia - Year-over-year growth 2025-2030 (%)
Data Table on Colombia - Year-over-year growth 2025-2030 (%)

12.8 Market opportunity by geography

Market opportunity by geography ($ million)
Data Tables on Market opportunity by geography ($ million)

13. Drivers, Challenges, and Opportunity

13.1 Market drivers

Generative AI infrastructure investment
Enterprise automation software adoption growth
Cross industry digital transformation demand

13.2 Market challenges

Complex global patent litigation costs
High computing resource procurement prices
Regulatory compliance and data sovereignty

13.3 Impact of drivers and challenges

Impact of drivers and challenges in 2025 and 2030

13.4 Market opportunities

Sovereign AI model licensing
Federated learning patent portfolio expansion
Edge computing intellectual property optimization

14. Competitive Landscape

14.1 Overview

14.2

Overview on criticality of inputs and factors of differentiation

14.3 Landscape disruption

Overview on factors of disruption

14.4 Industry risks

Impact of key risks on business

15. Competitive Analysis

15.1 Companies profiled

Companies covered

15.2 Company ranking index

15.3 Market positioning of companies

Matrix on companies position and classification

15.4 Accenture Plc

Accenture Plc - Overview
Accenture Plc - Business segments
Accenture Plc - Key news
Accenture Plc - Key offerings
Accenture Plc - Segment focus
SWOT

15.5 Alibaba Group Holding Ltd.

Alibaba Group Holding Ltd. - Overview
Alibaba Group Holding Ltd. - Business segments
Alibaba Group Holding Ltd. - Key offerings
Alibaba Group Holding Ltd. - Segment focus
SWOT

15.6 Amazon Web Services Inc.

Amazon Web Services Inc. - Overview
Amazon Web Services Inc. - Product / Service
Amazon Web Services Inc. - Key offerings
SWOT

15.7 Apple Inc.

Apple Inc. - Overview
Apple Inc. - Business segments
Apple Inc. - Key news
Apple Inc. - Key offerings
Apple Inc. - Segment focus
SWOT

15.8 Baidu Inc.

Baidu Inc. - Overview
Baidu Inc. - Business segments
Baidu Inc. - Key news
Baidu Inc. - Key offerings
Baidu Inc. - Segment focus
SWOT

15.9 Google LLC

Google LLC - Overview
Google LLC - Product / Service
Google LLC - Key offerings
SWOT

15.10 IBM Corp.

IBM Corp. - Overview
IBM Corp. - Business segments
IBM Corp. - Key news
IBM Corp. - Key offerings
IBM Corp. - Segment focus
SWOT

15.11 Intel Corp.

Intel Corp. - Overview
Intel Corp. - Business segments
Intel Corp. - Key news
Intel Corp. - Key offerings
Intel Corp. - Segment focus
SWOT

15.12 Meta Platforms Inc.

Meta Platforms Inc. - Overview
Meta Platforms Inc. - Business segments
Meta Platforms Inc. - Key offerings
Meta Platforms Inc. - Segment focus
SWOT

15.13 Microsoft Corp.

Microsoft Corp. - Overview
Microsoft Corp. - Business segments
Microsoft Corp. - Key news
Microsoft Corp. - Key offerings
Microsoft Corp. - Segment focus
SWOT

15.14 NVIDIA Corp.

NVIDIA Corp. - Overview
NVIDIA Corp. - Business segments
NVIDIA Corp. - Key news
NVIDIA Corp. - Key offerings
NVIDIA Corp. - Segment focus
SWOT

15.15 Oracle Corp.

Oracle Corp. - Overview
Oracle Corp. - Business segments
Oracle Corp. - Key news
Oracle Corp. - Key offerings
Oracle Corp. - Segment focus
SWOT

15.16 Salesforce Inc.

Salesforce Inc. - Overview
Salesforce Inc. - Business segments
Salesforce Inc. - Key news
Salesforce Inc. - Key offerings
Salesforce Inc. - Segment focus
SWOT

15.17 Siemens AG

Siemens AG - Overview
Siemens AG - Business segments
Siemens AG - Key news
Siemens AG - Key offerings
Siemens AG - Segment focus
SWOT

15.18 Tata Consultancy Services

Tata Consultancy Services - Overview
Tata Consultancy Services - Business segments
Tata Consultancy Services - Key offerings
Tata Consultancy Services - Segment focus
SWOT

16. Appendix

16.1 Scope of the report

Market definition
Objectives
Notes and caveats

16.2 Inclusions and exclusions checklist

Inclusions checklist
Exclusions checklist

16.3 Currency conversion rates for US$

16.4 Research methodology

16.5 Data procurement

Information sources

16.6 Data validation

16.7 Validation techniques employed for market sizing

16.8 Data synthesis

16.9 360 degree market analysis

16.10 List of abbreviations

Research Methodology

Technavio presents a detailed picture of the market by way of study, synthesis, and summation of data from multiple sources. The analysts have presented the various facets of the market with a particular focus on identifying the key industry influencers. The data thus presented is comprehensive, reliable, and the result of extensive research, both primary and secondary.

INFORMATION SOURCES

Primary sources

  • Manufacturers and suppliers
  • Channel partners
  • Industry experts
  • Strategic decision makers

Secondary sources

  • Industry journals and periodicals
  • Government data
  • Financial reports of key industry players
  • Historical data
  • Press releases

DATA ANALYSIS

Data Synthesis

  • Collation of data
  • Estimation of key figures
  • Analysis of derived insights

Data Validation

  • Triangulation with data models
  • Reference against proprietary databases
  • Corroboration with industry experts

REPORT WRITING

Qualitative

  • Market drivers
  • Market challenges
  • Market trends
  • Five forces analysis

Quantitative

  • Market size and forecast
  • Market segmentation
  • Geographical insights
  • Competitive landscape

Interested in this report?

Get your sample now to see our research methodology and insights!

Download Now

Frequently Asked Questions

AI IP And Licensing market growth will increase by USD 41349.0 million during 2026-2030.

The AI IP And Licensing market is expected to grow at a CAGR of 29.8% during 2026-2030.

AI IP And Licensing market is segmented by Type (Patents, Copyrights, Trade secrets, Trademarks) License model (Proprietary licenses, Subscription-based licenses, Open-source licenses, Hybrid licenses, Others) End-user (BFSI, Healthcare, Automotive, Retail and e-commerce, Others)

Accenture Plc, Alibaba Group Holding Ltd., Amazon Web Services Inc., Apple Inc., Baidu Inc., CEVA Inc., Google LLC, IBM Corp., Intel Corp., InterDigital Inc., Meta Platforms Inc., Microsoft Corp., NVIDIA Corp., Oracle Corp., Qualcomm Inc., Salesforce Inc., SAP SE, Siemens AG, SoftBank Group Corp., Tata Consultancy Services are a few of the key vendors in the AI IP And Licensing market.

North America will register the highest growth rate of 36.1% among the other regions. Therefore, the AI IP And Licensing market in North America is expected to garner significant business opportunities for the vendors during the forecast period.

US, Canada, Mexico, Germany, UK, France, Italy, Spain, Russia, China, Japan, India, South Korea, Australia, Singapore, UAE, Saudi Arabia, Israel, South Africa, Turkey, Brazil, Argentina, Colombia

  • Generative AI infrastructure investment is the driving factor this market.

The AI IP And Licensing market vendors should focus on grabbing business opportunities from the Type segment as it accounted for the largest market share in the base year.
RIA - Research AI Assistant
Ask RIA