
Ai-powered Emotion Analytics Platform Market Size 2025-2029
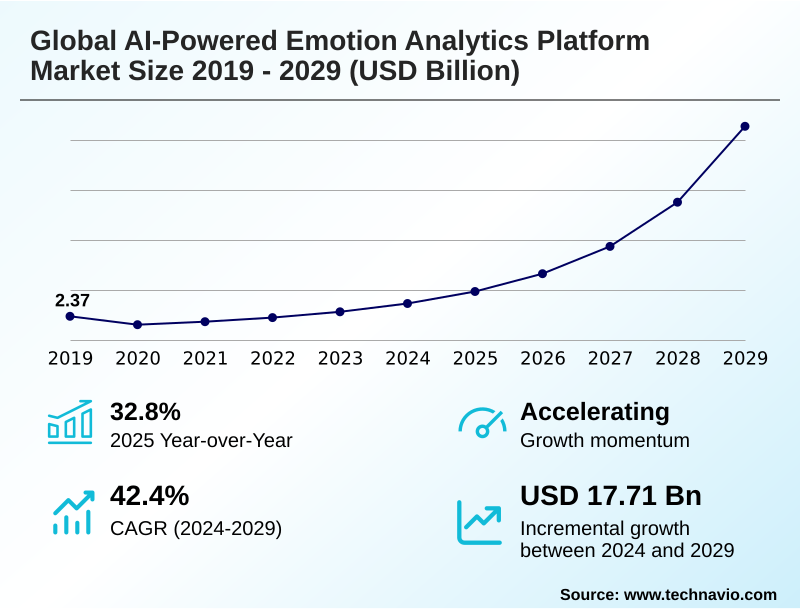
The ai-powered emotion analytics platform market size is valued to increase by USD 17.71 billion, at a CAGR of 42.4% from 2024 to 2029. Escalating demand for hyper-personalized customer and user experiences will drive the ai-powered emotion analytics platform market.
Major Market Trends & Insights
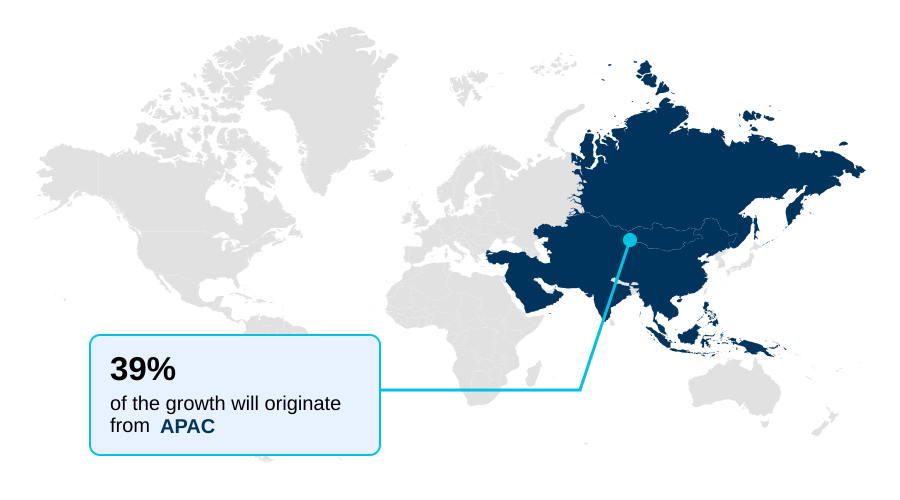
- APAC dominated the market and accounted for a 39.4% growth during the forecast period.
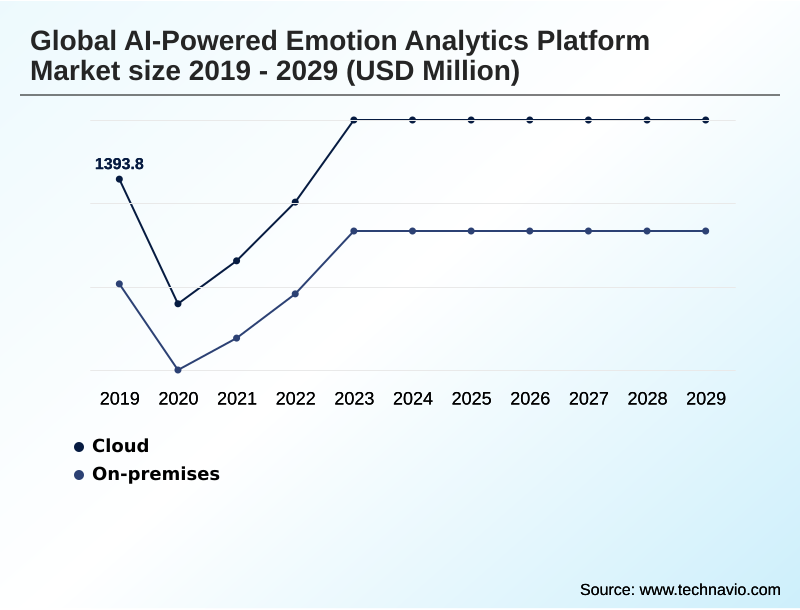
- By Deployment - Cloud segment was valued at USD 1.63 billion in 2023
- By Technology - Facial recognition segment accounted for the largest market revenue share in 2023
Market Size & Forecast
- Market Opportunities: USD 19.00 billion
- Market Future Opportunities: USD 17.71 billion
- CAGR from 2024 to 2029 : 42.4%
Market Summary
- The AI-powered emotion analytics platform market is transitioning from a niche technology into a strategic business tool. This evolution is driven by the enterprise need for hyper-personalized customer engagement, moving beyond basic metrics to understand the emotional drivers of behavior.
- Advanced platforms now use multimodal emotion recognition, combining inputs like facial coding and voice prosody analysis to create a holistic view of user sentiment. In a practical business scenario, a contact center can deploy tonal emotion detection and conversational intelligence to analyze customer interactions in real-time.
- This allows for immediate agent coaching on empathetic communication and can de-escalate issues before they impact satisfaction scores. However, the industry grapples with significant challenges related to data privacy and the potential for algorithmic bias, making ethical implementation and transparent data governance critical for sustainable adoption and maintaining consumer trust.
- The technology's expansion into areas like healthcare and automotive safety further underscores its growing importance.
What will be the Size of the Ai-powered Emotion Analytics Platform Market during the forecast period?
Get Key Insights on Market Forecast (PDF) Request Free Sample
How is the Ai-powered Emotion Analytics Platform Market Segmented?
The ai-powered emotion analytics platform industry research report provides comprehensive data (region-wise segment analysis), with forecasts and estimates in "USD million" for the period 2025-2029, as well as historical data from 2019-2023 for the following segments.
- Deployment
- Cloud
- On-premises
- Technology
- Facial recognition
- Speech analysis
- Text-based emotion detection
- Multimodal emotion recognition
- End-user
- Healthcare
- Automotive
- Retail and e-commerce
- Media and entertainment
- Others
- Geography
- APAC
- China
- Japan
- India
- North America
- US
- Canada
- Mexico
- Europe
- Germany
- UK
- France
- South America
- Brazil
- Argentina
- Colombia
- Middle East and Africa
- Saudi Arabia
- UAE
- South Africa
- Rest of World (ROW)
- APAC
By Deployment Insights
The cloud segment is estimated to witness significant growth during the forecast period.
The cloud deployment model dominates the AI-powered emotion analytics platform market, offering critical scalability and cost-efficiency.
This model democratizes access to sophisticated tools for emotional state assessment and AI-powered consumer research, allowing organizations to leverage pay-per-use APIs without significant upfront infrastructure investment.
The inherent scalability is essential for processing computationally intensive tasks like multi-modal analysis and voice-driven emotion analytics in real-time.
For instance, integration with existing enterprise systems through these cloud services has been shown to reduce implementation timelines by over 40% compared to on-premise setups.
This agility enables businesses to rapidly embed capabilities like sentiment analysis and emotion and behavior sensing into workflows, accelerating the time to value for gaining emotional and behavioral insights from customer interactions.
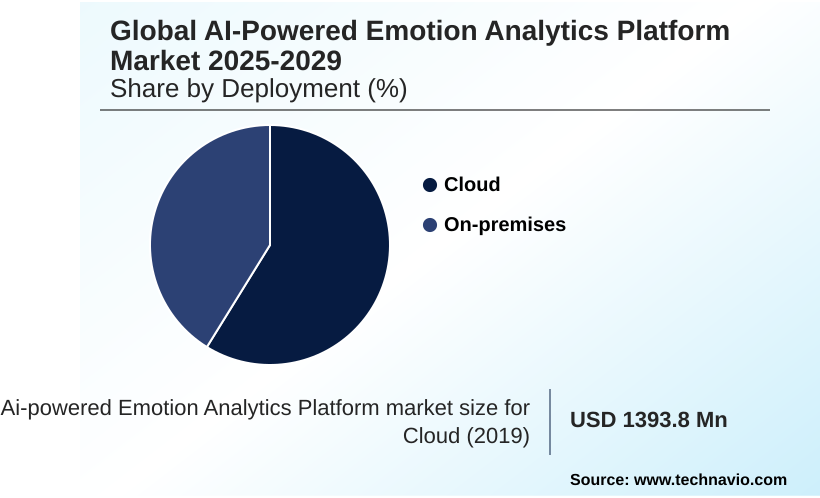
The Cloud segment was valued at USD 1.63 billion in 2023 and showed a gradual increase during the forecast period.
Regional Analysis
APAC is estimated to contribute 39.4% to the growth of the global market during the forecast period.Technavio’s analysts have elaborately explained the regional trends and drivers that shape the market during the forecast period.
See How Ai-powered Emotion Analytics Platform Market Demand is Rising in APAC Request Free Sample
North America remains a mature and dominant region in the AI-powered emotion analytics platform market, characterized by high adoption and technological innovation.
However, the most significant expansion is occurring in APAC, which is projected to contribute over 39% of the market's incremental growth. This surge is largely driven by regulatory mandates and rapid digitalization.
For instance, new automotive safety protocols in China have accelerated the adoption rate of in-cabin sensing AI for driver monitoring by more than 50% in new vehicle models.
This top-down push for technologies that provide emotional and behavioral insights is creating a massive demand for platforms capable of emotion detection in embedded systems, solidifying APAC's position as the primary growth engine for the foreseeable future.
Market Dynamics
Our researchers analyzed the data with 2024 as the base year, along with the key drivers, trends, and challenges. A holistic analysis of drivers will help companies refine their marketing strategies to gain a competitive advantage.
- The strategic application of AI for hyper-personalized customer experiences is rapidly maturing, moving beyond simple analytics to sophisticated, real-time engagement. The evolution from sentiment analysis vs nuanced emotion detection is evident as organizations deploy generative AI for empathetic chatbots and integrate text-based emotion detection in CRM platforms.
- This shift is particularly impactful in retail, where the ROI of emotion analytics in retail is measured through enhanced customer loyalty and increased conversion rates. Concurrently, emotion analytics for driver monitoring systems is becoming a standard safety feature, driven by stringent regulations.
- In healthcare, the use of voice biomarkers for mental health screening and emotion analytics in telehealth consultations is opening new frontiers for patient care. The development of AI-powered tutoring systems using engagement scores showcases the technology's potential in education.
- However, this expansion brings challenges, including the need for compliance with GDPR for biometric data and addressing the complexities of cross-cultural emotion recognition. The industry is also focused on overcoming technical hurdles like comparing facial coding and speech analysis accuracy and mitigating algorithmic bias in facial expression recognition.
- Advanced applications in emotion AI for human-robot interaction and fraud detection with voice stress analysis are pushing the boundaries, while a focus on edge computing for real-time emotion analytics and privacy-preserving emotion detection techniques addresses key performance and ethical concerns. In fact, systems deploying privacy-preserving techniques have shown to build consumer trust twice as effectively as those without.
What are the key market drivers leading to the rise in the adoption of Ai-powered Emotion Analytics Platform Industry?
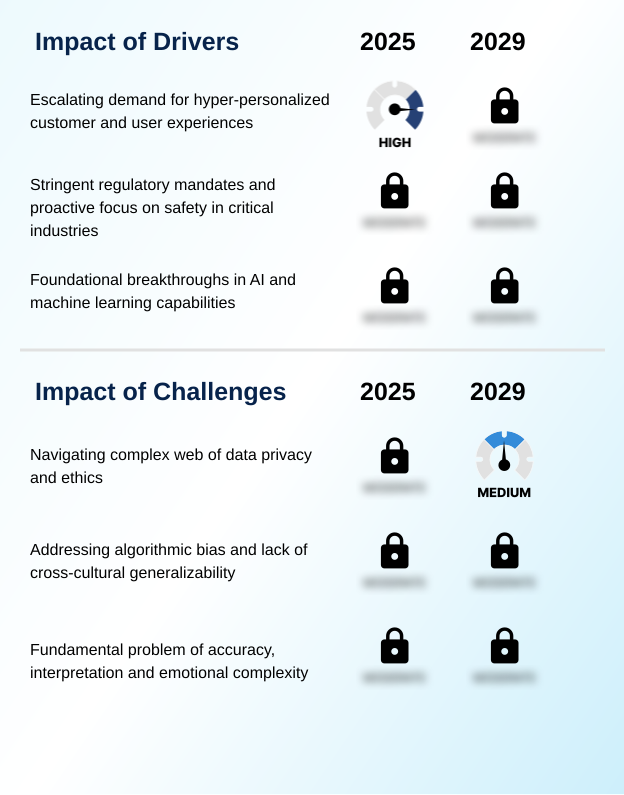
- The escalating demand for hyper-personalized customer and user experiences is a primary driver fueling the market's growth.
- The market is primarily driven by the escalating demand for hyper-personalized customer experiences and stringent regulatory mandates. Businesses are leveraging AI-powered emotion analytics to gain deep emotional and behavioral insights, with implementations reporting an 18% uplift in customer lifetime value.
- This granular understanding of consumer behavior and UX testing is critical for differentiation. Concurrently, regulatory actions in the automotive sector have spurred a near-100% adoption rate of in-cabin sensing AI for new vehicles receiving top safety ratings in key markets.
- These drivers, underpinned by foundational breakthroughs in AI, are creating sustained, large-scale demand for advanced platforms capable of real-time sentiment prediction and delivering emotionally resonant user engagement.
What are the market trends shaping the Ai-powered Emotion Analytics Platform Industry?
- The ascendancy of multimodal emotion AI represents a significant trend, enabling a more holistic understanding of human sentiment. This approach integrates multiple data streams for superior analytical depth and accuracy.
- A dominant trend is the definitive shift toward multimodal emotion recognition, which delivers a more holistic and accurate emotional state assessment. These systems, integrating inputs from facial expression recognition, speech analysis, and text, have demonstrated up to a 20% increase in accuracy over unimodal methods.
- Another critical trend is the move to real-time, edge-based processing for emotion detection in embedded systems. This architecture addresses privacy concerns and performance demands by analyzing data locally, reducing latency by over 95% in critical applications like in-cabin monitoring.
- This trend facilitates a new wave of intelligent devices with built-in awareness, transforming human-machine interaction and enabling more responsive, personalized experiences across consumer electronics and industrial automation.
What challenges does the Ai-powered Emotion Analytics Platform Industry face during its growth?
- Navigating the complex web of data privacy regulations and ethical considerations poses a significant challenge to the industry's growth.
- A fundamental challenge for the market is addressing algorithmic bias and ensuring cross-cultural generalizability. Independent audits have revealed that error rates for facial coding and recognition can be up to 35% higher for underrepresented demographic groups, creating a risk of inequitable outcomes.
- Furthermore, navigating the complex web of data privacy and ethics, especially with regulations like GDPR, remains a primary hurdle. Implementing privacy-by-design principles to safeguard sensitive biometric data can increase initial development costs by 15-20%, a necessary investment to mitigate long-term legal risks and build consumer trust.
- The inherent emotional complexity and the difficulty in accurately mapping external expressions to internal feelings present a persistent accuracy ceiling for the technology.
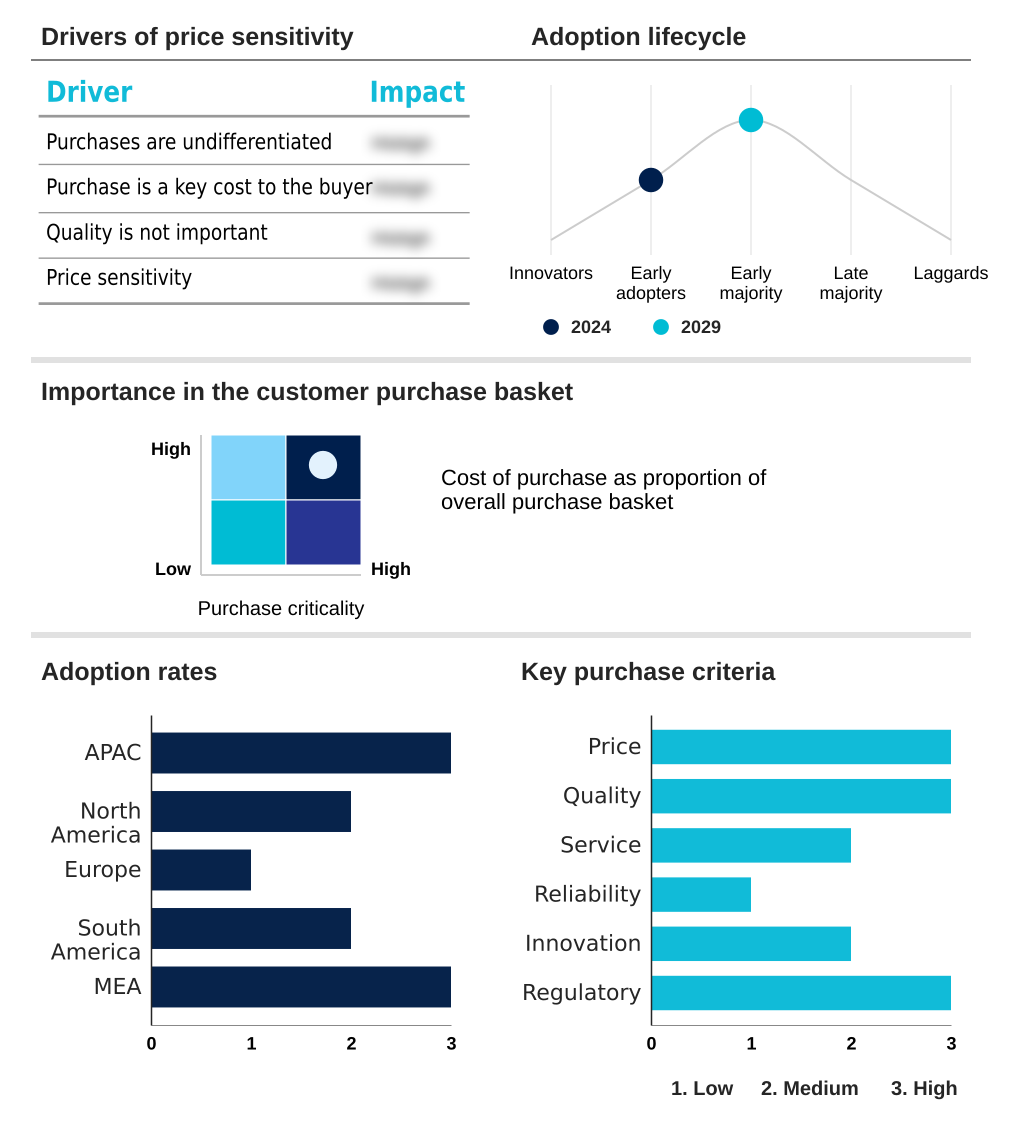
Exclusive Technavio Analysis on Customer Landscape
The ai-powered emotion analytics platform market forecasting report includes the adoption lifecycle of the market, covering from the innovator’s stage to the laggard’s stage. It focuses on adoption rates in different regions based on penetration. Furthermore, the ai-powered emotion analytics platform market report also includes key purchase criteria and drivers of price sensitivity to help companies evaluate and develop their market growth analysis strategies.
Customer Landscape of Ai-powered Emotion Analytics Platform Industry
Competitive Landscape
Companies are implementing various strategies, such as strategic alliances, ai-powered emotion analytics platform market forecast, partnerships, mergers and acquisitions, geographical expansion, and product/service launches, to enhance their presence in the industry.
Affectiva Inc. - The AI-powered platform provides multimodal emotion analysis, leveraging facial coding and voice analytics to deliver nuanced insights for automotive, media, and healthcare applications.
The industry research and growth report includes detailed analyses of the competitive landscape of the market and information about key companies, including:
- Affectiva Inc.
- Amazon.com Inc.
- Ascribe
- BeEmotion.ai
- BeyondVerbal
- Cognovi Labs Inc.
- Emotibot Technologies
- Entropik Technologies Pvt. Ltd
- Eyeris Technologies Inc.
- Google Cloud
- IBM Corp.
- Kairos AR Inc.
- Microsoft Corp.
- Morphcast Inc.
- Opsis Pte. Ltd.
- Realeyes
- Tobii AB
- Uniphore Technologies Inc.
- Wayvee Analytics
Qualitative and quantitative analysis of companies has been conducted to help clients understand the wider business environment as well as the strengths and weaknesses of key industry players. Data is qualitatively analyzed to categorize companies as pure play, category-focused, industry-focused, and diversified; it is quantitatively analyzed to categorize companies as dominant, leading, strong, tentative, and weak.
Recent Development and News in Ai-powered emotion analytics platform market
- In August, 2024, a prominent AI research lab announces the commercial launch of its Empathic Voice Interface API, enabling developers to build applications with real-time emotional understanding and generation capabilities for more natural human-computer interaction.
- In November, 2024, a leading European automaker confirms it will equip its entire new vehicle lineup with advanced Driver Monitoring Systems that meet the latest Euro NCAP 2025 protocols, utilizing AI for in-cabin sensing from a specialized technology partner.
- In March, 2025, a digital health company receives FDA clearance for its AI-powered voice biomarker technology as a clinical screening tool for early-stage cognitive decline, following the successful completion of large-scale trials.
- In May, 2025, a major cloud provider launches a new suite of multimodal emotion AI services within its enterprise AI platform, offering integrated analysis of video, audio, and text through a single, unified API call for business clients.
Dive into Technavio’s robust research methodology, blending expert interviews, extensive data synthesis, and validated models for unparalleled Ai-powered Emotion Analytics Platform Market insights. See full methodology.
| Market Scope | |
|---|---|
| Page number | 314 |
| Base year | 2024 |
| Historic period | 2019-2023 |
| Forecast period | 2025-2029 |
| Growth momentum & CAGR | Accelerate at a CAGR of 42.4% |
| Market growth 2025-2029 | USD 17713.2 million |
| Market structure | Fragmented |
| YoY growth 2024-2025(%) | 32.8% |
| Key countries | China, Japan, India, Australia, South Korea, Indonesia, US, Canada, Mexico, Germany, UK, France, The Netherlands, Italy, Spain, Brazil, Argentina, Colombia, Saudi Arabia, UAE, South Africa, Israel and Turkey |
| Competitive landscape | Leading Companies, Market Positioning of Companies, Competitive Strategies, and Industry Risks |
Research Analyst Overview
- The AI-powered emotion analytics platform market is defined by a rapid technological evolution, moving from standalone tools to deeply integrated systems. Foundational platforms now leverage sophisticated techniques like facial recognition, speech analysis, and text-based emotion detection, powered by models such as the Gemini API and PaliGemma models.
- The industry relies on advanced datasets like the GoEmotions dataset and FER+ dataset for training. Innovations in multimodal emotion recognition combine these inputs with behavioral psychology and physiological metrics like heart rate variability and breathing patterns for a more holistic understanding.
- Boardroom decisions on product strategy are now directly influenced by the need for real-time capabilities, driving the adoption of human-machine empathy modeling and conversational intelligence. In practice, platforms utilizing RF wave-based sensing have demonstrated a 30% improvement in accuracy for detecting emotional states in crowded environments.
- Core technologies range from facial coding and gaze tracking to Layered Voice Analysis and Watson Natural Language Understanding, with solutions like the Azure Emotion API and ai.analyze_sentiment function making deployment more accessible. This competitive landscape fosters continuous improvement in C-SAT scoring, tonal emotion detection, and multi-modal analysis for applications from in-cabin sensing AI to nuanced customer service via U-Assist.
What are the Key Data Covered in this Ai-powered Emotion Analytics Platform Market Research and Growth Report?
-
What is the expected growth of the Ai-powered Emotion Analytics Platform Market between 2025 and 2029?
-
USD 17.71 billion, at a CAGR of 42.4%
-
-
What segmentation does the market report cover?
-
The report is segmented by Deployment (Cloud, On-premises), Technology (Facial recognition, Speech analysis, Text-based emotion detection, Multimodal emotion recognition), End-user (Healthcare, Automotive, Retail and e-commerce, Media and entertainment, Others) and Geography (APAC, North America, Europe, South America, Middle East and Africa)
-
-
Which regions are analyzed in the report?
-
APAC, North America, Europe, South America and Middle East and Africa
-
-
What are the key growth drivers and market challenges?
-
Escalating demand for hyper-personalized customer and user experiences, Navigating complex web of data privacy and ethics
-
-
Who are the major players in the Ai-powered Emotion Analytics Platform Market?
-
Affectiva Inc., Amazon.com Inc., Ascribe, BeEmotion.ai, BeyondVerbal, Cognovi Labs Inc., Emotibot Technologies, Entropik Technologies Pvt. Ltd, Eyeris Technologies Inc., Google Cloud, IBM Corp., Kairos AR Inc., Microsoft Corp., Morphcast Inc., Opsis Pte. Ltd., Realeyes, Tobii AB, Uniphore Technologies Inc. and Wayvee Analytics
-
Market Research Insights
- The AI-powered emotion analytics platform market is defined by its increasing integration into core business operations, yielding measurable outcomes. For example, AI-powered consumer research now delivers emotional and behavioral insights that improve marketing campaign engagement by over 30% compared to traditional survey methods.
- In the automotive sector, advanced in-cabin monitoring systems enhance safety by providing a more accurate emotional state assessment, reducing false alerts for driver fatigue by nearly 25%. This progress in human-machine interaction is fueled by a demand for real-time sentiment prediction, transforming how industries approach everything from customer service to product design.
- As organizations seek deeper connections with users, technologies enabling nuanced emotion and behavior sensing are becoming essential for creating competitive differentiation and operational excellence.
We can help! Our analysts can customize this ai-powered emotion analytics platform market research report to meet your requirements.
 RIA -
RIA - 
