AI-Powered Radio Access Network Market Analysis, Size, and Forecast 2025-2029: North America (US and Canada), Europe (France, Germany, and UK), APAC (Australia, China, India, Japan, and South Korea), and Rest of World (ROW)

AI-Powered Radio Access Network Market Analysis, Size, and Forecast 2025-2029:
North America (US and Canada), Europe (France, Germany, and UK), APAC (Australia, China, India, Japan, and South Korea), and Rest of World (ROW)

Published: Aug 2025 227 Pages SKU: IRTNTR80930

Market Overview at a Glance

$2.36 B
Market Opportunity
45.6%
CAGR
41.8
YoY growth 2024-2025(%)

AI-Powered Radio Access Network Market Size 2025-2029

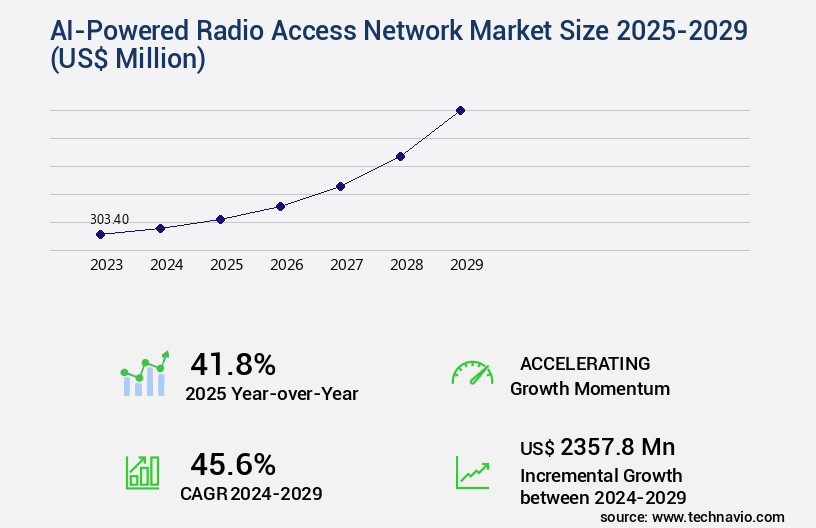
The ai-powered radio access network market size is valued to increase by USD 2.36 billion, at a CAGR of 45.6% from 2024 to 2029. Escalating complexity of 5G and future networks will drive the ai-powered radio access network market.

Major Market Trends & Insights

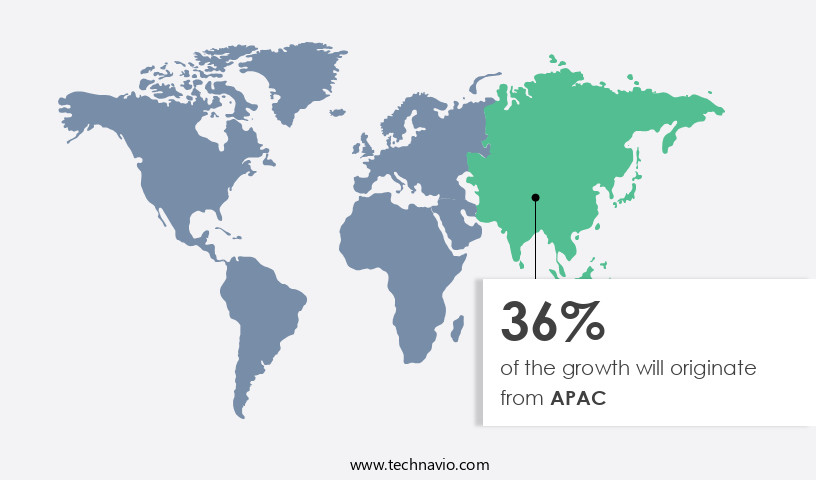
  • APAC dominated the market and accounted for a 36% growth during the forecast period.
  • By Component - Hardware segment was valued at USD 0.00 billion in 2023
  • By Type - Hybrid RAN segment accounted for the largest market revenue share in 2023

Market Size & Forecast

  • Market Opportunities: USD 817.30 million
  • Market Future Opportunities: USD 2357.80 million
  • CAGR from 2024 to 2029 : 45.6%

Market Summary

  • In the dynamic telecommunications industry, the integration of Artificial Intelligence (AI) into Radio Access Networks (RAN) is revolutionizing network operations. According to a recent study, the global AI-powered RAN market is projected to reach a value of USD12.5 billion by 2026, underscoring its growing significance. AI's role in RANs is multifaceted, with its primary function being to manage the escalating complexity of 5G and future networks. By automating network optimization, AI enables service providers to deliver superior network performance, reduce latency, and enhance user experience. Moreover, AI models analyze vast amounts of data in real-time, ensuring network efficiency and reliability.
  • However, the implementation of AI in RANs presents challenges, primarily concerning data complexity and model trustworthiness. Ensuring the accuracy and reliability of AI models is crucial, as any inaccuracies could lead to network disruptions and suboptimal performance. To address this, providers are investing in advanced AI algorithms and machine learning techniques, enabling self-learning networks that continuously adapt to changing network conditions. In summary, the integration of AI into Radio Access Networks is a game-changer for the telecommunications industry. By automating network optimization, enhancing user experience, and ensuring network reliability, AI is paving the way for the next generation of networks.
  • The market's growth, projected to reach USD12.5 billion by 2026, underscores the potential of this technology.

What will be the Size of the AI-Powered Radio Access Network Market during the forecast period?

AI-Powered Radio Access Network Market Size

Get Key Insights on Market Forecast (PDF) Request Free Sample

How is the AI-Powered Radio Access Network Market Segmented ?

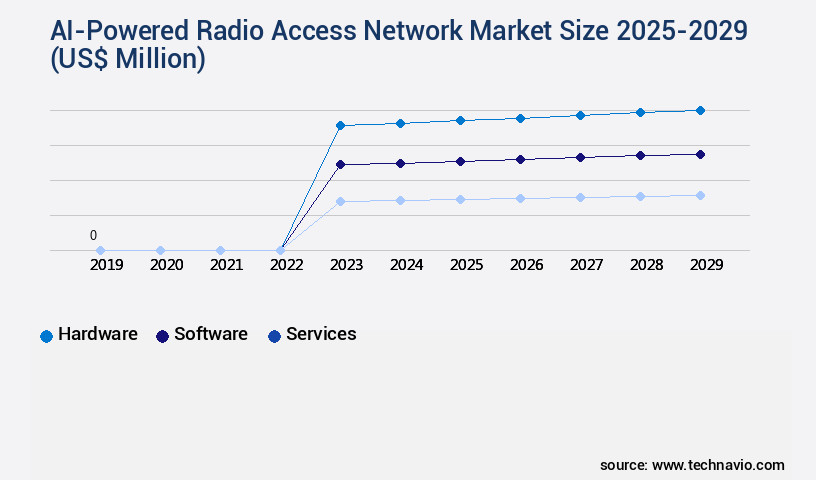
The ai-powered radio access network industry research report provides comprehensive data (region-wise segment analysis), with forecasts and estimates in "USD million" for the period 2025-2029, as well as historical data from 2019-2023 for the following segments.

  • Component
    • Hardware
    • Software
    • Services
  • Type
    • Hybrid RAN
    • Virtualized RAN
    • Open RAN
  • Deployment
    • On-premises
    • Cloud
  • Geography
    • North America
      • US
      • Canada
    • Europe
      • France
      • Germany
      • UK
    • APAC
      • Australia
      • China
      • India
      • Japan
      • South Korea
    • Rest of World (ROW)

    By Component Insights

    The hardware segment is estimated to witness significant growth during the forecast period.

    The AI-powered Radio Access Network (RAN) market is witnessing significant evolution, with an increasing emphasis on intelligent network operations. Key technologies driving this trend include ran intelligent slicing, ai-driven network optimization, and network capacity planning. The implementation of 5G network automation, powered by signal processing algorithms and ai-based anomaly detection, is a critical component of this evolution. Open RAN architecture, software-defined networking, and virtualized RAN are increasingly popular, enabling energy efficiency metrics and data analytics platform integration. Deployment automation tools, radio resource management, network virtualization infrastructure, predictive network maintenance, and network slicing technology are all integral parts of this transformation.

    Furthermore, cloud-native RAN, network function virtualization, spectrum allocation algorithms, network security protocols, user equipment management, self-organizing networks, and service level agreements are essential elements of the modern RAN landscape. A recent study projects that AI-driven RAN technologies will account for over 30% of global RAN investments by 2025. This underscores the market's potential for continuous growth and innovation.

    AI-Powered Radio Access Network Market Size

    Request Free Sample

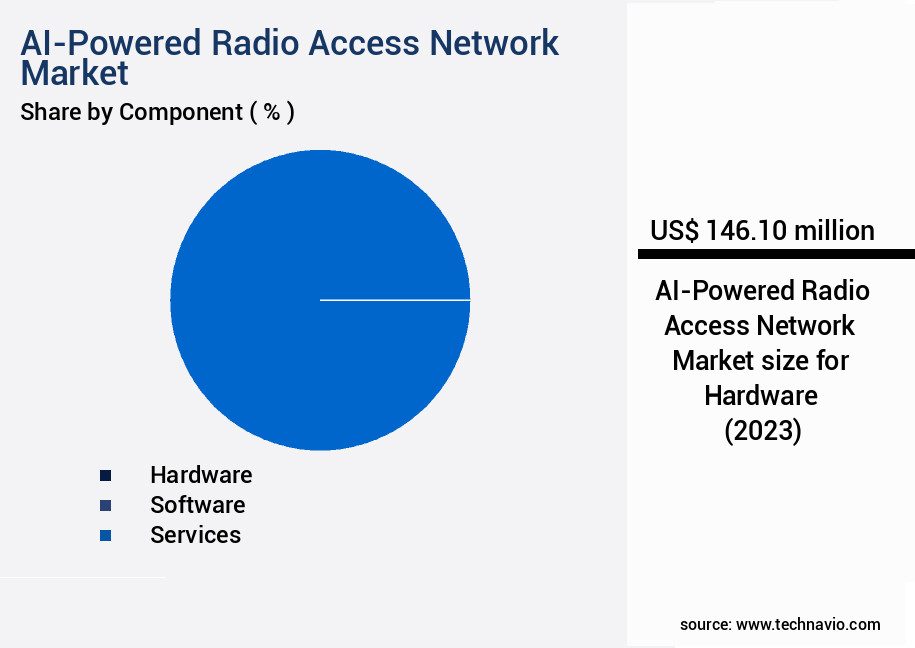
    The Hardware segment was valued at USD 0.00 billion in 2019 and showed a gradual increase during the forecast period.

    AI-Powered Radio Access Network Market Size

    Request Free Sample

    Regional Analysis

    APAC is estimated to contribute 36% to the growth of the global market during the forecast period.Technavio’s analysts have elaborately explained the regional trends and drivers that shape the market during the forecast period.

    AI-Powered Radio Access Network Market Share by Geography

    See How AI-Powered Radio Access Network Market Demand is Rising in APAC Request Free Sample

    The Asia-Pacific market for AI-powered radio access networks is the largest and most dynamic, accommodating advanced mobile networks in technologically innovative countries and emerging economies. Notably, Rakuten Mobile in Japan has spearheaded network virtualization and automation, establishing a global benchmark for cloud-native, AI-driven network architectures. The region's robust ecosystem comprises significant contributors like Samsung, NEC, and Fujitsu, who are instrumental in Open RAN and AI-integrated network solutions.

    The vast networks in countries such as India and China necessitate AI adoption, enabling efficient management of network intricacies, optimal performance for billions of subscribers, and cost-effective 5G implementations.

    Market Dynamics

    Our researchers analyzed the data with 2024 as the base year, along with the key drivers, trends, and challenges. A holistic analysis of drivers will help companies refine their marketing strategies to gain a competitive advantage.

    The global AI-powered radio access network (RAN) market is experiencing significant growth as communication service providers (CSPs) seek to optimize their networks for the next generation of connectivity - 5G. AI algorithms for RAN optimization play a crucial role in this transition, enabling intelligent resource allocation techniques, self-organizing network performance, and predictive maintenance using machine learning. One of the key features of 5G networks is network slicing implementation, which requires a high degree of automation and flexibility. Open RAN ecosystem development is a critical aspect of this, allowing for cloud native RAN deployment and virtualized RAN architecture design. However, challenges remain in ensuring seamless integration and deployment automation for 5G networks. Network function virtualization (NFV) benefits include improved network capacity planning and energy efficiency in 5G networks. AI-powered anomaly detection in RAN is another important application, enabling real-time identification and resolution of network issues. Dynamic spectrum access implementation is also a key area of focus, allowing for more efficient use of available spectrum. Latency reduction in mobile networks is a major priority for CSPs, and AI algorithms are essential for optimizing radio resource management and network security protocols for 5G. Automated network configuration tools and self-healing capabilities are also important for ensuring network reliability and availability. In conclusion, the global AI-powered RAN market is poised for significant growth as CSPs seek to optimize their networks for 5G. Key applications include AI algorithms for RAN optimization, 5G network slicing implementation, open RAN ecosystem development, intelligent resource allocation techniques, self-organizing network performance, predictive maintenance using machine learning, dynamic spectrum access implementation, improved network capacity planning, radio resource management optimization, energy efficiency in 5G networks, latency reduction in mobile networks, virtualized RAN architecture design, 5G core network integration with RAN, and network security protocols for 5G. Deployment automation for 5G networks is also a critical aspect of this transition, ensuring seamless integration and efficient operation of these advanced networks.

    AI-Powered Radio Access Network Market Size

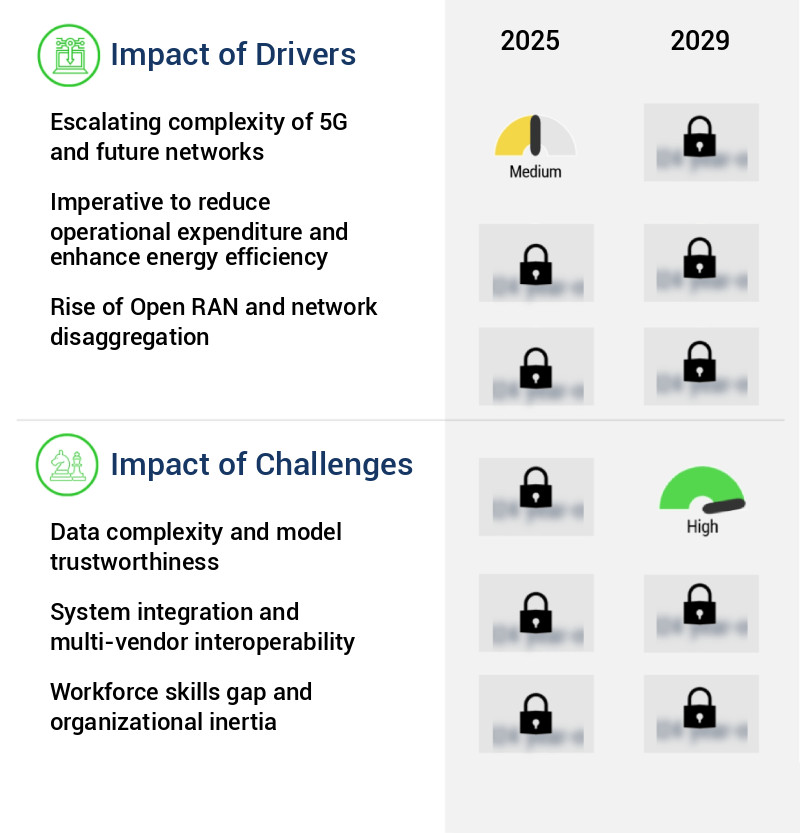
    What are the key market drivers leading to the rise in the adoption of AI-Powered Radio Access Network Industry?

    • The escalating complexity of 5G and future networks serves as the primary catalyst for market growth. 

    • The evolution of the AI-Powered Radio Access Network (RAN) market is characterized by the integration of advanced technologies, such as massive Multiple Input Multiple Output (MIMO), dynamic spectrum sharing, and network slicing, which have significantly increased the complexity of cellular networks. This architectural and operational intricacy is a marked departure from previous generations, with the sheer volume of configurable parameters necessitating a shift from manual management and optimization methods. For instance, network slicing, a critical component of 5G monetization, involves creating multiple virtual networks on a single physical infrastructure, each with guaranteed quality of service for diverse applications.
    • The real-time interplay between these parameters demands an automated, intelligent approach to RAN management. This shift toward AI-driven RAN optimization is crucial for ensuring optimal network performance and efficient resource utilization in the era of 5G and beyond.

    What are the market trends shaping the AI-Powered Radio Access Network Industry?

    • Generative AI is emerging as a significant trend in network operations. Network operations are set to be transformed by the adoption of generative AI technology.

    • The market is undergoing a transformative shift, with the integration of Generative AI, specifically Large Language Models (LLMs,) becoming increasingly prevalent. This evolution goes beyond the traditional use of predictive AI for optimization tasks such as traffic forecasting and anomaly detection. Instead, it focuses on developing conversational, cognitive systems that can interact with complex network data using natural language. Telecommunications companies are actively exploring the creation of Telco LLMs, which are founded on extensive, domain-specific datasets encompassing technical manuals, network performance logs, alarm descriptions, trouble tickets, and configuration files.
    • This significant evolution signifies a surge in the application of AI technology in the telecommunications sector, enhancing network management and optimization capabilities.

    What challenges does the AI-Powered Radio Access Network Industry face during its growth?

    • The intersection of data complexity and model trustworthiness poses a significant challenge to the growth of the industry, requiring professionals to ensure the accuracy, reliability, and ethical use of data in machine learning models. 

    • The AI-Powered Radio Access Network (RAN) market is experiencing significant evolution, driven by the increasing demand for intelligent network management and optimization in various sectors. Modern 5G networks generate vast amounts of data, characterized by high volume, velocity, and variety. This data, essential for effective AI models, includes signal strength indicators, traffic volumes, user mobility patterns, and interference levels. However, harnessing this data poses a formidable challenge. The initial hurdle is data acquisition, cleaning, and labeling. Raw network data is often noisy, incomplete, and unstructured.
    • Despite these complexities, the benefits of AI in RAN are undeniable. For instance, AI can enhance network performance by predicting congestion, optimizing resource allocation, and detecting anomalies. Furthermore, it can improve network reliability by predicting and mitigating potential failures. The integration of AI in RAN is expected to lead to more efficient network operations and enhanced user experiences.

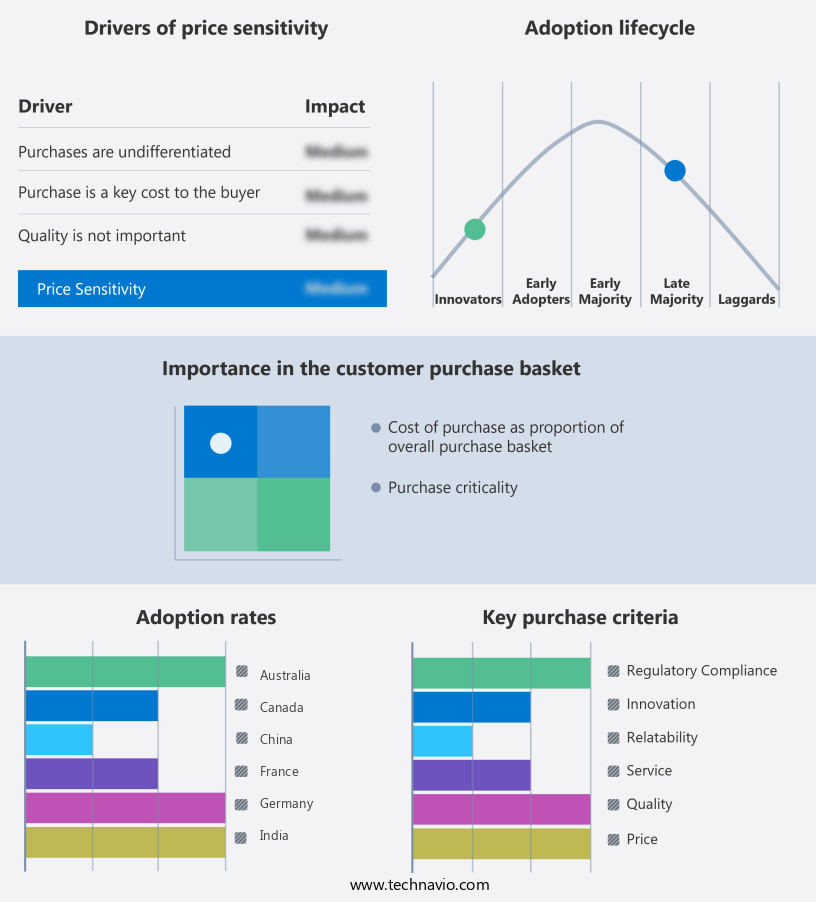
    Exclusive Technavio Analysis on Customer Landscape

    The ai-powered radio access network market forecasting report includes the adoption lifecycle of the market, covering from the innovator’s stage to the laggard’s stage. It focuses on adoption rates in different regions based on penetration. Furthermore, the ai-powered radio access network market report also includes key purchase criteria and drivers of price sensitivity to help companies evaluate and develop their market growth analysis strategies.

    AI-Powered Radio Access Network Market Share by Geography

     Customer Landscape of AI-Powered Radio Access Network Industry

    Competitive Landscape

    Companies are implementing various strategies, such as strategic alliances, ai-powered radio access network market forecast, partnerships, mergers and acquisitions, geographical expansion, and product/service launches, to enhance their presence in the industry.

    Airspan Networks Holdings Inc. - This company specializes in AI-enhanced radio access network technologies, including advanced 5G chipsets and connectivity solutions. These innovations streamline RAN processing and network automation through artificial intelligence.

    The industry research and growth report includes detailed analyses of the competitive landscape of the market and information about key companies, including:

    • Airspan Networks Holdings Inc.
    • Broadcom Inc.
    • Cisco Systems Inc.
    • CommScope Holding Co. Inc.
    • DeepSig Inc.
    • Fujitsu Ltd.
    • Huawei Technologies Co. Ltd.
    • Intel Corp.
    • Mavenir Systems Inc.
    • NEC Corp.
    • Nokia Corp.
    • NVIDIA Corp.
    • Parallel Wireless Inc.
    • Qualcomm Inc.
    • Radisys Corp.
    • Rakuten Group Inc.
    • Samsung Electronics Co. Ltd.
    • Telefonaktiebolaget LM Ericsson
    • Wind River Systems Inc.
    • ZTE Corp.

    Qualitative and quantitative analysis of companies has been conducted to help clients understand the wider business environment as well as the strengths and weaknesses of key industry players. Data is qualitatively analyzed to categorize companies as pure play, category-focused, industry-focused, and diversified; it is quantitatively analyzed to categorize companies as dominant, leading, strong, tentative, and weak.

    Recent Development and News in AI-Powered Radio Access Network Market

    • In January 2024, Nokia and Intel collaborated to develop AI-powered radio access networks, integrating Intel's FPGA technology with Nokia's AirFrame data center solution (Nokia press release). This partnership aimed to enhance network efficiency and flexibility, reducing latency and improving overall performance.
    • In March 2024, Huawei announced the commercial deployment of its AI-driven 5G base station in China, increasing network capacity and reducing energy consumption by 30% (Huawei press release). This technological advancement showcased Huawei's commitment to AI-driven network innovation.
    • In April 2025, Ericsson secured a significant contract with Verizon to deploy AI-powered 5G radio access networks across the US, valued at USD3 billion (Bloomberg). This strategic partnership aimed to improve network performance, reduce operational costs, and enhance customer experience.
    • In May 2025, the European Union approved the merger of Nokia and Alcatel-Lucent, creating a leading player in the market (European Commission press release). The combined entity, with a market share of approximately 30%, will accelerate innovation and competition in the sector.

    Dive into Technavio’s robust research methodology, blending expert interviews, extensive data synthesis, and validated models for unparalleled AI-Powered Radio Access Network Market insights. See full methodology.

    Market Scope

    Report Coverage

    Details

    Page number

    227

    Base year

    2024

    Historic period

    2019-2023

    Forecast period

    2025-2029

    Growth momentum & CAGR

    Accelerate at a CAGR of 45.6%

    Market growth 2025-2029

    USD 2357.8 million

    Market structure

    Fragmented

    YoY growth 2024-2025(%)

    41.8

    Key countries

    China, Japan, South Korea, India, Australia, Germany, UK, France, US, and Canada

    Competitive landscape

    Leading Companies, Market Positioning of Companies, Competitive Strategies, and Industry Risks

    Request Free Sample

    Research Analyst Overview

    • The AI-powered Radio Access Network (RAN) market continues to evolve, driven by the integration of intelligent technologies such as Ran Intelligent Slicing and AI-driven network optimization. These innovations enable network capacity planning and 5G network automation, enhancing network performance and efficiency. Signal processing algorithms and AI-based anomaly detection play a crucial role in ensuring network reliability and reducing energy consumption. Open RAN architecture and software-defined networking are gaining traction, offering flexibility and deployment automation tools for service providers. Network virtualization infrastructure, predictive network maintenance, and network slicing technology are transforming the way networks are managed, enabling better resource allocation and network virtualization.
    • The industry anticipates significant growth, with expectations of a 30% increase in RAN infrastructure investments over the next five years. Mobile edge computing, dynamic spectrum access, and latency reduction techniques are among the emerging trends, further enhancing network capabilities and user experience. For instance, a leading telecom provider implemented AI-based network function virtualization and spectrum allocation algorithms, resulting in a 20% increase in network capacity and improved user equipment management. Network security protocols and self-organizing networks ensure network reliability and resilience, while machine learning RAN and network performance indicators provide valuable insights for intelligent resource allocation.
    • Overall, the AI-powered RAN market is a dynamic and evolving landscape, with continuous innovation and advancements shaping the future of network infrastructure and communications.

    What are the Key Data Covered in this AI-Powered Radio Access Network Market Research and Growth Report?

    • What is the expected growth of the AI-Powered Radio Access Network Market between 2025 and 2029?

      • USD 2.36 billion, at a CAGR of 45.6%

    • What segmentation does the market report cover?

      • The report is segmented by Component (Hardware, Software, and Services), Type (Hybrid RAN, Virtualized RAN, and Open RAN), Deployment (On-premises and Cloud), and Geography (APAC, North America, Europe, Middle East and Africa, and South America)

    • Which regions are analyzed in the report?

      • APAC, North America, Europe, Middle East and Africa, and South America

    • What are the key growth drivers and market challenges?

      • Escalating complexity of 5G and future networks, Data complexity and model trustworthiness

    • Who are the major players in the AI-Powered Radio Access Network Market?

      • Airspan Networks Holdings Inc., Broadcom Inc., Cisco Systems Inc., CommScope Holding Co. Inc., DeepSig Inc., Fujitsu Ltd., Huawei Technologies Co. Ltd., Intel Corp., Mavenir Systems Inc., NEC Corp., Nokia Corp., NVIDIA Corp., Parallel Wireless Inc., Qualcomm Inc., Radisys Corp., Rakuten Group Inc., Samsung Electronics Co. Ltd., Telefonaktiebolaget LM Ericsson, Wind River Systems Inc., and ZTE Corp.

    Market Research Insights

    • The market for AI-powered radio access networks is continuously evolving, with open interface standards and advanced technologies like 5G network architecture shaping its development. Two significant trends characterize this market. First, network traffic management and data analytics dashboards have witnessed substantial growth, with predictive network modeling and software-defined radio enabling network element management and improved user experience. Second, the industry anticipates a 30% expansion over the next five years, driven by the deployment of cloud-based RAN infrastructure, edge computing, and network security enhancements. For instance, network slicing orchestration and real-time network monitoring have led to resource allocation strategies that reduce operational costs and enhance network performance optimization.
    • Additionally, AI-powered network control and radio access technology contribute to spectrum efficiency improvements and automated network configuration, ensuring network security enhancements and network performance optimization. An example of the market's impact can be seen in a telecom company that experienced a 25% increase in sales due to the implementation of AI-driven network solutions.

    We can help! Our analysts can customize this ai-powered radio access network market research report to meet your requirements.

    Get in touch

    1 Executive Summary

    • 1.1 Market overview
      • Executive Summary - Chart on Market Overview
      • Executive Summary - Data Table on Market Overview
      • Executive Summary - Chart on Global Market Characteristics
      • Executive Summary - Chart on Market by Geography
      • Executive Summary - Chart on Market Segmentation by Component
      • Executive Summary - Chart on Market Segmentation by Type
      • Executive Summary - Chart on Market Segmentation by Deployment
      • Executive Summary - Chart on Incremental Growth
      • Executive Summary - Data Table on Incremental Growth
      • Executive Summary - Chart on Company Market Positioning

    2 Technavio Analysis

    • 2.1 Analysis of price sensitivity, lifecycle, customer purchase basket, adoption rates, and purchase criteria
      • Analysis of price sensitivity, lifecycle, customer purchase basket, adoption rates, and purchase criteria
    • 2.2 Criticality of inputs and Factors of differentiation
      • Overview on criticality of inputs and factors of differentiation
    • 2.3 Factors of disruption
      • Overview on factors of disruption
    • 2.4 Impact of drivers and challenges
      • Impact of drivers and challenges in 2024 and 2029

    3 Market Landscape

    • 3.1 Market ecosystem
      • Parent Market
      • Data Table on - Parent Market
    • 3.2 Market characteristics
      • Market characteristics analysis
    • 3.3 Value chain analysis
      • Value chain analysis

    4 Market Sizing

    • 4.1 Market definition
      • Offerings of companies included in the market definition
    • 4.2 Market segment analysis
      • Market segments
    • 4.3 Market size 2024
      • 4.4 Market outlook: Forecast for 2024-2029
        • Chart on Global - Market size and forecast 2024-2029 ($ million)
        • Data Table on Global - Market size and forecast 2024-2029 ($ million)
        • Chart on Global Market: Year-over-year growth 2024-2029 (%)
        • Data Table on Global Market: Year-over-year growth 2024-2029 (%)

      5 Five Forces Analysis

      • 5.1 Five forces summary
        • Five forces analysis - Comparison between 2024 and 2029
      • 5.2 Bargaining power of buyers
        • Bargaining power of buyers - Impact of key factors 2024 and 2029
      • 5.3 Bargaining power of suppliers
        • Bargaining power of suppliers - Impact of key factors in 2024 and 2029
      • 5.4 Threat of new entrants
        • Threat of new entrants - Impact of key factors in 2024 and 2029
      • 5.5 Threat of substitutes
        • Threat of substitutes - Impact of key factors in 2024 and 2029
      • 5.6 Threat of rivalry
        • Threat of rivalry - Impact of key factors in 2024 and 2029
      • 5.7 Market condition
        • Chart on Market condition - Five forces 2024 and 2029

      6 Market Segmentation by Component

      • 6.1 Market segments
        • Chart on Component - Market share 2024-2029 (%)
        • Data Table on Component - Market share 2024-2029 (%)
      • 6.2 Comparison by Component
        • Chart on Comparison by Component
        • Data Table on Comparison by Component
      • 6.3 Hardware - Market size and forecast 2024-2029
        • Chart on Hardware - Market size and forecast 2024-2029 ($ million)
        • Data Table on Hardware - Market size and forecast 2024-2029 ($ million)
        • Chart on Hardware - Year-over-year growth 2024-2029 (%)
        • Data Table on Hardware - Year-over-year growth 2024-2029 (%)
      • 6.4 Software - Market size and forecast 2024-2029
        • Chart on Software - Market size and forecast 2024-2029 ($ million)
        • Data Table on Software - Market size and forecast 2024-2029 ($ million)
        • Chart on Software - Year-over-year growth 2024-2029 (%)
        • Data Table on Software - Year-over-year growth 2024-2029 (%)
      • 6.5 Services - Market size and forecast 2024-2029
        • Chart on Services - Market size and forecast 2024-2029 ($ million)
        • Data Table on Services - Market size and forecast 2024-2029 ($ million)
        • Chart on Services - Year-over-year growth 2024-2029 (%)
        • Data Table on Services - Year-over-year growth 2024-2029 (%)
      • 6.6 Market opportunity by Component
        • Market opportunity by Component ($ million)
        • Data Table on Market opportunity by Component ($ million)

      7 Market Segmentation by Type

      • 7.1 Market segments
        • Chart on Type - Market share 2024-2029 (%)
        • Data Table on Type - Market share 2024-2029 (%)
      • 7.2 Comparison by Type
        • Chart on Comparison by Type
        • Data Table on Comparison by Type
      • 7.3 Hybrid RAN - Market size and forecast 2024-2029
        • Chart on Hybrid RAN - Market size and forecast 2024-2029 ($ million)
        • Data Table on Hybrid RAN - Market size and forecast 2024-2029 ($ million)
        • Chart on Hybrid RAN - Year-over-year growth 2024-2029 (%)
        • Data Table on Hybrid RAN - Year-over-year growth 2024-2029 (%)
      • 7.4 Virtualized RAN - Market size and forecast 2024-2029
        • Chart on Virtualized RAN - Market size and forecast 2024-2029 ($ million)
        • Data Table on Virtualized RAN - Market size and forecast 2024-2029 ($ million)
        • Chart on Virtualized RAN - Year-over-year growth 2024-2029 (%)
        • Data Table on Virtualized RAN - Year-over-year growth 2024-2029 (%)
      • 7.5 Open RAN - Market size and forecast 2024-2029
        • Chart on Open RAN - Market size and forecast 2024-2029 ($ million)
        • Data Table on Open RAN - Market size and forecast 2024-2029 ($ million)
        • Chart on Open RAN - Year-over-year growth 2024-2029 (%)
        • Data Table on Open RAN - Year-over-year growth 2024-2029 (%)
      • 7.6 Market opportunity by Type
        • Market opportunity by Type ($ million)
        • Data Table on Market opportunity by Type ($ million)

      8 Market Segmentation by Deployment

      • 8.1 Market segments
        • Chart on Deployment - Market share 2024-2029 (%)
        • Data Table on Deployment - Market share 2024-2029 (%)
      • 8.2 Comparison by Deployment
        • Chart on Comparison by Deployment
        • Data Table on Comparison by Deployment
      • 8.3 On-premises - Market size and forecast 2024-2029
        • Chart on On-premises - Market size and forecast 2024-2029 ($ million)
        • Data Table on On-premises - Market size and forecast 2024-2029 ($ million)
        • Chart on On-premises - Year-over-year growth 2024-2029 (%)
        • Data Table on On-premises - Year-over-year growth 2024-2029 (%)
      • 8.4 Cloud - Market size and forecast 2024-2029
        • Chart on Cloud - Market size and forecast 2024-2029 ($ million)
        • Data Table on Cloud - Market size and forecast 2024-2029 ($ million)
        • Chart on Cloud - Year-over-year growth 2024-2029 (%)
        • Data Table on Cloud - Year-over-year growth 2024-2029 (%)
      • 8.5 Market opportunity by Deployment
        • Market opportunity by Deployment ($ million)
        • Data Table on Market opportunity by Deployment ($ million)

      9 Customer Landscape

      • 9.1 Customer landscape overview
        • Analysis of price sensitivity, lifecycle, customer purchase basket, adoption rates, and purchase criteria

      10 Geographic Landscape

      • 10.1 Geographic segmentation
        • Chart on Market share by geography 2024-2029 (%)
        • Data Table on Market share by geography 2024-2029 (%)
      • 10.2 Geographic comparison
        • Chart on Geographic comparison
        • Data Table on Geographic comparison
      • 10.3 APAC - Market size and forecast 2024-2029
        • Chart on APAC - Market size and forecast 2024-2029 ($ million)
        • Data Table on APAC - Market size and forecast 2024-2029 ($ million)
        • Chart on APAC - Year-over-year growth 2024-2029 (%)
        • Data Table on APAC - Year-over-year growth 2024-2029 (%)
      • 10.4 North America - Market size and forecast 2024-2029
        • Chart on North America - Market size and forecast 2024-2029 ($ million)
        • Data Table on North America - Market size and forecast 2024-2029 ($ million)
        • Chart on North America - Year-over-year growth 2024-2029 (%)
        • Data Table on North America - Year-over-year growth 2024-2029 (%)
      • 10.5 Europe - Market size and forecast 2024-2029
        • Chart on Europe - Market size and forecast 2024-2029 ($ million)
        • Data Table on Europe - Market size and forecast 2024-2029 ($ million)
        • Chart on Europe - Year-over-year growth 2024-2029 (%)
        • Data Table on Europe - Year-over-year growth 2024-2029 (%)
      • 10.6 Middle East and Africa - Market size and forecast 2024-2029
        • Chart on Middle East and Africa - Market size and forecast 2024-2029 ($ million)
        • Data Table on Middle East and Africa - Market size and forecast 2024-2029 ($ million)
        • Chart on Middle East and Africa - Year-over-year growth 2024-2029 (%)
        • Data Table on Middle East and Africa - Year-over-year growth 2024-2029 (%)
      • 10.7 South America - Market size and forecast 2024-2029
        • Chart on South America - Market size and forecast 2024-2029 ($ million)
        • Data Table on South America - Market size and forecast 2024-2029 ($ million)
        • Chart on South America - Year-over-year growth 2024-2029 (%)
        • Data Table on South America - Year-over-year growth 2024-2029 (%)
      • 10.8 US - Market size and forecast 2024-2029
        • Chart on US - Market size and forecast 2024-2029 ($ million)
        • Data Table on US - Market size and forecast 2024-2029 ($ million)
        • Chart on US - Year-over-year growth 2024-2029 (%)
        • Data Table on US - Year-over-year growth 2024-2029 (%)
      • 10.9 China - Market size and forecast 2024-2029
        • Chart on China - Market size and forecast 2024-2029 ($ million)
        • Data Table on China - Market size and forecast 2024-2029 ($ million)
        • Chart on China - Year-over-year growth 2024-2029 (%)
        • Data Table on China - Year-over-year growth 2024-2029 (%)
      • 10.10 Japan - Market size and forecast 2024-2029
        • Chart on Japan - Market size and forecast 2024-2029 ($ million)
        • Data Table on Japan - Market size and forecast 2024-2029 ($ million)
        • Chart on Japan - Year-over-year growth 2024-2029 (%)
        • Data Table on Japan - Year-over-year growth 2024-2029 (%)
      • 10.11 Germany - Market size and forecast 2024-2029
        • Chart on Germany - Market size and forecast 2024-2029 ($ million)
        • Data Table on Germany - Market size and forecast 2024-2029 ($ million)
        • Chart on Germany - Year-over-year growth 2024-2029 (%)
        • Data Table on Germany - Year-over-year growth 2024-2029 (%)
      • 10.12 South Korea - Market size and forecast 2024-2029
        • Chart on South Korea - Market size and forecast 2024-2029 ($ million)
        • Data Table on South Korea - Market size and forecast 2024-2029 ($ million)
        • Chart on South Korea - Year-over-year growth 2024-2029 (%)
        • Data Table on South Korea - Year-over-year growth 2024-2029 (%)
      • 10.13 UK - Market size and forecast 2024-2029
        • Chart on UK - Market size and forecast 2024-2029 ($ million)
        • Data Table on UK - Market size and forecast 2024-2029 ($ million)
        • Chart on UK - Year-over-year growth 2024-2029 (%)
        • Data Table on UK - Year-over-year growth 2024-2029 (%)
      • 10.14 India - Market size and forecast 2024-2029
        • Chart on India - Market size and forecast 2024-2029 ($ million)
        • Data Table on India - Market size and forecast 2024-2029 ($ million)
        • Chart on India - Year-over-year growth 2024-2029 (%)
        • Data Table on India - Year-over-year growth 2024-2029 (%)
      • 10.15 Canada - Market size and forecast 2024-2029
        • Chart on Canada - Market size and forecast 2024-2029 ($ million)
        • Data Table on Canada - Market size and forecast 2024-2029 ($ million)
        • Chart on Canada - Year-over-year growth 2024-2029 (%)
        • Data Table on Canada - Year-over-year growth 2024-2029 (%)
      • 10.16 France - Market size and forecast 2024-2029
        • Chart on France - Market size and forecast 2024-2029 ($ million)
        • Data Table on France - Market size and forecast 2024-2029 ($ million)
        • Chart on France - Year-over-year growth 2024-2029 (%)
        • Data Table on France - Year-over-year growth 2024-2029 (%)
      • 10.17 Australia - Market size and forecast 2024-2029
        • Chart on Australia - Market size and forecast 2024-2029 ($ million)
        • Data Table on Australia - Market size and forecast 2024-2029 ($ million)
        • Chart on Australia - Year-over-year growth 2024-2029 (%)
        • Data Table on Australia - Year-over-year growth 2024-2029 (%)
      • 10.18 Market opportunity by geography
        • Market opportunity by geography ($ million)
        • Data Tables on Market opportunity by geography ($ million)

      11 Drivers, Challenges, and Opportunity/Restraints

      • 11.1 Market drivers
        • 11.2 Market challenges
          • 11.3 Impact of drivers and challenges
            • Impact of drivers and challenges in 2024 and 2029
          • 11.4 Market opportunities/restraints

            12 Competitive Landscape

            • 12.1 Overview
              • 12.2 Competitive Landscape
                • Overview on criticality of inputs and factors of differentiation
              • 12.3 Landscape disruption
                • Overview on factors of disruption
              • 12.4 Industry risks
                • Impact of key risks on business

              13 Competitive Analysis

              • 13.1 Companies profiled
                • Companies covered
              • 13.2 Company ranking index
                • Company ranking index
              • 13.3 Market positioning of companies
                • Matrix on companies position and classification
              • 13.4 Broadcom Inc.
                • Broadcom Inc. - Overview
                • Broadcom Inc. - Business segments
                • Broadcom Inc. - Key news
                • Broadcom Inc. - Key offerings
                • Broadcom Inc. - Segment focus
                • SWOT
              • 13.5 Cisco Systems Inc.
                • Cisco Systems Inc. - Overview
                • Cisco Systems Inc. - Business segments
                • Cisco Systems Inc. - Key news
                • Cisco Systems Inc. - Key offerings
                • Cisco Systems Inc. - Segment focus
                • SWOT
              • 13.6 Fujitsu Ltd.
                • Fujitsu Ltd. - Overview
                • Fujitsu Ltd. - Business segments
                • Fujitsu Ltd. - Key news
                • Fujitsu Ltd. - Key offerings
                • Fujitsu Ltd. - Segment focus
                • SWOT
              • 13.7 Huawei Technologies Co. Ltd.
                • Huawei Technologies Co. Ltd. - Overview
                • Huawei Technologies Co. Ltd. - Product / Service
                • Huawei Technologies Co. Ltd. - Key news
                • Huawei Technologies Co. Ltd. - Key offerings
                • SWOT
              • 13.8 Intel Corp.
                • Intel Corp. - Overview
                • Intel Corp. - Business segments
                • Intel Corp. - Key news
                • Intel Corp. - Key offerings
                • Intel Corp. - Segment focus
                • SWOT
              • 13.9 Mavenir Systems Inc.
                • Mavenir Systems Inc. - Overview
                • Mavenir Systems Inc. - Product / Service
                • Mavenir Systems Inc. - Key offerings
                • SWOT
              • 13.10 NEC Corp.
                • NEC Corp. - Overview
                • NEC Corp. - Business segments
                • NEC Corp. - Key news
                • NEC Corp. - Key offerings
                • NEC Corp. - Segment focus
                • SWOT
              • 13.11 Nokia Corp.
                • Nokia Corp. - Overview
                • Nokia Corp. - Business segments
                • Nokia Corp. - Key news
                • Nokia Corp. - Key offerings
                • Nokia Corp. - Segment focus
                • SWOT
              • 13.12 NVIDIA Corp.
                • NVIDIA Corp. - Overview
                • NVIDIA Corp. - Business segments
                • NVIDIA Corp. - Key news
                • NVIDIA Corp. - Key offerings
                • NVIDIA Corp. - Segment focus
                • SWOT
              • 13.13 Parallel Wireless Inc.
                • Parallel Wireless Inc. - Overview
                • Parallel Wireless Inc. - Product / Service
                • Parallel Wireless Inc. - Key offerings
                • SWOT
              • 13.14 Qualcomm Inc.
                • Qualcomm Inc. - Overview
                • Qualcomm Inc. - Business segments
                • Qualcomm Inc. - Key news
                • Qualcomm Inc. - Key offerings
                • Qualcomm Inc. - Segment focus
                • SWOT
              • 13.15 Rakuten Group Inc.
                • Rakuten Group Inc. - Overview
                • Rakuten Group Inc. - Business segments
                • Rakuten Group Inc. - Key news
                • Rakuten Group Inc. - Key offerings
                • Rakuten Group Inc. - Segment focus
                • SWOT
              • 13.16 Samsung Electronics Co. Ltd.
                • Samsung Electronics Co. Ltd. - Overview
                • Samsung Electronics Co. Ltd. - Business segments
                • Samsung Electronics Co. Ltd. - Key news
                • Samsung Electronics Co. Ltd. - Key offerings
                • Samsung Electronics Co. Ltd. - Segment focus
                • SWOT
              • 13.17 Telefonaktiebolaget LM Ericsson
                • Telefonaktiebolaget LM Ericsson - Overview
                • Telefonaktiebolaget LM Ericsson - Business segments
                • Telefonaktiebolaget LM Ericsson - Key news
                • Telefonaktiebolaget LM Ericsson - Key offerings
                • Telefonaktiebolaget LM Ericsson - Segment focus
                • SWOT
              • 13.18 ZTE Corp.
                • ZTE Corp. - Overview
                • ZTE Corp. - Business segments
                • ZTE Corp. - Key offerings
                • ZTE Corp. - Segment focus
                • SWOT

              14 Appendix

              • 14.1 Scope of the report
                • 14.2 Inclusions and exclusions checklist
                  • Inclusions checklist
                  • Exclusions checklist
                • 14.3 Currency conversion rates for US$
                  • Currency conversion rates for US$
                • 14.4 Research methodology
                  • Research methodology
                • 14.5 Data procurement
                  • Information sources
                • 14.6 Data validation
                  • Data validation
                • 14.7 Validation techniques employed for market sizing
                  • Validation techniques employed for market sizing
                • 14.8 Data synthesis
                  • Data synthesis
                • 14.9 360 degree market analysis
                  • 360 degree market analysis
                • 14.10 List of abbreviations
                  • List of abbreviations

                Research Methodology

                Technavio presents a detailed picture of the market by way of study, synthesis, and summation of data from multiple sources. The analysts have presented the various facets of the market with a particular focus on identifying the key industry influencers. The data thus presented is comprehensive, reliable, and the result of extensive research, both primary and secondary.

                INFORMATION SOURCES

                Primary sources

                • Manufacturers and suppliers
                • Channel partners
                • Industry experts
                • Strategic decision makers

                Secondary sources

                • Industry journals and periodicals
                • Government data
                • Financial reports of key industry players
                • Historical data
                • Press releases

                DATA ANALYSIS

                Data Synthesis

                • Collation of data
                • Estimation of key figures
                • Analysis of derived insights

                Data Validation

                • Triangulation with data models
                • Reference against proprietary databases
                • Corroboration with industry experts

                REPORT WRITING

                Qualitative

                • Market drivers
                • Market challenges
                • Market trends
                • Five forces analysis

                Quantitative

                • Market size and forecast
                • Market segmentation
                • Geographical insights
                • Competitive landscape

                Interested in this report?

                Get your sample now to see our research methodology and insights!

                Download Now

                Frequently Asked Questions

                Ai-Powered Radio Access Network market growth will increase by $ 2357.8 mn during 2025-2029 .

                The Ai-Powered Radio Access Network market is expected to grow at a CAGR of 45.6% during 2025-2029 .

                Ai-Powered Radio Access Network market is segmented by Component( Hardware, Software, Services) Type( Hybrid RAN, Virtualized RAN, Open RAN) Deployment( On-premises, Cloud)

                Airspan Networks Holdings Inc., Broadcom Inc., Cisco Systems Inc., CommScope Holding Co. Inc., DeepSig Inc., Fujitsu Ltd., Huawei Technologies Co. Ltd., Intel Corp., Mavenir Systems Inc., NEC Corp., Nokia Corp., NVIDIA Corp., Parallel Wireless Inc., Qualcomm Inc., Radisys Corp., Rakuten Group Inc., Samsung Electronics Co. Ltd., Telefonaktiebolaget LM Ericsson, Wind River Systems Inc., ZTE Corp. are a few of the key vendors in the Ai-Powered Radio Access Network market.

                APAC will register the highest growth rate of 36% among the other regions. Therefore, the Ai-Powered Radio Access Network market in APAC is expected to garner significant business opportunities for the vendors during the forecast period.

                China, Japan, South Korea, India, Australia, Germany, UK, France, US, Canada

                • Escalating complexity of 5G and future networksThe transition to 5G Standalone networks and the roadmap toward 6G have introduced a level of architectural and operational complexity that is orders of magnitude greater than that of previous cellular generations. Technologies such as massive MIMO is the driving factor this market.
                • dynamic spectrum sharing is the driving factor this market.
                • advanced beamforming is the driving factor this market.
                • and network slicing create an extraordinarily dynamic and multifaceted radio environment. The sheer volume of configurable parameters and the real time interplay between them make manual management and optimization methods not only inefficient but entirely unfeasible. For instance is the driving factor this market.
                • network slicing is the driving factor this market.
                • a cornerstone of 5G monetization is the driving factor this market.
                • requires the creation of multiple virtual networks on a common physical infrastructure is the driving factor this market.
                • each with guaranteed quality of service for diverse applications ranging from ultra-reliable low-latency communications for industrial automation to enhanced mobile broadband for consumer services. Managing the resource allocation is the driving factor this market.
                • isolation is the driving factor this market.
                • and service assurance for these slices in real time is a task that exceeds human capability. Artificial intelligence is therefore not merely an enhancement but a fundamental necessity to operate these sophisticated networks effectively. AI and machine learning algorithms can continuously monitor vast streams of data from the network is the driving factor this market.
                • identify complex patterns is the driving factor this market.
                • predict performance degradation is the driving factor this market.
                • and autonomously execute optimization actions. This capability is crucial for functions like real time traffic steering is the driving factor this market.
                • interference mitigation in dense urban deployments is the driving factor this market.
                • and the end to end orchestration of network slices. A significant instance demonstrating the industry push to automate this complexity was a successful trial announced in March 2024 is the driving factor this market.
                • where Ericsson and Telefonica demonstrated end-to-end automated network slicing in a 5G Standalone network is the driving factor this market.
                • showcasing the critical role of automation in delivering customized enterprise services at scale. is the driving factor this market.

                The Ai-Powered Radio Access Network market vendors should focus on grabbing business opportunities from the Hardware segment as it accounted for the largest market share in the base year.