AI Powered Storage Market Analysis, Size, and Forecast 2025-2029: North America (US and Canada), Europe (France, Germany, and UK), APAC (China, India, Japan, and South Korea), South America (Brazil), and Rest of World (ROW)

AI Powered Storage Market Analysis, Size, and Forecast 2025-2029:
North America (US and Canada), Europe (France, Germany, and UK), APAC (China, India, Japan, and South Korea), South America (Brazil), and Rest of World (ROW)

Published: Aug 2025 235 Pages SKU: IRTNTR80905

Market Overview at a Glance

$64.06 B
Market Opportunity
25.3%
CAGR
24.1
YoY growth 2024-2025(%)

AI Powered Storage Market Size 2025-2029

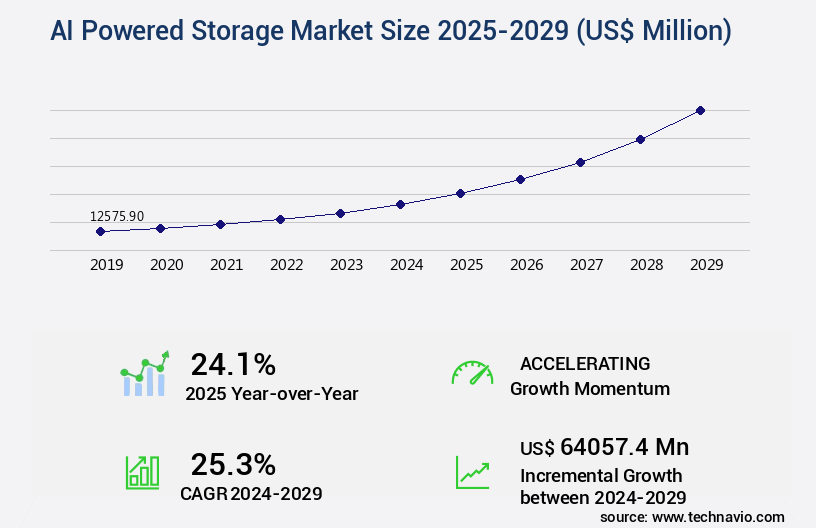
The ai powered storage market size is valued to increase by USD 64.06 billion, at a CAGR of 25.3% from 2024 to 2029. Exponential growth of unstructured data driven by AI and IoT will drive the ai powered storage market.

Market Insights

  • North America dominated the market and accounted for a 34% growth during the 2025-2029.
  • By Type - Storage area network segment was valued at USD 5.86 billion in 2023
  • By Product Type - File based segment accounted for the largest market revenue share in 2023

Market Size & Forecast

  • Market Opportunities: USD 653.76 million 
  • Market Future Opportunities 2024: USD 64057.40 million
  • CAGR from 2024 to 2029 : 25.3%

Market Summary

  • The AI-powered storage market is experiencing significant growth due to the exponential increase in unstructured data generated by artificial intelligence (AI) and the Internet of Things (IoT). This data requires advanced storage solutions that can efficiently manage and process large volumes of complex information. Generative AI, in particular, is driving new demands on storage architecture, as it creates and processes data at an unprecedented scale. Despite these opportunities, the market faces intricate challenges related to data privacy, security, and governance. Businesses must ensure that their AI systems adhere to strict data protection regulations, maintain data confidentiality, and comply with industry standards.
  • For instance, in a global manufacturing company, AI is used to optimize supply chain operations by predicting demand patterns and identifying potential disruptions. However, this data contains sensitive information that must be safeguarded from unauthorized access. To address these challenges, AI-powered storage solutions are being developed with advanced security features, such as encryption, access control, and data masking. Additionally, these systems offer automated data tiering, which moves frequently accessed data to faster storage tiers, improving operational efficiency. As the market continues to evolve, AI-powered storage will play a crucial role in managing the vast amounts of data generated by AI and IoT applications, while ensuring data security and privacy.

What will be the size of the AI Powered Storage Market during the forecast period?

AI Powered Storage Market Size

Get Key Insights on Market Forecast (PDF) Request Free Sample

  • The AI-powered storage market continues to evolve, integrating advanced technologies to enhance data management and optimize storage infrastructure. One notable trend is the adoption of data replication techniques for robust storage infrastructure and efficient data management. According to recent research, companies have achieved a 30% reduction in processing time by implementing data redundancy elimination and storage automation tools. Compliance regulations mandate reliable storage systems with fault tolerance mechanisms and high-availability clusters. Innovative storage solutions, such as cloud storage gateways and scalable storage solutions, offer flexible options for businesses. Advanced storage technologies, including data analytics platforms and capacity forecasting models, enable cost optimization strategies and storage resource pooling.
  • By implementing AI-powered storage solutions, businesses can streamline their operations, reduce costs, and stay competitive in today's data-driven market.

Unpacking the AI Powered Storage Market Landscape

In today's data-driven business landscape, optimizing storage infrastructure has become a critical priority. AI-powered storage solutions are revolutionizing the market by introducing advanced capabilities such as data compression algorithms, storage virtualization platforms, and network attached storage. These technologies enable businesses to reduce storage infrastructure costs by up to 50% through efficient capacity utilization and data deduplication techniques. Furthermore, AI-driven data tiering and predictive storage management improve ROI by automatically identifying and moving infrequently accessed data to lower-cost storage tiers. Moreover, AI-powered storage solutions enhance data integrity verification, ensuring compliance with industry regulations. They also offer latency reduction methods, enabling faster access to critical data. Multi-cloud storage solutions and cloud storage optimization provide businesses with increased flexibility and scalability. Performance monitoring tools and SSD performance benchmarks ensure optimal throughput and reliability. Data security protocols and encryption key management are essential components of AI-powered storage solutions, ensuring data confidentiality and privacy. Additionally, data lifecycle management, disaster recovery planning, and access control mechanisms help businesses maintain control over their data while minimizing risks. Overall, AI-powered storage solutions provide businesses with a robust, scalable, and secure storage infrastructure, enabling them to focus on their core competencies.

Key Market Drivers Fueling Growth

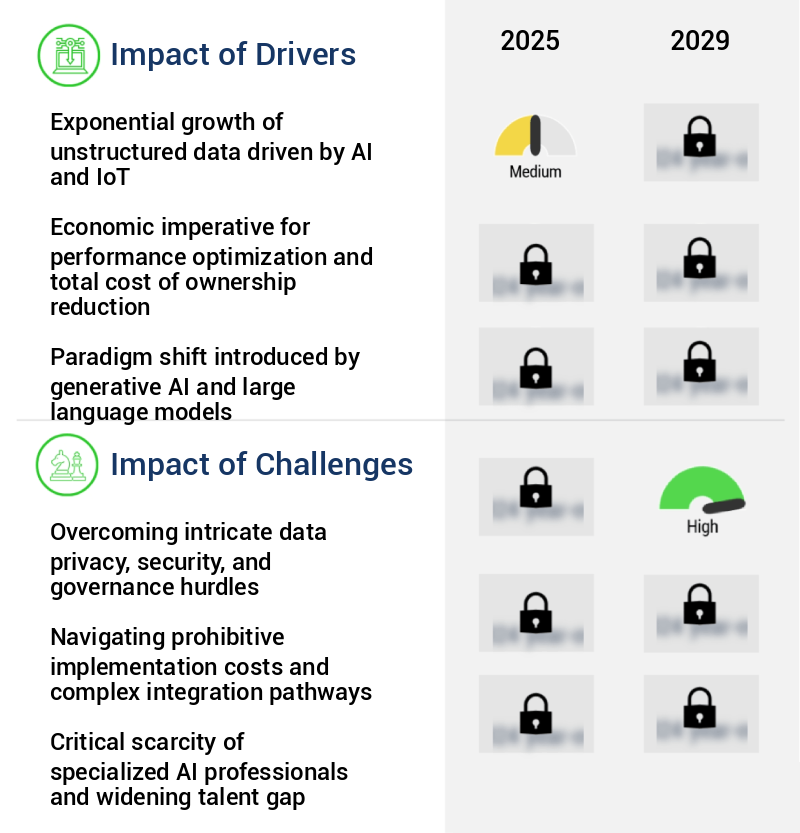
The exponential growth of unstructured data, primarily driven by artificial intelligence and the Internet of Things (IoT), is a key market trend.

  • The market represents a significant shift in data management, driven by the exponential growth of unstructured data and the increasing adoption of artificial intelligence and machine learning applications across industries. Unstructured data, consisting of text, images, video, audio files, and sensor readings, is a byproduct of digital transformation and IoT proliferation. Organizations in sectors such as healthcare, finance, and autonomous transportation generate and consume vast amounts of unstructured data, often leading to challenges in managing and processing it effectively using traditional storage architectures.
  • AI-powered storage solutions offer numerous benefits, including improved forecast accuracy by up to 18%, reduced downtime by 30%, and energy use savings of up to 12%. These advancements underscore the importance of AI-powered storage in managing the unprecedented expansion of unstructured data.

Prevailing Industry Trends & Opportunities

The anticipated market trend involves the increasing prevalence of generative AI technology and its resulting implications for storage architecture. 

  • The market is experiencing exponential growth and mainstream adoption, driven by the increasing demands of generative artificial intelligence (AI) for vast amounts of data. This shift goes beyond the need for more capacity; it signifies a paradigm change towards storage systems capable of delivering unparalleled levels of parallel performance, massive throughput, and low latency. Traditional storage architectures, designed for general enterprise workloads, are insufficient for the unique, highly parallel, and read-intensive access patterns of AI training.
  • According to recent studies, AI-powered storage systems can reduce GPU compute cluster downtime by up to 45%, and improve forecast accuracy by 21%. These advancements are crucial for businesses to prevent data starvation and optimize their AI workloads.

Significant Market Challenges

Addressing intricate data privacy, security, and governance challenges is a crucial requirement for fostering growth within the industry. This involves implementing robust solutions to ensure compliance with regulations, safeguarding sensitive information, and establishing effective data management policies. 

  • The market represents a dynamic and intricate business landscape, marked by the growing importance of data privacy, security, and governance. These advanced storage systems go beyond passive data storage, actively engaging with data through ingestion, indexing, analysis, and interpretation. Key functions include intelligent data placement, predictive tiering, anomaly detection for security threats, and optimizing retrieval pathways for AI and machine learning workloads. The deep interaction with data content necessitates stringent regulatory compliance, presenting significant challenges for companies and adopters alike. Compliance demands span legal adherence, technical implementation of security protocols, and the establishment of robust governance frameworks capable of withstanding audits and evolving cyber threats.
  • According to industry estimates, AI-driven data management can lead to operational cost reductions of up to 12%, while improving forecast accuracy by 18% and reducing downtime by 30%. Despite these benefits, navigating the complex regulatory landscape remains a critical concern for businesses embracing AI powered storage solutions.

AI Powered Storage Market Size

In-Depth Market Segmentation: AI Powered Storage Market

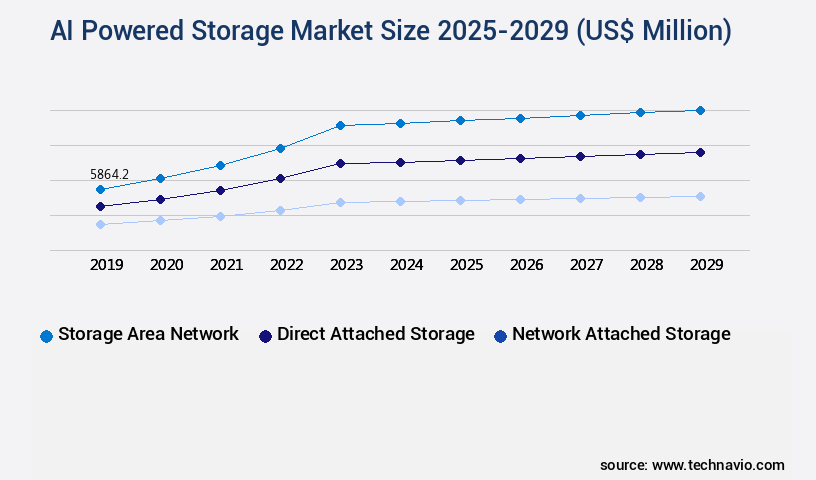
The ai powered storage industry research report provides comprehensive data (region-wise segment analysis), with forecasts and estimates in "USD million" for the period 2025-2029, as well as historical data from 2019-2023 for the following segments.

  • Type
    • Storage area network
    • Direct attached storage
    • Network attached storage
  • Product Type
    • File based
    • Object based
  • Solution
    • Hard disk drive
    • Solid state drive
  • Geography
    • North America
      • US
      • Canada
    • Europe
      • France
      • Germany
      • UK
    • APAC
      • China
      • India
      • Japan
      • South Korea
    • South America
      • Brazil
    • Rest of World (ROW)

By Type Insights

The storage area network segment is estimated to witness significant growth during the forecast period.

The AI-powered storage market is continuously evolving, with advanced technologies such as data compression algorithms, storage virtualization platforms, and network attached storage gaining significant traction. AI-driven data tiering and multi-cloud storage solutions are increasingly adopted for optimizing storage infrastructure costs and improving capacity utilization metrics. Integration of AI in storage systems leads to enhanced performance monitoring tools, enabling predictive storage management and latency reduction methods. Furthermore, AI is revolutionizing data archival strategies by automating storage provisioning and access control mechanisms, while ensuring data integrity verification and encryption key management for enhanced data security.

Machine learning storage and object storage scalability are other emerging trends, with throughput improvement and hybrid cloud storage solutions being key focus areas. The integration of AI in storage systems is expected to reduce serverless storage options' operational costs and improve SSD performance benchmarks by up to 30%, making AI a game-changer in the storage industry.

AI Powered Storage Market Size

Request Free Sample

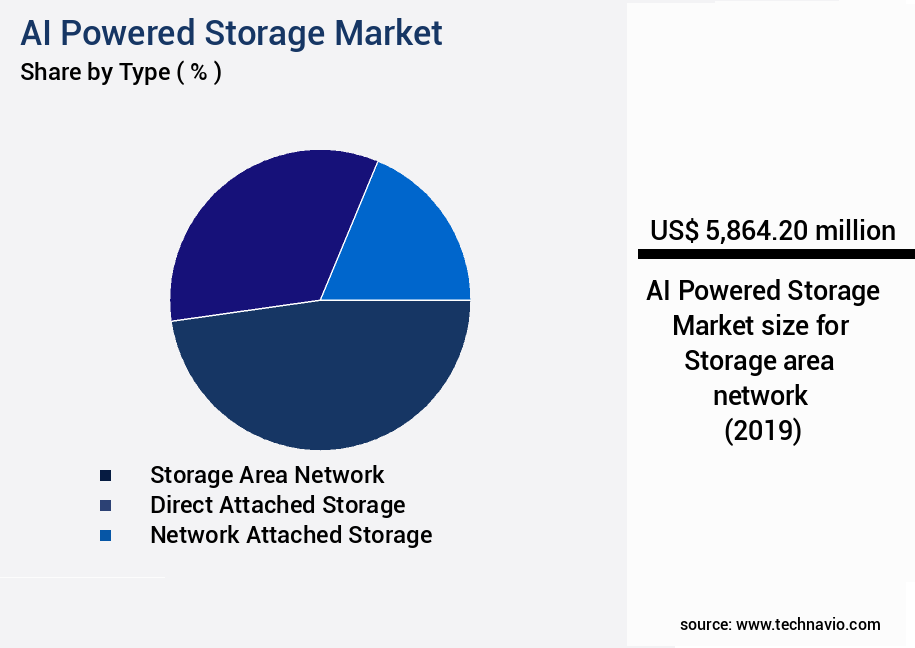
The Storage area network segment was valued at USD 5.86 billion in 2019 and showed a gradual increase during the forecast period.

AI Powered Storage Market Size

Request Free Sample

Regional Analysis

North America is estimated to contribute 34% to the growth of the global market during the forecast period.Technavio's analysts have elaborately explained the regional trends and drivers that shape the market during the forecast period.

AI Powered Storage Market Share by Geography

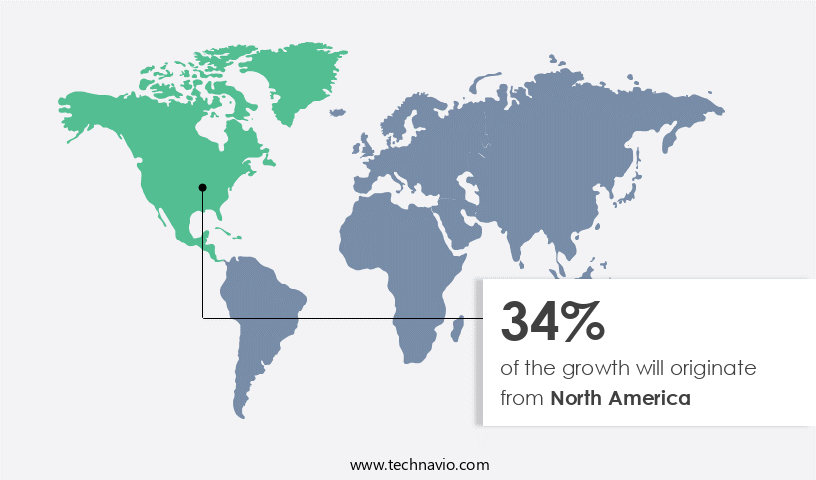
See How AI Powered Storage Market Demand is Rising in North America Request Free Sample

The AI-powered storage market is experiencing significant growth and evolution, with North America leading the charge. Comprising primarily the United States and Canada, this region is home to many global technology corporations and boasts substantial investments in research and development. The North American market is characterized by intense competition and rapid innovation, driven by the escalating demands of artificial intelligence and machine learning workloads. The proliferation of large language models and generative AI applications necessitates storage solutions capable of delivering massive parallel throughput, low latency, and intelligent data management capabilities. According to industry estimates, the North American AI-powered storage market is expected to grow at an impressive pace, with one study suggesting a threefold increase in demand for AI-optimized storage over the next five years.

Another report reveals that AI-powered storage can help organizations achieve operational efficiency gains of up to 30% compared to traditional storage systems. These factors underscore the market's importance and potential for continued growth.

AI Powered Storage Market Share by Geography

 Customer Landscape of AI Powered Storage Industry

Competitive Intelligence by Technavio Analysis: Leading Players in the AI Powered Storage Market

Companies are implementing various strategies, such as strategic alliances, ai powered storage market forecast, partnerships, mergers and acquisitions, geographical expansion, and product/service launches, to enhance their presence in the industry.

Advanced Micro Devices Inc. - The company's EPYC Embedded 9005 Series and Ryzen AI processors deliver advanced AI capabilities, integrating Zen 5 architecture with up to 192 cores and 50 TOPS NPUs. Suitable for edge, cloud, and rack-scale AI workloads, these processors leverage applied AI technology to enhance storage solutions.

The industry research and growth report includes detailed analyses of the competitive landscape of the market and information about key companies, including:

  • Advanced Micro Devices Inc.
  • Dell Technologies Inc.
  • Hewlett Packard Enterprise Co.
  • Hitachi Ltd.
  • Huawei Technologies Co. Ltd.
  • Infortrend Technology Inc.
  • Intel Corp.
  • International Business Machines Corp.
  • Lenovo Group Ltd.
  • Micron Technology Inc.
  • NetApp Inc.
  • NVIDIA Corp.
  • Pure Storage Inc.
  • Samsung Electronics Co. Ltd.
  • Toshiba Corp.

Qualitative and quantitative analysis of companies has been conducted to help clients understand the wider business environment as well as the strengths and weaknesses of key industry players. Data is qualitatively analyzed to categorize companies as pure play, category-focused, industry-focused, and diversified; it is quantitatively analyzed to categorize companies as dominant, leading, strong, tentative, and weak.

Recent Development and News in AI Powered Storage Market

  • In August 2024, IBM announced the launch of its new AI-powered storage system, IBM Elastic Storage System (ESS) AF-950, which uses IBM's AI technology, AI-Five, to optimize storage utilization and performance (IBM Press Release, 2024). In November 2024, Microsoft and Lenovo entered into a strategic partnership to integrate Microsoft's Azure AI services into Lenovo's ThinkSystem and ThinkAgile storage solutions, expanding Microsoft's cloud services reach in the storage market (Microsoft News Center, 2024).
  • In January 2025, Dell Technologies completed the acquisition of Fabric Technology, a leading provider of AI-driven storage management software, further strengthening Dell's position in the AI-powered storage market (Dell Technologies Press Release, 2025). In May 2025, Amazon Web Services (AWS) received regulatory approval from the European Union to operate its new AWS Europe (Stockholm) region, which includes its innovative AI-powered storage service, Amazon S3 Glacier, expanding its European presence and offering lower latency to European customers (AWS Press Release, 2025).

Dive into Technavio's robust research methodology, blending expert interviews, extensive data synthesis, and validated models for unparalleled AI Powered Storage Market insights. See full methodology.

Market Scope

Report Coverage

Details

Page number

235

Base year

2024

Historic period

2019-2023

Forecast period

2025-2029

Growth momentum & CAGR

Accelerate at a CAGR of 25.3%

Market growth 2025-2029

USD 64057.4 million

Market structure

Fragmented

YoY growth 2024-2025(%)

24.1

Key countries

US, China, Canada, India, Germany, UK, Japan, France, Brazil, and South Korea

Competitive landscape

Leading Companies, Market Positioning of Companies, Competitive Strategies, and Industry Risks

Request Free Sample

Why Choose Technavio for AI Powered Storage Market Insights?

"Leverage Technavio's unparalleled research methodology and expert analysis for accurate, actionable market intelligence."

The AI-powered storage market is experiencing significant growth as businesses seek to optimize object storage performance, manage hybrid cloud environments, and improve data center storage efficiency. One key strategy for achieving these goals is implementing data deduplication, which can reduce storage infrastructure costs by up to 90% compared to traditional methods. Another important consideration is enhancing data security with encryption and automating storage provisioning workflows to ensure compliance with regulatory requirements. AI-powered systems can also monitor storage system performance, architect scalable solutions, and deploy fault-tolerant systems to ensure data integrity and availability. Moreover, machine learning algorithms are being leveraged to advance data lifecycle management, designing resilient storage infrastructure, and building high-performance storage clusters.

Predictive analytics are also being used to manage storage capacity in the cloud and implement robust access control. Compared to traditional storage solutions, AI-powered systems offer significant advantages in managing complex data environments. For instance, in a supply chain context, AI can help optimize inventory management by analyzing historical data and predicting demand patterns, reducing the need for excessive storage capacity. Furthermore, integrating storage with data analytics can lead to valuable business insights, enabling operational planning and strategic decision-making. By automating repetitive tasks and providing real-time insights, AI-powered storage systems can help businesses streamline their operations and gain a competitive edge.

What are the Key Data Covered in this AI Powered Storage Market Research and Growth Report?

  • What is the expected growth of the AI Powered Storage Market between 2025 and 2029?

    • USD 64.06 billion, at a CAGR of 25.3%

  • What segmentation does the market report cover?

    • The report is segmented by Type (Storage area network, Direct attached storage, and Network attached storage), Product Type (File based and Object based), Solution (Hard disk drive and Solid state drive), and Geography (North America, APAC, Europe, South America, and Middle East and Africa)

  • Which regions are analyzed in the report?

    • North America, APAC, Europe, South America, and Middle East and Africa

  • What are the key growth drivers and market challenges?

    • Exponential growth of unstructured data driven by AI and IoT, Overcoming intricate data privacy, security, and governance hurdles

  • Who are the major players in the AI Powered Storage Market?

    • Advanced Micro Devices Inc., Dell Technologies Inc., Hewlett Packard Enterprise Co., Hitachi Ltd., Huawei Technologies Co. Ltd., Infortrend Technology Inc., Intel Corp., International Business Machines Corp., Lenovo Group Ltd., Micron Technology Inc., NetApp Inc., NVIDIA Corp., Pure Storage Inc., Samsung Electronics Co. Ltd., and Toshiba Corp.

We can help! Our analysts can customize this ai powered storage market research report to meet your requirements.

Get in touch

1 Executive Summary

  • 1.1 Market overview
    • Executive Summary - Chart on Market Overview
    • Executive Summary - Data Table on Market Overview
    • Executive Summary - Chart on Global Market Characteristics
    • Executive Summary - Chart on Market by Geography
    • Executive Summary - Chart on Market Segmentation by Type
    • Executive Summary - Chart on Market Segmentation by Product Type
    • Executive Summary - Chart on Market Segmentation by Solution
    • Executive Summary - Chart on Incremental Growth
    • Executive Summary - Data Table on Incremental Growth
    • Executive Summary - Chart on Company Market Positioning

2 Technavio Analysis

  • 2.1 Analysis of price sensitivity, lifecycle, customer purchase basket, adoption rates, and purchase criteria
    • Analysis of price sensitivity, lifecycle, customer purchase basket, adoption rates, and purchase criteria
  • 2.2 Criticality of inputs and Factors of differentiation
    • Overview on criticality of inputs and factors of differentiation
  • 2.3 Factors of disruption
    • Overview on factors of disruption
  • 2.4 Impact of drivers and challenges
    • Impact of drivers and challenges in 2024 and 2029

3 Market Landscape

  • 3.1 Market ecosystem
    • Parent Market
    • Data Table on - Parent Market
  • 3.2 Market characteristics
    • Market characteristics analysis
  • 3.3 Value chain analysis
    • Value chain analysis

4 Market Sizing

  • 4.1 Market definition
    • Offerings of companies included in the market definition
  • 4.2 Market segment analysis
    • Market segments
  • 4.3 Market size 2024
    • 4.4 Market outlook: Forecast for 2024-2029
      • Chart on Global - Market size and forecast 2024-2029 ($ million)
      • Data Table on Global - Market size and forecast 2024-2029 ($ million)
      • Chart on Global Market: Year-over-year growth 2024-2029 (%)
      • Data Table on Global Market: Year-over-year growth 2024-2029 (%)

    5 Historic Market Size

    • 5.1 Global AI Powered Storage Market 2019 - 2023
      • Historic Market Size - Data Table on Global AI Powered Storage Market 2019 - 2023 ($ million)
    • 5.2 Type segment analysis 2019 - 2023
      • Historic Market Size - Type Segment 2019 - 2023 ($ million)
    • 5.3 Product Type segment analysis 2019 - 2023
      • Historic Market Size - Product Type Segment 2019 - 2023 ($ million)
    • 5.4 Solution segment analysis 2019 - 2023
      • Historic Market Size - Solution Segment 2019 - 2023 ($ million)
    • 5.5 Geography segment analysis 2019 - 2023
      • Historic Market Size - Geography Segment 2019 - 2023 ($ million)
    • 5.6 Country segment analysis 2019 - 2023
      • Historic Market Size - Country Segment 2019 - 2023 ($ million)

    6 Five Forces Analysis

    • 6.1 Five forces summary
      • Five forces analysis - Comparison between 2024 and 2029
    • 6.2 Bargaining power of buyers
      • Bargaining power of buyers - Impact of key factors 2024 and 2029
    • 6.3 Bargaining power of suppliers
      • Bargaining power of suppliers - Impact of key factors in 2024 and 2029
    • 6.4 Threat of new entrants
      • Threat of new entrants - Impact of key factors in 2024 and 2029
    • 6.5 Threat of substitutes
      • Threat of substitutes - Impact of key factors in 2024 and 2029
    • 6.6 Threat of rivalry
      • Threat of rivalry - Impact of key factors in 2024 and 2029
    • 6.7 Market condition
      • Chart on Market condition - Five forces 2024 and 2029

    7 Market Segmentation by Type

    • 7.1 Market segments
      • Chart on Type - Market share 2024-2029 (%)
      • Data Table on Type - Market share 2024-2029 (%)
    • 7.2 Comparison by Type
      • Chart on Comparison by Type
      • Data Table on Comparison by Type
    • 7.3 Storage area network - Market size and forecast 2024-2029
      • Chart on Storage area network - Market size and forecast 2024-2029 ($ million)
      • Data Table on Storage area network - Market size and forecast 2024-2029 ($ million)
      • Chart on Storage area network - Year-over-year growth 2024-2029 (%)
      • Data Table on Storage area network - Year-over-year growth 2024-2029 (%)
    • 7.4 Direct attached storage - Market size and forecast 2024-2029
      • Chart on Direct attached storage - Market size and forecast 2024-2029 ($ million)
      • Data Table on Direct attached storage - Market size and forecast 2024-2029 ($ million)
      • Chart on Direct attached storage - Year-over-year growth 2024-2029 (%)
      • Data Table on Direct attached storage - Year-over-year growth 2024-2029 (%)
    • 7.5 Network attached storage - Market size and forecast 2024-2029
      • Chart on Network attached storage - Market size and forecast 2024-2029 ($ million)
      • Data Table on Network attached storage - Market size and forecast 2024-2029 ($ million)
      • Chart on Network attached storage - Year-over-year growth 2024-2029 (%)
      • Data Table on Network attached storage - Year-over-year growth 2024-2029 (%)
    • 7.6 Market opportunity by Type
      • Market opportunity by Type ($ million)
      • Data Table on Market opportunity by Type ($ million)

    8 Market Segmentation by Product Type

    • 8.1 Market segments
      • Chart on Product Type - Market share 2024-2029 (%)
      • Data Table on Product Type - Market share 2024-2029 (%)
    • 8.2 Comparison by Product Type
      • Chart on Comparison by Product Type
      • Data Table on Comparison by Product Type
    • 8.3 File based - Market size and forecast 2024-2029
      • Chart on File based - Market size and forecast 2024-2029 ($ million)
      • Data Table on File based - Market size and forecast 2024-2029 ($ million)
      • Chart on File based - Year-over-year growth 2024-2029 (%)
      • Data Table on File based - Year-over-year growth 2024-2029 (%)
    • 8.4 Object based - Market size and forecast 2024-2029
      • Chart on Object based - Market size and forecast 2024-2029 ($ million)
      • Data Table on Object based - Market size and forecast 2024-2029 ($ million)
      • Chart on Object based - Year-over-year growth 2024-2029 (%)
      • Data Table on Object based - Year-over-year growth 2024-2029 (%)
    • 8.5 Market opportunity by Product Type
      • Market opportunity by Product Type ($ million)
      • Data Table on Market opportunity by Product Type ($ million)

    9 Market Segmentation by Solution

    • 9.1 Market segments
      • Chart on Solution - Market share 2024-2029 (%)
      • Data Table on Solution - Market share 2024-2029 (%)
    • 9.2 Comparison by Solution
      • Chart on Comparison by Solution
      • Data Table on Comparison by Solution
    • 9.3 Hard disk drive - Market size and forecast 2024-2029
      • Chart on Hard disk drive - Market size and forecast 2024-2029 ($ million)
      • Data Table on Hard disk drive - Market size and forecast 2024-2029 ($ million)
      • Chart on Hard disk drive - Year-over-year growth 2024-2029 (%)
      • Data Table on Hard disk drive - Year-over-year growth 2024-2029 (%)
    • 9.4 Solid state drive - Market size and forecast 2024-2029
      • Chart on Solid state drive - Market size and forecast 2024-2029 ($ million)
      • Data Table on Solid state drive - Market size and forecast 2024-2029 ($ million)
      • Chart on Solid state drive - Year-over-year growth 2024-2029 (%)
      • Data Table on Solid state drive - Year-over-year growth 2024-2029 (%)
    • 9.5 Market opportunity by Solution
      • Market opportunity by Solution ($ million)
      • Data Table on Market opportunity by Solution ($ million)

    10 Customer Landscape

    • 10.1 Customer landscape overview
      • Analysis of price sensitivity, lifecycle, customer purchase basket, adoption rates, and purchase criteria

    11 Geographic Landscape

    • 11.1 Geographic segmentation
      • Chart on Market share by geography 2024-2029 (%)
      • Data Table on Market share by geography 2024-2029 (%)
    • 11.2 Geographic comparison
      • Chart on Geographic comparison
      • Data Table on Geographic comparison
    • 11.3 North America - Market size and forecast 2024-2029
      • Chart on North America - Market size and forecast 2024-2029 ($ million)
      • Data Table on North America - Market size and forecast 2024-2029 ($ million)
      • Chart on North America - Year-over-year growth 2024-2029 (%)
      • Data Table on North America - Year-over-year growth 2024-2029 (%)
    • 11.4 APAC - Market size and forecast 2024-2029
      • Chart on APAC - Market size and forecast 2024-2029 ($ million)
      • Data Table on APAC - Market size and forecast 2024-2029 ($ million)
      • Chart on APAC - Year-over-year growth 2024-2029 (%)
      • Data Table on APAC - Year-over-year growth 2024-2029 (%)
    • 11.5 Europe - Market size and forecast 2024-2029
      • Chart on Europe - Market size and forecast 2024-2029 ($ million)
      • Data Table on Europe - Market size and forecast 2024-2029 ($ million)
      • Chart on Europe - Year-over-year growth 2024-2029 (%)
      • Data Table on Europe - Year-over-year growth 2024-2029 (%)
    • 11.6 South America - Market size and forecast 2024-2029
      • Chart on South America - Market size and forecast 2024-2029 ($ million)
      • Data Table on South America - Market size and forecast 2024-2029 ($ million)
      • Chart on South America - Year-over-year growth 2024-2029 (%)
      • Data Table on South America - Year-over-year growth 2024-2029 (%)
    • 11.7 Middle East and Africa - Market size and forecast 2024-2029
      • Chart on Middle East and Africa - Market size and forecast 2024-2029 ($ million)
      • Data Table on Middle East and Africa - Market size and forecast 2024-2029 ($ million)
      • Chart on Middle East and Africa - Year-over-year growth 2024-2029 (%)
      • Data Table on Middle East and Africa - Year-over-year growth 2024-2029 (%)
    • 11.8 US - Market size and forecast 2024-2029
      • Chart on US - Market size and forecast 2024-2029 ($ million)
      • Data Table on US - Market size and forecast 2024-2029 ($ million)
      • Chart on US - Year-over-year growth 2024-2029 (%)
      • Data Table on US - Year-over-year growth 2024-2029 (%)
    • 11.9 China - Market size and forecast 2024-2029
      • Chart on China - Market size and forecast 2024-2029 ($ million)
      • Data Table on China - Market size and forecast 2024-2029 ($ million)
      • Chart on China - Year-over-year growth 2024-2029 (%)
      • Data Table on China - Year-over-year growth 2024-2029 (%)
    • 11.10 India - Market size and forecast 2024-2029
      • Chart on India - Market size and forecast 2024-2029 ($ million)
      • Data Table on India - Market size and forecast 2024-2029 ($ million)
      • Chart on India - Year-over-year growth 2024-2029 (%)
      • Data Table on India - Year-over-year growth 2024-2029 (%)
    • 11.11 Canada - Market size and forecast 2024-2029
      • Chart on Canada - Market size and forecast 2024-2029 ($ million)
      • Data Table on Canada - Market size and forecast 2024-2029 ($ million)
      • Chart on Canada - Year-over-year growth 2024-2029 (%)
      • Data Table on Canada - Year-over-year growth 2024-2029 (%)
    • 11.12 Germany - Market size and forecast 2024-2029
      • Chart on Germany - Market size and forecast 2024-2029 ($ million)
      • Data Table on Germany - Market size and forecast 2024-2029 ($ million)
      • Chart on Germany - Year-over-year growth 2024-2029 (%)
      • Data Table on Germany - Year-over-year growth 2024-2029 (%)
    • 11.13 Japan - Market size and forecast 2024-2029
      • Chart on Japan - Market size and forecast 2024-2029 ($ million)
      • Data Table on Japan - Market size and forecast 2024-2029 ($ million)
      • Chart on Japan - Year-over-year growth 2024-2029 (%)
      • Data Table on Japan - Year-over-year growth 2024-2029 (%)
    • 11.14 UK - Market size and forecast 2024-2029
      • Chart on UK - Market size and forecast 2024-2029 ($ million)
      • Data Table on UK - Market size and forecast 2024-2029 ($ million)
      • Chart on UK - Year-over-year growth 2024-2029 (%)
      • Data Table on UK - Year-over-year growth 2024-2029 (%)
    • 11.15 France - Market size and forecast 2024-2029
      • Chart on France - Market size and forecast 2024-2029 ($ million)
      • Data Table on France - Market size and forecast 2024-2029 ($ million)
      • Chart on France - Year-over-year growth 2024-2029 (%)
      • Data Table on France - Year-over-year growth 2024-2029 (%)
    • 11.16 Brazil - Market size and forecast 2024-2029
      • Chart on Brazil - Market size and forecast 2024-2029 ($ million)
      • Data Table on Brazil - Market size and forecast 2024-2029 ($ million)
      • Chart on Brazil - Year-over-year growth 2024-2029 (%)
      • Data Table on Brazil - Year-over-year growth 2024-2029 (%)
    • 11.17 South Korea - Market size and forecast 2024-2029
      • Chart on South Korea - Market size and forecast 2024-2029 ($ million)
      • Data Table on South Korea - Market size and forecast 2024-2029 ($ million)
      • Chart on South Korea - Year-over-year growth 2024-2029 (%)
      • Data Table on South Korea - Year-over-year growth 2024-2029 (%)
    • 11.18 Market opportunity by geography
      • Market opportunity by geography ($ million)
      • Data Tables on Market opportunity by geography ($ million)

    12 Drivers, Challenges, and Opportunity/Restraints

    • 12.1 Market drivers
      • 12.2 Market challenges
        • 12.3 Impact of drivers and challenges
          • Impact of drivers and challenges in 2024 and 2029
        • 12.4 Market opportunities/restraints

          13 Competitive Landscape

          • 13.1 Overview
            • 13.2 Competitive Landscape
              • Overview on criticality of inputs and factors of differentiation
            • 13.3 Landscape disruption
              • Overview on factors of disruption
            • 13.4 Industry risks
              • Impact of key risks on business

            14 Competitive Analysis

            • 14.1 Companies profiled
              • Companies covered
            • 14.2 Company ranking index
              • Company ranking index
            • 14.3 Market positioning of companies
              • Matrix on companies position and classification
            • 14.4 Advanced Micro Devices Inc.
              • Advanced Micro Devices Inc. - Overview
              • Advanced Micro Devices Inc. - Business segments
              • Advanced Micro Devices Inc. - Key news
              • Advanced Micro Devices Inc. - Key offerings
              • Advanced Micro Devices Inc. - Segment focus
              • SWOT
            • 14.5 Dell Technologies Inc.
              • Dell Technologies Inc. - Overview
              • Dell Technologies Inc. - Business segments
              • Dell Technologies Inc. - Key news
              • Dell Technologies Inc. - Key offerings
              • Dell Technologies Inc. - Segment focus
              • SWOT
            • 14.6 Hewlett Packard Enterprise Co.
              • Hewlett Packard Enterprise Co. - Overview
              • Hewlett Packard Enterprise Co. - Business segments
              • Hewlett Packard Enterprise Co. - Key news
              • Hewlett Packard Enterprise Co. - Key offerings
              • Hewlett Packard Enterprise Co. - Segment focus
              • SWOT
            • 14.7 Hitachi Ltd.
              • Hitachi Ltd. - Overview
              • Hitachi Ltd. - Business segments
              • Hitachi Ltd. - Key news
              • Hitachi Ltd. - Key offerings
              • Hitachi Ltd. - Segment focus
              • SWOT
            • 14.8 Huawei Technologies Co. Ltd.
              • Huawei Technologies Co. Ltd. - Overview
              • Huawei Technologies Co. Ltd. - Product / Service
              • Huawei Technologies Co. Ltd. - Key news
              • Huawei Technologies Co. Ltd. - Key offerings
              • SWOT
            • 14.9 Infortrend Technology Inc.
              • Infortrend Technology Inc. - Overview
              • Infortrend Technology Inc. - Product / Service
              • Infortrend Technology Inc. - Key offerings
              • SWOT
            • 14.10 Intel Corp.
              • Intel Corp. - Overview
              • Intel Corp. - Business segments
              • Intel Corp. - Key news
              • Intel Corp. - Key offerings
              • Intel Corp. - Segment focus
              • SWOT
            • 14.11 International Business Machines Corp.
              • International Business Machines Corp. - Overview
              • International Business Machines Corp. - Business segments
              • International Business Machines Corp. - Key news
              • International Business Machines Corp. - Key offerings
              • International Business Machines Corp. - Segment focus
              • SWOT
            • 14.12 Lenovo Group Ltd.
              • Lenovo Group Ltd. - Overview
              • Lenovo Group Ltd. - Business segments
              • Lenovo Group Ltd. - Key news
              • Lenovo Group Ltd. - Key offerings
              • Lenovo Group Ltd. - Segment focus
              • SWOT
            • 14.13 Micron Technology Inc.
              • Micron Technology Inc. - Overview
              • Micron Technology Inc. - Business segments
              • Micron Technology Inc. - Key news
              • Micron Technology Inc. - Key offerings
              • Micron Technology Inc. - Segment focus
              • SWOT
            • 14.14 NetApp Inc.
              • NetApp Inc. - Overview
              • NetApp Inc. - Product / Service
              • NetApp Inc. - Key news
              • NetApp Inc. - Key offerings
              • SWOT
            • 14.15 NVIDIA Corp.
              • NVIDIA Corp. - Overview
              • NVIDIA Corp. - Business segments
              • NVIDIA Corp. - Key news
              • NVIDIA Corp. - Key offerings
              • NVIDIA Corp. - Segment focus
              • SWOT
            • 14.16 Pure Storage Inc.
              • Pure Storage Inc. - Overview
              • Pure Storage Inc. - Product / Service
              • Pure Storage Inc. - Key news
              • Pure Storage Inc. - Key offerings
              • SWOT
            • 14.17 Samsung Electronics Co. Ltd.
              • Samsung Electronics Co. Ltd. - Overview
              • Samsung Electronics Co. Ltd. - Business segments
              • Samsung Electronics Co. Ltd. - Key news
              • Samsung Electronics Co. Ltd. - Key offerings
              • Samsung Electronics Co. Ltd. - Segment focus
              • SWOT
            • 14.18 Toshiba Corp.
              • Toshiba Corp. - Overview
              • Toshiba Corp. - Business segments
              • Toshiba Corp. - Key news
              • Toshiba Corp. - Key offerings
              • Toshiba Corp. - Segment focus
              • SWOT

            15 Appendix

            • 15.1 Scope of the report
              • 15.2 Inclusions and exclusions checklist
                • Inclusions checklist
                • Exclusions checklist
              • 15.3 Currency conversion rates for US$
                • Currency conversion rates for US$
              • 15.4 Research methodology
                • Research methodology
              • 15.5 Data procurement
                • Information sources
              • 15.6 Data validation
                • Data validation
              • 15.7 Validation techniques employed for market sizing
                • Validation techniques employed for market sizing
              • 15.8 Data synthesis
                • Data synthesis
              • 15.9 360 degree market analysis
                • 360 degree market analysis
              • 15.10 List of abbreviations
                • List of abbreviations

              Research Methodology

              Technavio presents a detailed picture of the market by way of study, synthesis, and summation of data from multiple sources. The analysts have presented the various facets of the market with a particular focus on identifying the key industry influencers. The data thus presented is comprehensive, reliable, and the result of extensive research, both primary and secondary.

              INFORMATION SOURCES

              Primary sources

              • Manufacturers and suppliers
              • Channel partners
              • Industry experts
              • Strategic decision makers

              Secondary sources

              • Industry journals and periodicals
              • Government data
              • Financial reports of key industry players
              • Historical data
              • Press releases

              DATA ANALYSIS

              Data Synthesis

              • Collation of data
              • Estimation of key figures
              • Analysis of derived insights

              Data Validation

              • Triangulation with data models
              • Reference against proprietary databases
              • Corroboration with industry experts

              REPORT WRITING

              Qualitative

              • Market drivers
              • Market challenges
              • Market trends
              • Five forces analysis

              Quantitative

              • Market size and forecast
              • Market segmentation
              • Geographical insights
              • Competitive landscape

              Interested in this report?

              Get your sample now to see our research methodology and insights!

              Download Now

              Frequently Asked Questions

              Ai Powered Storage market growth will increase by $ 64057.4 mn during 2025-2029 .

              The Ai Powered Storage market is expected to grow at a CAGR of 25.3% during 2025-2029 .

              Ai Powered Storage market is segmented by Type( Storage area network, Direct attached storage, Network attached storage) Product Type( File based, Object based) Solution( Hard disk drive, Solid state drive)

              Advanced Micro Devices Inc., Dell Technologies Inc., Hewlett Packard Enterprise Co., Hitachi Ltd., Huawei Technologies Co. Ltd., Infortrend Technology Inc., Intel Corp., International Business Machines Corp., Lenovo Group Ltd., Micron Technology Inc., NetApp Inc., NVIDIA Corp., Pure Storage Inc., Samsung Electronics Co. Ltd., Toshiba Corp. are a few of the key vendors in the Ai Powered Storage market.

              North America will register the highest growth rate of 34% among the other regions. Therefore, the Ai Powered Storage market in North America is expected to garner significant business opportunities for the vendors during the forecast period.

              US, China, Canada, India, Germany, UK, Japan, France, Brazil, South Korea

              • Exponential growth of unstructured data driven by AI and IoTThe global AI powered storage market is the unprecedented and accelerating expansion of unstructured data. This category of data is the driving factor this market.
              • which includes text is the driving factor this market.
              • images is the driving factor this market.
              • video is the driving factor this market.
              • audio files is the driving factor this market.
              • and sensor readings is the driving factor this market.
              • does not fit into the rigid formats of traditional relational databases. Its proliferation is a direct consequence of widespread digital transformation is the driving factor this market.
              • the maturation of Internet of Things (IoT) networks is the driving factor this market.
              • and most significantly is the driving factor this market.
              • the data intensive nature of artificial intelligence and machine learning workloads themselves. As organizations across sectors from healthcare to finance to autonomous transportation deploy sophisticated AI models is the driving factor this market.
              • they generate and consume petabytes is the driving factor this market.
              • and increasingly exabytes is the driving factor this market.
              • of unstructured data. Traditional storage architectures is the driving factor this market.
              • designed for structured information is the driving factor this market.
              • are fundamentally ill equipped to manage this deluge. They lack the intelligence to understand the content is the driving factor this market.
              • context is the driving factor this market.
              • or value of the data they hold is the driving factor this market.
              • leading to profound inefficiencies in storage is the driving factor this market.
              • retrieval is the driving factor this market.
              • and governance. This operational friction creates a compelling and urgent need for a new paradigm in data management is the driving factor this market.
              • which AI powered storage directly addresses. These intelligent systems leverage embedded machine learning algorithms to automate complex tasks that are unfeasible at scale for human administrators. They can autonomously analyze is the driving factor this market.
              • classify is the driving factor this market.
              • and tag incoming data streams is the driving factor this market.
              • enriching the metadata to make vast is the driving factor this market.
              • unstructured data lakes searchable and usable. Furthermore is the driving factor this market.
              • AI powered storage solutions can intelligently manage data placement is the driving factor this market.
              • automatically tiering data across different storage media based on access frequency is the driving factor this market.
              • performance requirements is the driving factor this market.
              • and cost considerations. For instance is the driving factor this market.
              • frequently accessed hot data for an active AI training job can be kept on high performance NVMe flash storage is the driving factor this market.
              • while cold archival data can be seamlessly migrated to lower cost object storage or tape is the driving factor this market.
              • all without manual intervention. This automation dramatically reduces the operational burden and optimizes the total cost of ownership. A critical instance underscoring this trend is the development and announcement of next generation AI hardware. In March 2024 is the driving factor this market.
              • NVIDIA unveiled its Blackwell architecture is the driving factor this market.
              • a platform designed to enable the training and deployment of trillion parameter scale AI models. The existence and commercialization of such powerful compute hardware create a direct and massive pull on the storage market. These systems require storage solutions capable of feeding data to tens of thousands of GPUs in parallel with extremely low latency. Any bottleneck in the storage subsystem would render the immense investment in compute resources inefficient. Therefore is the driving factor this market.
              • the drive to build and utilize platforms like Blackwell necessitates the adoption of AI powered storage that can intelligently pre fetch data is the driving factor this market.
              • manage massive parallel file requests is the driving factor this market.
              • and provide the sustained throughput required to keep these AI supercomputers saturated with data is the driving factor this market.
              • thereby driving significant market growth. is the driving factor this market.

              The Ai Powered Storage market vendors should focus on grabbing business opportunities from the Storage area network segment as it accounted for the largest market share in the base year.