
AI Text-to-image Generator Market Size 2025-2029
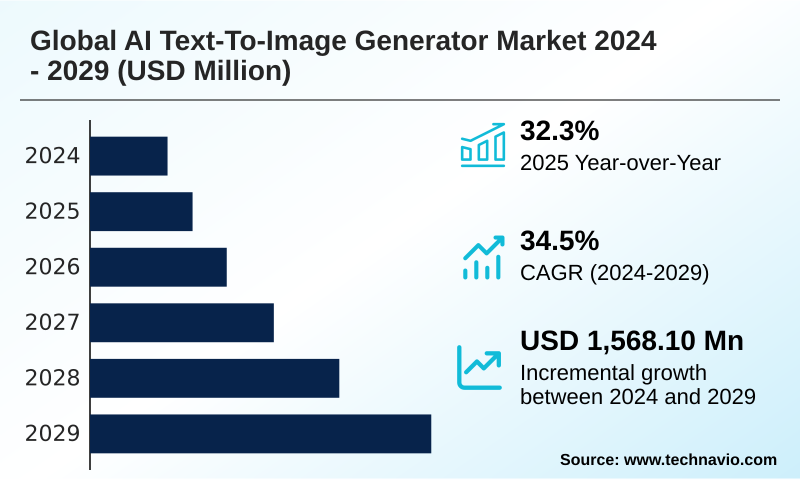
The ai text-to-image generator market size is valued to increase by USD 1.57 billion, at a CAGR of 34.5% from 2024 to 2029. Rapid advancements in generative model quality and capabilities will drive the ai text-to-image generator market.
Major Market Trends & Insights
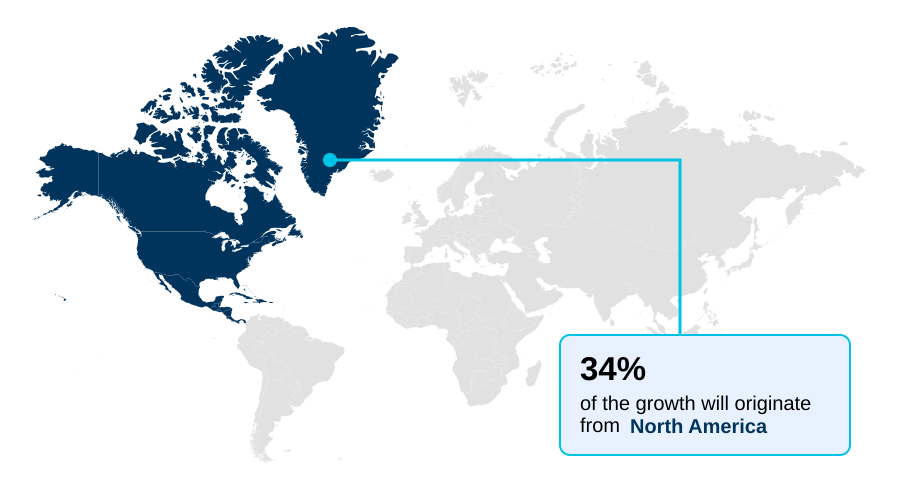
- North America dominated the market and accounted for a 33.8% growth during the forecast period.
- CAGR from 2024 to 2029 : 34.5%
Market Summary
- The AI text-to-image generator market is undergoing extraordinary expansion, driven by rapid advancements in model architecture and a surge in viable commercial applications. The underlying technology, primarily centered on diffusion models, has matured at an accelerated pace, yielding significant improvements in image fidelity, coherence, and the nuanced interpretation of complex textual prompts.
- This has transformed AI image generation from a novelty into an integral component of the digital content creation supply chain. For instance, a global e-commerce firm can now leverage the technology for personalized advertising at scale, generating thousands of unique product lifestyle images tailored to different customer demographics. This capability drastically reduces production costs and timelines compared to traditional photoshoots.
- The market is also witnessing a strategic push toward enterprise-grade solutions that offer commercial safety and legal indemnification, addressing critical copyright concerns and unlocking the technology for risk-averse organizations.
- As the technology becomes more accessible through user-friendly interfaces and API integrations, it is poised to reshape creative workflows across industries, from media and entertainment to product design and marketing, solidifying its role as a transformative force in the digital economy.
What will be the Size of the AI Text-to-image Generator Market during the forecast period?
Get Key Insights on Market Forecast (PDF) Get Free Sample
How is the AI Text-to-image Generator Market Segmented?
The ai text-to-image generator industry research report provides comprehensive data (region-wise segment analysis), with forecasts and estimates in "USD million" for the period 2025-2029.
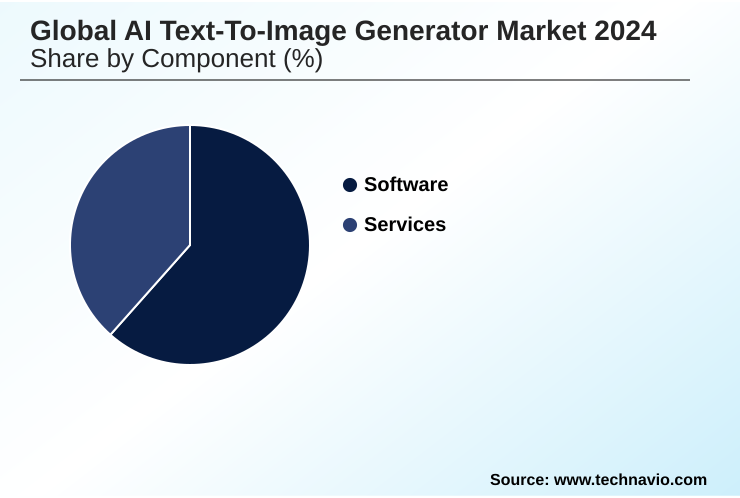
- Component
- Software
- Services
- Deployment
- Cloud-based
- On-premises
- End-user
- Individual
- Enterprise
- Geography
- North America
- US
- Canada
- Mexico
- Europe
- Germany
- UK
- France
- APAC
- China
- South Korea
- Japan
- South America
- Brazil
- Argentina
- Colombia
- Middle East and Africa
- South Africa
- Saudi Arabia
- UAE
- Rest of World (ROW)
- North America
By Component Insights
The software segment is estimated to witness significant growth during the forecast period.
The software segment is the core of the market, defined by platforms enabling AI-assisted creation. These systems, often built on advanced diffusion models, are shifting toward enterprise-grade generative AI solutions focused on scalable visual content production.
Integration is key, with APIs connecting to digital asset management and marketing automation systems to enhance AI for professional workflows. Advanced features like generative fill and accurate text rendering in images allow for the creation of brand-aligned AI visuals.
While the computational resource requirement is high, firms using these AI-powered creative tools report a 30% acceleration in project completion times.
This focus on integration and performance is critical for applications like generative AI for e-commerce, where speed and consistency are paramount.
Regional Analysis
North America is estimated to contribute 33.8% to the growth of the global market during the forecast period.Technavio’s analysts have elaborately explained the regional trends and drivers that shape the market during the forecast period.
See How AI Text-to-image Generator Market Demand is Rising in North America Get Free Sample
The geographic landscape is led by North America, which accounts for over 33% of new enterprise integrations due to its focus on enterprise-grade generative AI and commercial safety.
This region pioneers multimodal AI ecosystems and dynamic content generation, including text-to-video synthesis. In contrast, Europe's market is shaped by stringent regulations, driving demand for compliant platforms for scalable visual content production.
APAC is defined by mobile-first adoption for rapid campaign prototyping, particularly in generative AI in media production. Innovations like synthetic data generation and advanced in-painting and out-painting features see rapid global adoption.
AI image generation API integration is a universal driver, enabling specialized applications like generative AI for industrial design worldwide and boosting workflow efficiencies by 40%.
Market Dynamics
Our researchers analyzed the data with 2024 as the base year, along with the key drivers, trends, and challenges. A holistic analysis of drivers will help companies refine their marketing strategies to gain a competitive advantage.
- The strategic implementation of AI text-to-image generators hinges on addressing specific, high-value use cases that deliver a clear return on investment. For creative industries, the focus is on ai tools for creative storyboarding and using generative fill for image expansion, which has been shown to reduce pre-production timelines by over 40% compared to manual methods.
- In marketing, automating personalized ad creation with ai and leveraging ai for rapid campaign prototyping are paramount. Enterprises are increasingly comparing on-premises vs cloud ai generators to balance security with scalability, a decision that deeply impacts the total cost of ownership.
- Achieving character consistency in ai and rendering legible text with ai are no longer niche features but core requirements for branding. The push for legally compliant ai image generation has made securing enterprise-grade generative ai a boardroom-level conversation. Success depends on fine-tuning ai for brand aesthetics and evaluating photorealism in ai images to ensure outputs are on-brand.
- Applications now span from generative ai for architectural visualization to generative ai in product design cycles, all demanding cost-effective visual content production. Tackling the challenges of ai data provenance and mitigating bias in ai models are essential for long-term viability, particularly as text-to-video synthesis in media becomes more prevalent.
What are the key market drivers leading to the rise in the adoption of AI Text-to-image Generator Industry?
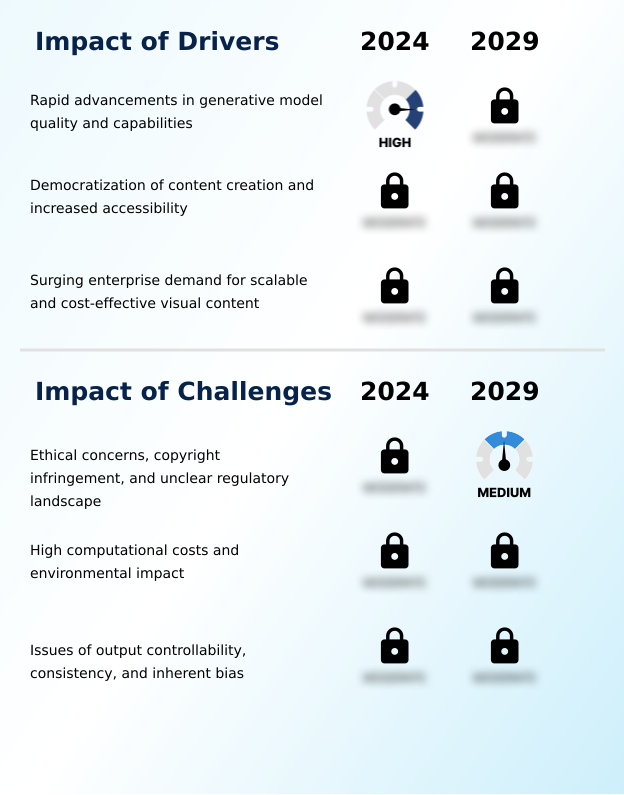
- The market's primary driver is the extraordinary pace of technological advancement, which has dramatically improved the quality, realism, coherence, and interpretative capacity of generative models.
- The market is propelled by rapid advancements in model quality, particularly in high-fidelity image generation and photorealism.
- Improved prompt understanding allows for superior semantic nuance interpretation and compositional coherence, which is crucial for applications like concept art and storyboarding and AI for architectural visualization.
- This enables personalized advertising at scale, with some campaigns reporting a 25% increase in engagement. The push for multimodality is expanding capabilities into real-time image generation and beyond.
- To meet enterprise needs for commercially safe AI models, vendors are prioritizing ethically sourced training data. This trend supports both cloud-based access and secure on-premises AI deployment, offering flexibility for organizations managing sensitive intellectual property.
What are the market trends shaping the AI Text-to-image Generator Industry?
- A defining market trend is the decisive pivot from experimental novelties to robust, enterprise-grade solutions built upon a foundation of commercial safety and legal indemnification.
- A defining trend is the shift from one-shot generation toward creative workflow automation, where secure generative AI solutions provide fine-grained control. Platforms are moving beyond legacy generative adversarial networks to offer sophisticated, user-friendly AI interfaces that enable rapid ideation and prototyping.
- Achieving style consistency and character consistency across multiple assets is now a primary focus, with some tools delivering an 80% improvement in maintaining visual identity. This AI-driven design iteration is enabled by model fine-tuning for custom generative models.
- Through cross-platform AI integration, these tools become an ambient contextual utility, transforming how creative professionals work daily and reducing concept development time by half.
What challenges does the AI Text-to-image Generator Industry face during its growth?
- The market is confronted by a paramount challenge involving the complex and unresolved web of ethical concerns, copyright infringement issues, and an unclear regulatory landscape.
- A primary challenge involves navigating the complex legal landscape to ensure legally compliant AI generation, where clear data provenance is essential. Providers offering legal indemnification face lower enterprise adoption hurdles.
- Concurrently, mitigating bias in AI models is critical, as algorithmic bias can undermine AI for brand storytelling and produce harmful outputs, with audits showing biased results in over 60% of unmanaged models. The high inference costs for automated ad creative variations also restrain profitability.
- To combat misuse, especially with AI-generated educational content or AI for product visualization, robust AI content moderation and technical solutions like digital watermarks for content provenance are becoming standard requirements, though they increase operational overhead by up to 15%.
Exclusive Technavio Analysis on Customer Landscape
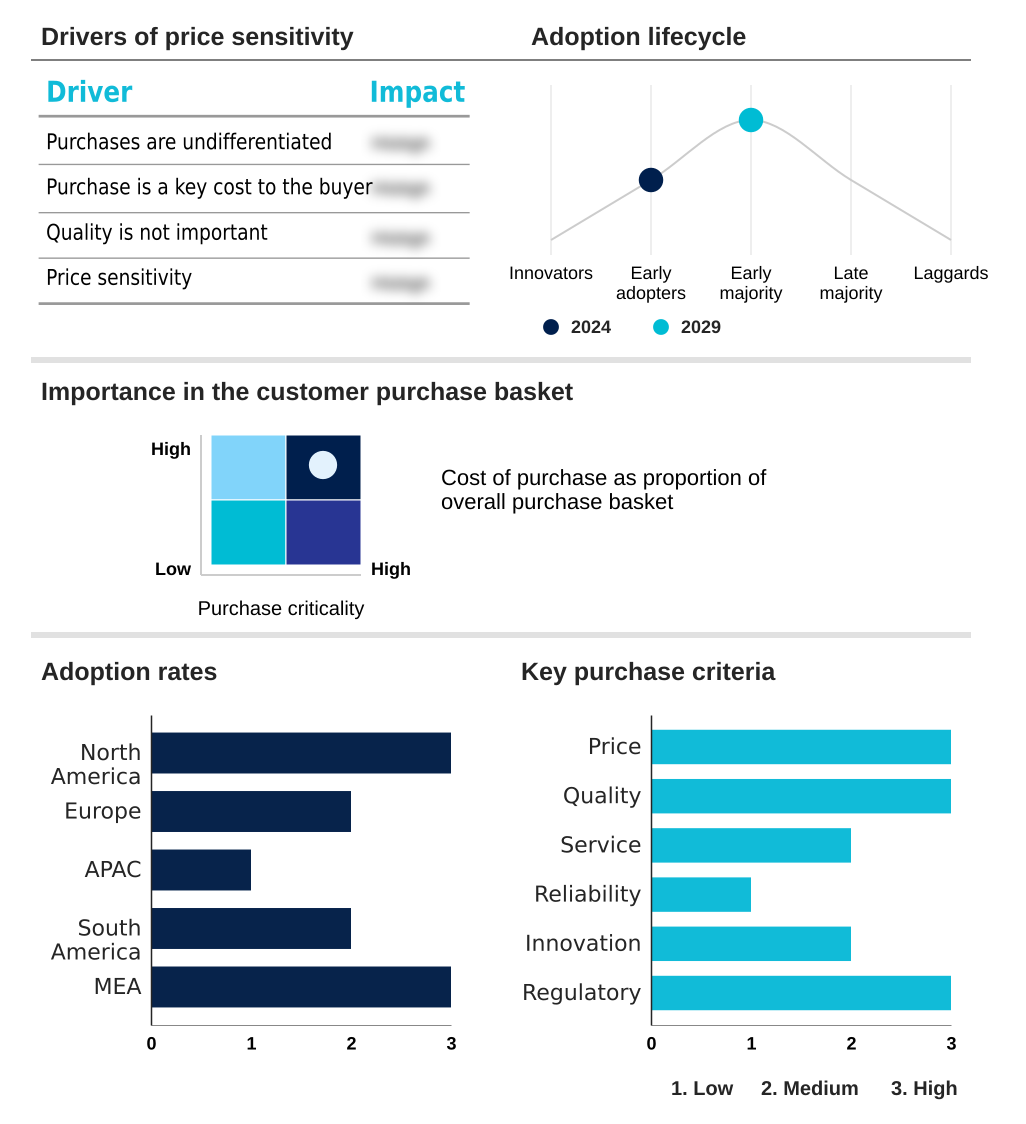
The ai text-to-image generator market forecasting report includes the adoption lifecycle of the market, covering from the innovator’s stage to the laggard’s stage. It focuses on adoption rates in different regions based on penetration. Furthermore, the ai text-to-image generator market report also includes key purchase criteria and drivers of price sensitivity to help companies evaluate and develop their market growth analysis strategies.
Customer Landscape of AI Text-to-image Generator Industry
Competitive Landscape
Companies are implementing various strategies, such as strategic alliances, ai text-to-image generator market forecast, partnerships, mergers and acquisitions, geographical expansion, and product/service launches, to enhance their presence in the industry.
Adobe Inc. - Key offerings center on commercially safe, API-accessible models that enable style-guided creativity and multimodal learning for diverse enterprise and creator applications.
The industry research and growth report includes detailed analyses of the competitive landscape of the market and information about key companies, including:
- Adobe Inc.
- AISEO
- Canva Pty Ltd.
- DeepAI
- Fotor
- getimg.ai
- Getty Images Holdings Inc.
- Google LLC
- Ideogram AI
- Jasper AI Inc.
- Microsoft Corp.
- Midjourney
- NightCafe Studio Pty Ltd
- OpenAI
- Runway AI Inc.
- Stability AI
- StarryAI
- WOMBO Dream
- Writesonic Inc.
Qualitative and quantitative analysis of companies has been conducted to help clients understand the wider business environment as well as the strengths and weaknesses of key industry players. Data is qualitatively analyzed to categorize companies as pure play, category-focused, industry-focused, and diversified; it is quantitatively analyzed to categorize companies as dominant, leading, strong, tentative, and weak.
Recent Development and News in Ai text-to-image generator market
- In August, 2024, Artifex AI, a prominent European AI lab, announced a strategic partnership with a leading global stock photography agency to develop a new commercially safe generative model trained exclusively on licensed content, offering full indemnification to enterprise users.
- In November, 2024, Synthesis Labs, a major US-based research firm, launched Genesis V2, a groundbreaking text-to-video model capable of generating coherent, 15-second video clips in 4K resolution from a single text prompt, with a focus on enterprise use in marketing and pre-production.
- In January, 2025, Creative Suite Inc., a dominant software provider, integrated advanced generative fill and character consistency features into its flagship photo editing application, allowing millions of professional users to perform complex in-painting and maintain brand assets across projects.
- In April, 2025, the APAC AI Alliance, a consortium of technology firms and regulatory bodies, published a comprehensive framework for ethical AI development, mandating digital watermarking and content provenance standards for all generative media platforms operating within member nations.
Dive into Technavio’s robust research methodology, blending expert interviews, extensive data synthesis, and validated models for unparalleled AI Text-to-image Generator Market insights. See full methodology.
| Market Scope | |
|---|---|
| Page number | 274 |
| Base year | 2024 |
| Forecast period | 2025-2029 |
| Growth momentum & CAGR | Accelerate at a CAGR of 34.5% |
| Market growth 2025-2029 | USD 1568.1 million |
| Market structure | Fragmented |
| YoY growth 2024-2025(%) | 32.3% |
| Key countries | US, Canada, Mexico, Germany, UK, France, Spain, Italy, The Netherlands, China, South Korea, Japan, India, Australia, Indonesia, Brazil, Argentina, Colombia, South Africa, Saudi Arabia, UAE, Israel and Turkey |
| Competitive landscape | Leading Companies, Market Positioning of Companies, Competitive Strategies, and Industry Risks |
Research Analyst Overview
- The AI text-to-image generator market is maturing beyond novelty, with a significant shift toward enterprise-grade generative AI solutions. The technology, underpinned by diffusion models and generative adversarial networks, now enables creative workflow automation at an unprecedented scale. Key advancements include enhanced photorealism, superior prompt understanding, and effective semantic nuance interpretation.
- Features once considered experimental, such as in-painting, out-painting, and generative fill, are becoming standard, offering fine-grained control. Achieving style consistency and character consistency are critical for creating brand-aligned AI visuals and are now primary development goals. The move toward multimodality is creating comprehensive multimodal AI ecosystems capable of text-to-video synthesis and dynamic content generation.
- However, success is increasingly tied to commercial safety and legal indemnification, forcing a reliance on ethically sourced training data and robust content provenance systems with digital watermarks. This focus on trust is critical, as platforms with strong AI content moderation and measures against algorithmic bias have seen a 25% higher adoption rate in regulated industries.
- The high computational resource requirement and inference costs remain a barrier, pushing interest in on-premises AI deployment and continuous model fine-tuning for efficiency. Ultimately, the market trajectory is toward AI-assisted creation and rendering legible text in images as an ambient contextual utility.
What are the Key Data Covered in this AI Text-to-image Generator Market Research and Growth Report?
-
What is the expected growth of the AI Text-to-image Generator Market between 2025 and 2029?
-
USD 1.57 billion, at a CAGR of 34.5%
-
-
What segmentation does the market report cover?
-
The report is segmented by Component (Software, and Services), Deployment (Cloud-based, and On-premises), End-user (Individual, and Enterprise) and Geography (North America, Europe, APAC, South America, Middle East and Africa)
-
-
Which regions are analyzed in the report?
-
North America, Europe, APAC, South America and Middle East and Africa
-
-
What are the key growth drivers and market challenges?
-
Rapid advancements in generative model quality and capabilities, Ethical concerns, copyright infringement, and unclear regulatory landscape
-
-
Who are the major players in the AI Text-to-image Generator Market?
-
Adobe Inc., AISEO, Canva Pty Ltd., DeepAI, Fotor, getimg.ai, Getty Images Holdings Inc., Google LLC, Ideogram AI, Jasper AI Inc., Microsoft Corp., Midjourney, NightCafe Studio Pty Ltd, OpenAI, Runway AI Inc., Stability AI, StarryAI, WOMBO Dream and Writesonic Inc.
-
Market Research Insights
- The market's dynamics are increasingly shaped by the push for secure generative AI solutions and AI for professional workflows. Enterprises are adopting AI-powered creative tools for real-time image generation and automated ad creative variations, with early adopters reporting a 20% increase in campaign performance and a 40% reduction in content production cycles.
- The integration of generative AI for e-commerce platforms has become a key differentiator, enhancing AI for product visualization and brand storytelling. As organizations prioritize legally compliant AI generation, the demand for commercially safe AI models is surging. This shift toward enterprise-grade platforms, often involving custom generative models, reflects a maturing market focused on delivering measurable business value and ROI.
- Cross-platform AI integration is another critical factor, transforming standalone tools into essential components of marketing automation and digital asset management systems.
We can help! Our analysts can customize this ai text-to-image generator market research report to meet your requirements.
 RIA -
RIA - 
